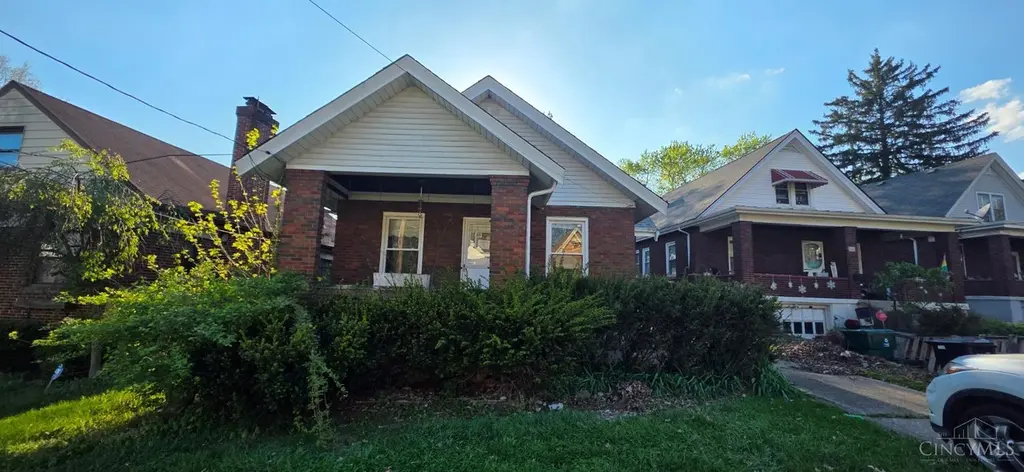
743 Clanora Dr · Cincinnati, OH
Flood risk 1/10 · Minimal
- FEMA flood zone
- X (unshaded)
- Chance of flooding over 30 yrs
- 0.0%
- Est. flood insurance / yr
- $473 – $860
Fire risk 1/10 · Minimal
- Est. fire insurance / yr
- $713 – $1,323
Heat risk 4/10 · Minor
- Hot days now (above 102°F)
- 7 days/yr
- Hot days in 30 yrs
- 19 days/yr
Wind risk 2/10 · Minimal
- Chance of severe wind over 30 yrs
- 1.0%
Air-quality risk 3/10 · Minor
- Unhealthy air days now
- 3 days/yr
- Unhealthy air days in 30 yrs
- 5 days/yr
Risk factors via First Street. Map © Google.
Why this score? — see what drove the B grade
The composite is a weighted blend of 9 inputs, each scored 0–100. Each bar is that input's sub-score; the figure is the points it added to the 100-point composite (weight × sub-score).
- Cash flow +27.9/30.0
- ARV discount +15.0/15.0
- DSCR +9.9/10.0
- 1% rule +8.4/10.0
- Livability +4.0/5.0
- Rent growth +3.3/5.0
- Schools +2.5/10.0
- Condition / age +2.5/5.0
- Appreciation +0.0/10.0
$99,900
🖨 Deal sheet (PDF) 📄 Offer letter ✓ Due diligence
Listing remarks
Financed offers must include: POF & Lender Pre-approval Letter. Cash offers must include POF. Corporate offers must include Corporate Resolution reflecting authorized signer. Buyer(s) to verify Sq Ft. of lot and structure. Property SOLD AS-IS. Offers will be reviewed after 7 days on the market. Seller may take an offer at any time.
Key facts
- 5,881 sq ft lot
- Garage
- Built 1930
Property features AI
Finance
- Other: Lot about 0.135 acre (approx. 45 x 162)
- HOA & community: No HOA
Exterior
- Parking: Detached 1-car garage; Off-street parking and driveway
- Utilities: Public water; Public sewer; Natural gas
- Home design: Single-family ranch home; One story; Residential zoning; Handyman special
- Construction: Brick construction; Shingle roof; Poured foundation; Built on one level
- Exterior features: Front porch; Shed on property; Busline nearby
Interior
- Kitchen: Eat-in kitchen; Oven/Range; Refrigerator
- Bedrooms: Primary bedroom on main level, about 12 x 12; Second bedroom on main level, about 9 x 10
- Flooring: Wall-to-wall carpet in living room
- Bathrooms: One full bathroom on main level
- Heating & cooling: Forced air heating (gas); Central air conditioning; Gas water heating
- Interior features: Multi-panel doors; Fireplace in living room (brick, gas); Full unfinished basement with concrete floor
- Laundry & utility: Basement utility space
Neighborhood map
What this means for you Summary
Snapshot
- This is a 2-bed/1.0-bath single-family listed at $100k.
Deal economics
- At list price, monthly cash flow is $307 ($4k/yr) — positive.
- The deal already cash-flows at list — no discount required.
- Meets the 1% rule at list price ($1k rent vs $100k).
- Recommended offer: $97k (3.0% below list) — sets the bar for market timing.
- Cap rate 10.0% vs local median 3.9% in Cincinnati — top-decile yield for the area; either an underpriced asset or a hidden risk that comps aren't pricing in. Stress-test before assuming the spread holds.
Location & tenants
- Location reads 80/100 on livability (#130 in OH, #1,856 nationally) — a professional / high-income tenant draw. Strengths: amenities A+, commute A+, cost of living A+; Watch: employment D, crime F.
- Cincinnati Public Schools (urban): math 25% / reading 36% proficiency, ranked #581 of 656 in OH (top 89%) — families likely to look elsewhere, expect single-tenant / working-renter base with shorter leases; 70% free/reduced lunch — lower-income household profile, screen leases tightly.
- Market conditions: Rents rising (+3.3%/yr); 70 active listings in the ZIP; 26 comparable units currently listed for rent nearby; rentals at typical pace (median 25d on market — plan ~3-4 weeks tenant-placement turnaround); lower-income renter base — watch delinquency; 801 units permitted in Hamilton County in 2024 (190 in 5+ unit buildings).
- This rent runs 37% of the median local income ($44k/yr) — at the standard rent-burdened threshold; future hikes will face affordability resistance.
Forward outlook
- Local home prices are declining (-3.0%/yr); year-one equity from $691 of loan paydown is wiped out by about $3k of value loss. Plan a longer hold.
- At projected returns (-3.0% appreciation + 3.3% rent growth), your $28k cash investment doubles in ~9 years — after that, you're playing with house money.
Negotiation context
- It's been on market 54 days — a 3% lower offer ($97k) is reasonable based on typical stale-listing flexibility.
Risks & watch-outs
- Watch-outs: built in 1930 — expect roof / HVAC / electrical / plumbing capex.
Questions for the listing agent
- It's been on market 54 days. Have you received any prior offers? Is the seller open to a 3% concession, seller financing, or rate buy-down credit?
- Built in 1930 — when were the roof, HVAC, electrical panel, plumbing, and water heater last replaced?
- Is there a deadline driving the sale (1031 exchange, divorce, estate, relocation)? That informs how much negotiation room exists.
- Schools are B-rated — typically a magnet for longer-tenancy family renters. What's the average tenant stay here, and is there a school-zone premium baked into asking?
- Crime grade is F in this area — have there been break-ins, vandalism, or insurance claims at this property in the last 3 years? What carrier currently insures it and at what premium?
- What's the average days-on-market for RENTAL listings here right now (not sales)? A rising rental-DOM trend means longer vacancies and softer asking-rent achievability than the comps imply.
- What's the recent tenant-quality profile in this submarket — average credit score on applications, eviction rate, late-payment / NSF rate, and stable-employment percentage? A property-management company in the area should have these aggregated.
- How much new for-sale + rental construction is in the pipeline within 1–3 miles? Heavy new supply typically softens prices + rents 12–24 months out; constrained supply supports both.
Investment metrics
- 1% rule
- 1.34% ✓
- Cap rate
- 9.98%
- Cash-on-cash
- 13.17%
- DSCR
- 1.59
- GRM
- 6.2
CMA / ARV
- ARV (on-the-fly)
- $170,910
- Comps found
- 12
Show comp detail 12 sales within ~0.75 mi
| Address | Dist | Beds/Ba | Sqft | Sold | Price | $/sf | Match |
|---|---|---|---|---|---|---|---|
| 582 Trenton Ave | 0.22mi | 2/2.0 | 1,056 (+0%) | 2mo | $170,000 | $161 | 84 |
| 574 Virgil Rd | 0.29mi | 3/1.0 (+1) | 1,110 (+5%) | 1mo | $180,000 | $162 | 72 |
| 627 Roebling Rd | 0.32mi | 2/1.0 | 959 (-9%) | 1mo | $170,000 | $177 | 70 |
| 749 Wilbud Dr | 0.09mi | 3/1.0 (+1) | 1,165 (+10%) | 6mo | $130,000 | $112 | 68 |
| 4305 St Lawrence Ave | 0.32mi | 3/1.5 (+1) | 988 (-6%) | 2mo | $154,000 | $156 | 66 |
| 538 Roebling Rd | 0.25mi | 2/1.5 | 1,190 (+13%) | 0mo | $226,000 | $190 | 65 |
| 761 Wilbud Dr | 0.12mi | 3/1.0 (+1) | 925 (-12%) | 6mo | $130,000 | $141 | 64 |
| 4334 W Eighth St | 0.26mi | 3/2.0 (+1) | 1,170 (+11%) | 1mo | $115,000 | $98 | 60 |
| 4619 Shady Lawn Ter | 0.61mi | 2/1.0 | 992 (-6%) | 4mo | $180,000 | $181 | 58 |
| 4778 Shadylawn Ter | 0.71mi | 2/1.0 | 992 (-6%) | 1mo | $165,000 | $166 | 56 |
| 4016 Jamestown St | 0.43mi | 2/1.0 | 1,182 (+12%) | 6mo | $95,000 | $80 | 55 |
| 522 Rentz Pl | 0.47mi | 3/1.5 (+1) | 1,160 (+10%) | 4mo | $195,000 | $168 | 51 |
Match score weights: distance 35% · size 25% · config 20% · recency 20%. Top-matched comps best support the ARV.
Projected returns pro-forma
-3.0% appreciation · 3.3% rent growth · sell at horizon
- IRR
- 3.5%
- Equity multiple
- 1.14×
- Total profit
- $3,827
- Equity at exit
- $14,895
- IRR
- 13.4%
- Equity multiple
- 2.09×
- Total profit
- $30,405
- Equity at exit
- $8,638
Cash invested: $27,972 (down + closing). Projections, not guarantees.
Landlord ↔ Tenant lean methodology
- Overall (STATE)
- 73 Landlord-Friendly
- State Ohio
- 73 Landlord-Friendly · R+6
- County
- — inherits STATE
- City
- — inherits STATE
ZIP-level market 45205
- Rents YoY
- 3.3%
- Active inventory
- 70
- Price-to-rent
- 6.2×
Monthly cashflow live
- Estimated rent
- $1,334 high interval (Pro) →
- Mortgage (P&I)
- −$524
- Tax from tax record
- −$182 /mo · $2,179/yr
- Insurance
- −$42
- HOA
- −$0
- Vacancy / Maint / Mgmt
- −$280
- Net cashflow
- $307
Break-even live
Sensitivity live
| Price | -10% $364 | -5% $335 | +0% $307 | +5% $279 | +10% $250 |
|---|---|---|---|---|---|
| Rent | -10% $202 | -5% $254 | +0% $307 | +5% $360 | +10% $412 |
| Rate | -1.0pp $357 | -0.5pp $332 | base $307 | +0.5pp $281 | +1.0pp $255 |
UW: 25.0% down · 7.5% · 30yr · 1.5% tax · 5.0% vac · 8.0% maint · 8.0% mgmt
Financing live
Cash to close
- Down payment
- $24,975
- Closing costs
- $2,997
- Reserves months
- —
- Total cash needed
- —
Loan-product check · same deal, 3 products live
Conventional
25% down · 7.5% · 30yr
- Down + closing
- —
- Monthly P&I
- —
- Monthly cashflow
- —
- DSCR
- —
- Eligible?
- —
Personal DTI + credit; lowest rate.
DSCR
20% down · 8.5% · 30yr
- Down + closing
- —
- Monthly P&I
- —
- Monthly cashflow
- —
- DSCR
- —
- Eligible?
- —
No personal income docs; deal must DSCR.
Hard money
10% down · 12.0% · 12mo
- Down + closing
- —
- Monthly P&I
- —
- Monthly cashflow
- —
- DSCR
- —
- Eligible?
- —
Short-term bridge; refi at stabilization.
Rent comps 26 comps
| Address | Beds | Baths | Sqft | Rent | $/sqft | DOM | Units | Dist |
|---|---|---|---|---|---|---|---|---|
| 4244 Loubell Ln Cincinnati, OH | 1.0 | 1.0 | 900 | $895 | $0.99 | 24d | 1 | 0.09mi |
| 4284 Foley Rd Cincinnati, OH | 3.0 | 2.0 | 1242 | $2,800 | $2.25 | 44d | 1 | 0.19mi |
| 4370 Saint Lawrence Ave #1 Cincinnati, OH | 1.0 | 1.0 | 876 | $1,050 | $1.20 | 17d | 1 | 0.42mi |
| 620 Pedretti Ave Apt A8 Cincinnati, OH | 2.0 | 1.0 | 703 | $978 | $1.39 | 15d | 1 | 0.46mi |
| 4220 Viewland Pl Cincinnati, OH | 2.0 | 1.0 | 900 | $1,495 | $1.66 | 20d | 1 | 0.50mi |
| 1057 Winfield Ave Unit 2 Cincinnati, OH | 2.0 | 1.0 | 1000 | $1,250 | $1.25 | 24d | 1 | 0.52mi |
| 466 Pedretti Ave Unit 472-10 Cincinnati, OH | 2.0 | 1.0 | 750 | $1,100 | $1.47 | 24d | 1 | 0.70mi |
| 1224 Sliker Ave Cincinnati, OH | 1.0 | 1.0 | 950 | $850 | $0.89 | 5d | 1 | 0.74mi |
| 1214 Gilsey Ave Cincinnati, OH | 3.0 | 1.0 | 1300 | $1,300 | $1.00 | 21d | 1 | 0.78mi |
| 1214 Gilsey Ave Cincinnati, OH | 3.0 | 1.0 | 1300 | $1,300 | $1.00 | 24d | 1 | 0.78mi |
| 1233 Dewey Ave Cincinnati, OH | 3.0 | 1.0 | 1411 | $1,375 | $0.97 | 5d | 1 | 0.78mi |
| 1240 Rosemont Ave Cincinnati, OH | 2.0 | 1.0 | 1280 | $1,100 | $0.86 | 21d | 1 | 0.79mi |
| 3643 W 8th St Unit 1 Cincinnati, OH | 2.0 | 1.0 | 850 | $995 | $1.17 | 24d | 1 | 0.91mi |
| 3666 Glenway Ave Cincinnati, OH | 3.0 | 1.0 | 1339 | $1,250 | $0.93 | 24d | 1 | 1.05mi |
| 1607 Minion Ave Cincinnati, OH | 3.0 | 1.5 | 1066 | $1,675 | $1.57 | 24d | 1 | 1.07mi |
| 3772 W Liberty St Cincinnati, OH | 3.0 | 1.0 | 1066 | $1,350 | $1.27 | 5d | 1 | 1.09mi |
| 1740 Minion Ave Cincinnati, OH | 2.0 | 1.0 | 1320 | $1,200 | $0.91 | 24d | 1 | 1.25mi |
| 1820 Sunset Ave Cincinnati, OH | 1.0–2.0 | 1.0 | 750 | $1,049 | $1.40 | 22d | 6 | 1.25mi |
| 717 Elberon Ave Unit Elberon 717 Cincinnati, OH | 2.0 | 1.0 | 1117 | $995 | $0.89 | 24d | 1 | 1.26mi |
| 4463 Glenhaven Rd Cincinnati, OH | 2.0 | 1.0 | 775 | $1,005 | $1.30 | 44d | 1 | 1.29mi |
| 944 Elberon Ave Cincinnati, OH | 2.0 | 1.0 | 900 | $1,200 | $1.33 | 24d | 1 | 1.34mi |
| 5039 Delhi Rd Cincinnati, OH | 1.0–2.0 | 1.0–2.0 | 952 | $1,895 | $1.99 | 2d | 10 | 1.38mi |
| 1905 Wyoming Ave Cincinnati, OH | 2.0 | 1.0 | 850 | $1,012 | $1.19 | 2d | 2 | 1.43mi |
| 1872 Sunset Ave Cincinnati, OH | 2.0 | 1.0 | 888 | $1,075 | $1.21 | 5d | 7 | 1.46mi |
| 3338 Hillside Ave Cincinnati, OH | 1.0–2.0 | 1.0 | 725 | $995 | $1.37 | 24d | 1 | 1.48mi |
| 633 Hawthorne Ave Unit 2 Cincinnati, OH | 3.0 | 1.0 | 1000 | $1,400 | $1.40 | 24d | 1 | 1.48mi |
Listing history 15 events
-
2026-06-21days on market $99,900 Active 54 DOM
-
2026-06-18days on market $99,900 Active 51 DOM
-
2026-06-17days on market $99,900 Active 50 DOM
-
2026-06-16days on market $99,900 Active 49 DOM
-
2026-06-15days on market $99,900 Active 48 DOM
-
2026-06-13days on market $99,900 Active 46 DOM
-
2026-06-13days on market $99,900 Active 45 DOM
-
2026-06-09days on market $99,900 Active 42 DOM
-
2026-06-08days on market $99,900 Active 41 DOM
-
2026-06-07days on market $99,900 Active 40 DOM
-
2026-06-03days on market $99,900 Active 36 DOM
-
2026-06-02days on market $99,900 Active 35 DOM
-
2026-06-01days on market $99,900 Active 34 DOM
-
2026-05-31days on market $99,900 Active 33 DOM
-
2026-04-28$99,900 Active
ⓘ Source: listings_history table (triggers on properties + properties_extension) + one-shot
backfill from property_details.listing_events for pre-trigger history.
Tax reassessment forecast OH · Partial reset (capped growth)
- Current annual tax
- $2,179 · $182/mo
- Projected year-2 tax
- $2,179 · $182/mo
- Expected delta
- $0/yr ($0/mo · 0.0%)
ⓘ Screening estimate from a state-policy table — verify with the county assessor before closing.
Climate risk First Street
- Flood 1/10 Low FEMA zone X (unshaded) · 0% chance over 30 yrs
- Wildfire 1/10 Low
- Heat 4/10 Moderate 7 d/yr ≥102°F today · 19 d/yr by 30 yrs out
- Wind 2/10 Low 100% chance of damaging wind over 30 yrs
- Air quality 3/10 Moderate 3 unhealthy d/yr today · 5 by 30 yrs out
Nearby sold comps map
Loading sold comps map…
Walkable amenities ~0.75 mi
Loading nearby amenities…
Taxation est. · year 1
- Rental income
- $16,013
- − Mortgage interest
- −$5,596
- − Property taxes
- −$2,179
- − Insurance
- −$500
- − Repairs & maintenance
- −$1,281
- − Management
- −$1,281
- − Depreciation
- −$2,906
- Taxable income
- $2,270
- Est. tax owed @ 24.0%
- −$545
- After-tax cash flow
- $3,140/yr
For passive investors: Depreciation is non-cash, so a rental often shows a tax loss while cash-flowing — sheltering income. Rental losses are passive: they offset passive income freely, and up to $25,000/yr can offset ordinary (W-2) income if you actively participate and your MAGI is under $100k (phasing out to $0 by $150k); unused losses carry forward. On sale, claimed depreciation is recaptured at up to 25%, and gains may owe capital-gains tax (a 1031 exchange can defer both). Figures are a year-1 estimate at your 24.0% rate — not tax advice; consult a CPA.
Schools (NCES district)
- District
- Cincinnati Public Schools
- NCES district ID
- 3904375
- Math proficiency
- 25% ▼ -19.00%
- Reading proficiency
- 36% ▼ -14.00%
- Median HH income
- $35,743
- Composite
- 25.21/100
- National rank
- #7508
- State rank
- #581 of 656 in OH
Livability — Cincinnati
- Score
- 80/100
- State rank
- #130
- US rank
- #1856
Category grades
Schools grade is shown separately in the Schools card above.
Census & demographics
- Census place
- Cincinnati, OH
- County
- Hamilton County · 701,295 people
- City population
- 505,555
- Metro
- Cincinnati, OH-KY-IN
- Population (ZIP)
- 18,651
- Household income
- $43,682
- Rent vs Own
- Severe rent burden
- 980.0
Population outlook (Hamilton County) Hauer SSP2
- Today (2025)
- 826,054 people
- By 2030
- 830,947 · +0.6%
- By 2040
- 832,319 · +0.8%
- By 2050
- 822,428 · -0.4%
- By 2075
- 788,688 · -4.5%
- By 2100
- 710,674 · -14.0%
Race, ethnicity, and origin ACS 2023
- Neighborhood character
- Diverse neighborhood (Simpson 0.69)
- Race & ethnicity
- Black 43% White 32% Hispanic / Latino 16% Two or more races 7% Asian 2%
- Hispanic origin (detail)
- Mexican 2%
- Common ancestry
- Lithuanian 1% Slovak 1% Serbian 1%
- Foreign-born
- 9% · Canada, India, China
- Languages at home
- 84% English-only · Spanish 10% Other Asian/Pacific 2% Other Indo-European 1%
Political lean MEDSL · Hamilton
- 2024 margin
- D (+14.9) · D 57.0% · R 42.1%
- 2008→2024 swing
- +7.9pp toward D · 2008: 7.0pp · 2024: 14.9pp
- All cycles
- 2024: D+14.9 2020: D+15.9 2016: D+9.5 2012: D+4.9 2008: D+7.0
Not yet ingested
- Civics
- —
Market trends
- HPI YoY
- ▼ -138.67%
- Current HPI
- 163.3375
- Rent YoY
- ▲ 3.30%
- Metro
- Cincinnati, OH-KY-IN
- State GDP YoY
- ▲ 1.98%
- F500 in state
- 48
Industry mix (Fortune 500 HQ in OH)
| Industry | F500 HQs | Revenue |
|---|---|---|
| Insurance | 3 | $145B |
|
||
| Industrial Machinery | 3 | $49B |
|
||
| Financial Services | 3 | $24B |
|
||
| Consumer Goods | 2 | $93B |
|
||
| Aerospace / Defense | 2 | $47B |
|
||
| Utilities | 2 | $33B |
|
||
Price history
1 event — show timeline
- 2026-04-28 Listed $99,900 Cincy MLS
Property tax history
+8.2%/yrLatest (2025): $2,179 · +50.1% YoY. Source: county tax records.
Cash-flow waterfall
monthlySold comps — $/sqft
last 12 mo · ≤1 miLoading sold comps…