401 W Clouse St · Mountain Grove, MO
Flood risk 1/10 · Minimal
- FEMA flood zone
- X (unshaded)
- Chance of flooding over 30 yrs
- 0.0%
- Est. flood insurance / yr
- $507 – $1,088
Fire risk 3/10 · Minor
- Est. fire insurance / yr
- $1,054 – $1,958
Heat risk 4/10 · Minor
- Hot days now (above 104°F)
- 7 days/yr
- Hot days in 30 yrs
- 19 days/yr
Wind risk 2/10 · Minimal
- Chance of severe wind over 30 yrs
- 1.0%
Air-quality risk 1/10 · Minimal
- Unhealthy air days now
- 0 days/yr
- Unhealthy air days in 30 yrs
- 0 days/yr
Risk factors via First Street. Map © Google.
Why this score? — see what drove the B- grade
The composite is a weighted blend of 9 inputs, each scored 0–100. Each bar is that input's sub-score; the figure is the points it added to the 100-point composite (weight × sub-score).
- Cash flow +30.0/30.0
- 1% rule +10.0/10.0
- DSCR +10.0/10.0
- ARV discount +7.5/15.0
- Schools +4.0/10.0
- Livability +3.3/5.0
- Rent growth +2.5/5.0
- Condition / age +2.5/5.0
- Appreciation +0.0/10.0
$30,000
🖨 Deal sheet 📄 Offer letter ✓ Due diligence
Listing remarks MLS
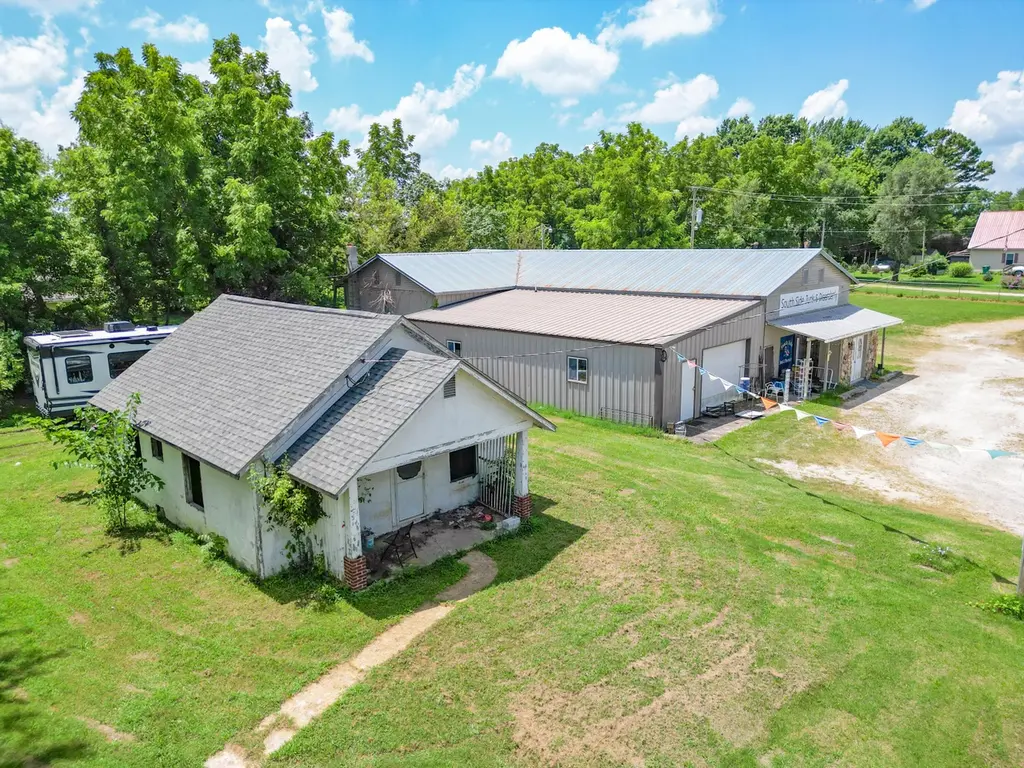
Project house and lot for sale in Mountain Grove! That property is zoned R1-C1. Newer roof and the floors are ready to be poured. Projected as a one bedroom, 1 bath. The living room is framed to have a vaulted ceiling. Flip, rental, or a small store! Blank canvas ready to be completed to meet your needs!
Key facts
- Zoned r1-c1
- Newer roof
- Vaulted ceiling
Tags
Neighborhood map
What this means for you Summary
Snapshot
- This is a 1-bed/1.0-bath other listed at $30k.
Deal economics
- At list price, monthly cash flow is $420 ($5k/yr) — positive.
- The deal already cash-flows at list — no discount required.
- Meets the 1% rule at list price ($794 rent vs $30k).
- Recommended offer: $26k (12.0% below list) — sets the bar for market timing.
- Cap rate 23.1% vs local median 2.8% in Mountain Grove — top-decile yield for the area; either an underpriced asset or a hidden risk that comps aren't pricing in. Stress-test before assuming the spread holds.
Location & tenants
- Location reads 66/100 on livability (#251 in MO) — a middle-class / working-renter tenant base. Strengths: cost of living A+, housing A-, health & safety A-; Watch: amenities F, commute F, employment F.
- Mountain Grove R-III (town): math 48% / reading 49% proficiency, ranked #73 of 324 in MO (top 22%) — families likely to look elsewhere, expect single-tenant / working-renter base with shorter leases.
- Market conditions: 129 active listings in the ZIP; 23 units permitted in Wright County in 2024 (0 in 5+ unit buildings).
Forward outlook
- Local home prices are declining (-3.0%/yr); year-one equity from $207 of loan paydown is wiped out by about $900 of value loss. Plan a longer hold.
- Wright County population projected at -28% by 2050 — secular population decline; favor cash flow + early exit over multi-decade hold.
- At projected returns (-3.0% appreciation + 3.0% rent growth), your $8k cash investment doubles in ~2 years — after that, you're playing with house money.
Negotiation context
- It's been on market 374 days — a 12% lower offer ($26k) is reasonable based on typical stale-listing flexibility.
Risks & watch-outs
- Watch-outs: built in 1955 — expect roof / HVAC / electrical / plumbing capex.
Questions for the listing agent
- It's been on market 374 days. Have you received any prior offers? Is the seller open to a 12% concession, seller financing, or rate buy-down credit?
- Built in 1955 — when were the roof, HVAC, electrical panel, plumbing, and water heater last replaced?
- Why hasn't it sold? Are there any deal-killer items the seller is aware of (foundation, flood, title, zoning, code violations)?
- Is there a deadline driving the sale (1031 exchange, divorce, estate, relocation)? That informs how much negotiation room exists.
- What's the average days-on-market for RENTAL listings here right now (not sales)? A rising rental-DOM trend means longer vacancies and softer asking-rent achievability than the comps imply.
- What's the recent tenant-quality profile in this submarket — average credit score on applications, eviction rate, late-payment / NSF rate, and stable-employment percentage? A property-management company in the area should have these aggregated.
- How much new for-sale + rental construction is in the pipeline within 1–3 miles? Heavy new supply typically softens prices + rents 12–24 months out; constrained supply supports both.
Investment metrics
- 1% rule
- 2.65% ✓
- Cap rate
- 23.09%
- Cash-on-cash
- 59.97%
- DSCR
- 3.67
- GRM
- 3.1
CMA / ARV
- ARV (median comp)
- $70,300
- List price
- $30,000
- Delta
- -57.33%
- Verdict
- UNDERPRICED
- Comps
- 20 within 1.0 mi
Projected returns pro-forma
-3.0% appreciation · 3.0% rent growth · sell at horizon
- IRR
- 58.7%
- Equity multiple
- 3.61×
- Total profit
- $21,889
- Equity at exit
- $4,473
- IRR
- 63.5%
- Equity multiple
- 7.37×
- Total profit
- $53,539
- Equity at exit
- $2,594
Cash invested: $8,400 (down + closing). Projections, not guarantees.
Landlord ↔ Tenant lean methodology
- Overall (STATE)
- 81 Strongly Landlord-Friendly
- State Missouri
- 81 Strongly Landlord-Friendly · R+10
- County
- — inherits STATE
- City
- — inherits STATE
ZIP-level market 65711
- Home prices YoY
- -14.7%
- Active inventory
- 129
- Price-to-rent
- 3.1×
Monthly cashflow live
- Estimated rent
- $794 medium interval (Pro) →
- Mortgage (P&I)
- −$157
- Tax est. 1.5%
- −$38 /mo · $450/yr
- Insurance
- −$12
- HOA
- −$0
- Vacancy / Maint / Mgmt
- −$167
- Net cashflow
- $420
Break-even live
UW: 25.0% down · 7.5% · 30yr · 1.5% tax · 5.0% vac · 8.0% maint · 8.0% mgmt
Financing live
Cash to close
- Down payment
- $7,500
- Closing costs
- $900
- Reserves months
- —
- Total cash needed
- —
Loan-product check · same deal, 3 products live
Conventional
25% down · 7.5% · 30yr
- Down + closing
- —
- Monthly P&I
- —
- Monthly cashflow
- —
- DSCR
- —
- Eligible?
- —
Personal DTI + credit; lowest rate.
DSCR
20% down · 8.5% · 30yr
- Down + closing
- —
- Monthly P&I
- —
- Monthly cashflow
- —
- DSCR
- —
- Eligible?
- —
No personal income docs; deal must DSCR.
Hard money
10% down · 12.0% · 12mo
- Down + closing
- —
- Monthly P&I
- —
- Monthly cashflow
- —
- DSCR
- —
- Eligible?
- —
Short-term bridge; refi at stabilization.
Listing history 16 events
-
2026-06-18days on market $30,000 Active 374 DOM
-
2026-06-17days on market $30,000 Active 373 DOM
-
2026-06-16days on market $30,000 Active 372 DOM
-
2026-06-15days on market $30,000 Active 371 DOM
-
2026-06-13days on market $30,000 Active 369 DOM
-
2026-06-12days on market $30,000 Active 368 DOM
-
2026-06-09days on market $30,000 Active 365 DOM
-
2026-06-08days on market $30,000 Active 364 DOM
-
2026-06-07days on market $30,000 Active 363 DOM
-
2026-06-05remarks 378-char remark
-
2026-06-05days on market $30,000 Active 361 DOM
-
2026-06-04days on market $30,000 Active 359 DOM
-
2026-06-02days on market $30,000 Active 358 DOM
-
2026-06-01days on market $30,000 Active 357 DOM
-
2026-05-31days on market $30,000 Active 356 DOM
-
2025-06-09$30,000 Active 305-char remark
Show marketing remark (305 chars)
Project house and lot for sale in Mountain Grove! That property is zoned R1-C1. Newer roof and the floors are ready to be poured. Projected as a one bedroom, 1 bath. The living room is framed to have a vaulted ceiling. Flip, rental, or a small store! Blank canvas ready to be completed to meet your needs!
ⓘ Source: listings_history table (triggers on properties + properties_extension) + one-shot
backfill from property_details.listing_events for pre-trigger history.
Climate risk First Street
- Flood 1/10 Low FEMA zone X (unshaded) · 0% chance over 30 yrs
- Wildfire 3/10 Moderate
- Heat 4/10 Moderate 7 d/yr ≥104°F today · 19 d/yr by 30 yrs out
- Wind 2/10 Low 100% chance of damaging wind over 30 yrs
- Air quality 1/10 Low 0 unhealthy d/yr today · 0 by 30 yrs out
Nearby sold comps map
Loading sold comps map…
Walkable amenities ~0.75 mi
Loading nearby amenities…
Taxation est. · year 1
- Rental income
- $9,526
- − Mortgage interest
- −$1,680
- − Property taxes
- −$450
- − Insurance
- −$150
- − Repairs & maintenance
- −$762
- − Management
- −$762
- − Depreciation
- −$873
- Taxable income
- $4,849
- Est. tax owed @ 24.0%
- −$1,164
- After-tax cash flow
- $3,874/yr
For passive investors: Depreciation is non-cash, so a rental often shows a tax loss while cash-flowing — sheltering income. Rental losses are passive: they offset passive income freely, and up to $25,000/yr can offset ordinary (W-2) income if you actively participate and your MAGI is under $100k (phasing out to $0 by $150k); unused losses carry forward. On sale, claimed depreciation is recaptured at up to 25%, and gains may owe capital-gains tax (a 1031 exchange can defer both). Figures are a year-1 estimate at your 24.0% rate — not tax advice; consult a CPA.
Schools (NCES district)
- District
- Mountain Grove R-III
- NCES district ID
- 2921510
- Math proficiency
- 48% ▲ 1.00%
- Reading proficiency
- 49% ▼ -3.00%
- Median HH income
- $30,918
- Composite
- 39.72/100
- National rank
- #3899
- State rank
- #73 of 324 in MO
Livability — Mountain Grove
- Score
- 66/100
- State rank
- #251
- US rank
- #12218
Category grades
Schools grade is shown separately in the Schools card above.
Census & demographics
- Census place
- Mountain Grove, MO
- Population (ZIP)
- 8,690
Population outlook (Wright County) Hauer SSP2
- Today (2025)
- 16,699 people
- By 2030
- 15,751 · -5.7%
- By 2040
- 13,894 · -16.8%
- By 2050
- 12,086 · -27.6%
- By 2075
- 8,301 · -50.3%
- By 2100
- 5,110 · -69.4%
Race, ethnicity, and origin ACS 2023
- Neighborhood character
- Predominantly White (89%)
- Race & ethnicity
- White 89% Two or more races 9% Hispanic / Latino 3% Asian 1%
- Common ancestry
- Italian 3% Slovak 2% Serbian 2%
- Foreign-born
- 1% · Canada
Political lean MEDSL · Wright
- 2024 margin
- Solid R (+75.7) · D 11.8% · R 87.4%
- 2008→2024 swing
- -37.8pp toward R · 2008: -37.9pp · 2024: -75.7pp
- All cycles
- 2024: R+75.7 2020: R+71.9 2016: R+68.5 2012: R+48.7 2008: R+37.9
Not yet ingested
- Civics
- —
Market trends
- HPI YoY
- ▼ -37.74%
- Current HPI
- 218.8559
- Rent YoY
- —
- Metro
- —
- State GDP YoY
- ▲ 1.84%
- F500 in state
- 20
Industry mix (Fortune 500 HQ in MO)
| Industry | F500 HQs | Revenue |
|---|---|---|
| Healthcare | 1 | $163B |
|
||
| Insurance | 1 | $21B |
|
||
| Industrial Technology | 1 | $17B |
|
||
| Retail | 1 | $16B |
|
||
| Industrial Distribution | 1 | $10B |
|
||
| Utilities | 1 | $9B |
|
||
Price history
1 event — show timeline
- 2025-06-09 Listed $30,000 SOMO
Property tax history
-6.1%/yrLatest (2025): $58 · +5.5% YoY. Source: county tax records.
Cash-flow waterfall
monthlySold comps — $/sqft
last 12 mo · ≤1 miLoading sold comps…