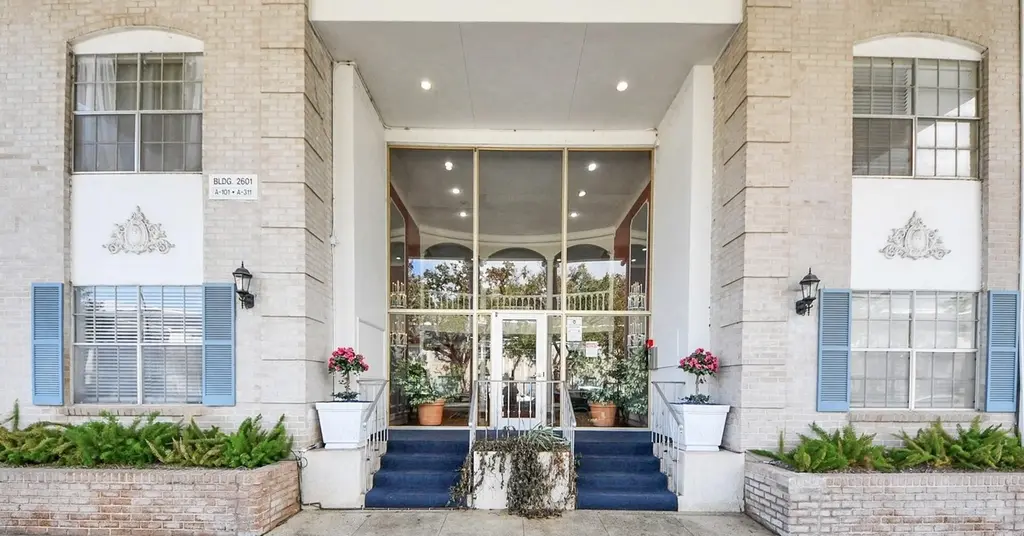
2601 Bellefontaine St Unit B219 · Houston, TX
Flood risk 6/10 · Moderate
- FEMA flood zone
- X (shaded)
- Chance of flooding over 30 yrs
- 0.74%
- Est. flood insurance / yr
- $507 – $1,088
Fire risk 1/10 · Minimal
- Est. fire insurance / yr
- $1,222 – $2,270
Heat risk 9/10 · Severe
- Hot days now (above 109°F)
- 7 days/yr
- Hot days in 30 yrs
- 24 days/yr
Wind risk 9/10 · Severe
- Chance of severe wind over 30 yrs
- 99.0%
Air-quality risk 2/10 · Minimal
- Unhealthy air days now
- 2 days/yr
- Unhealthy air days in 30 yrs
- 2 days/yr
Risk factors via First Street. Map © Google.
Why this score? — see what drove the D grade
The composite is a weighted blend of 9 inputs, each scored 0–100. Each bar is that input's sub-score; the figure is the points it added to the 100-point composite (weight × sub-score).
- ARV discount +15.0/15.0
- 1% rule +10.0/10.0
- Cash flow +5.2/30.0
- Livability +3.7/5.0
- Schools +2.7/10.0
- Condition / age +2.5/5.0
- Rent growth +1.5/5.0
- DSCR +0.0/10.0
- Appreciation +0.0/10.0
$62,000
🖨 Deal sheet (PDF) 📄 Offer letter ✓ Due diligence
Listing remarks MLS
Situated close to the Medical Center, Downtown, Herman Park, Reliant Stadium and area shopping & conveniences. All utilities included in maintenance fee. Refrigerator to stay with the condo. Make this condo home!!
Key facts
- Near downtown
- Near hermann park
- Near medical center
Tags
Property features AI
Finance
- HOA & community: The Barclay Owners Association; Monthly HOA fee of $606; HOA covers common areas, cable TV, electricity, gas, insurance, structure maintenance, recreation facilities, sewer, utilities and water
Exterior
- Parking: Assigned parking; Detached 1-car carport
- Utilities: Public water; Public sewer
- Home design: Residential property; One story; Entry level: Second level
- Construction: Built in 1960; Brick and wood siding exterior; Composition roof; Slab foundation
- Exterior features: Concrete road surface; Community pool; Curbs; Gated community
Interior
- Kitchen: Kitchen
- Bedrooms: Primary bedroom (Second level)
- Bathrooms: 1 full bathroom
- Heating & cooling: Central heating (gas); Central electric air conditioning
- Interior features: Living room; Dining room; Total of 4 rooms
Neighborhood map
What this means for you Summary
Snapshot
- This is a 1-bed/1.0-bath townhouse listed at $62k.
Deal economics
- At list price, monthly cash flow is $-141 ($-2k/yr) — negative.
- To cash-flow at today's rent, offer at most $42k (32.9% below list).
- Meets the 1% rule at list price ($1k rent vs $62k).
- Recommended offer: $42k (32.9% below list) — sets the bar for cash-flow.
Location & tenants
- Location reads 74/100 on livability (#184 in TX, #4,771 nationally) — a middle-class / working-renter tenant base. Strengths: amenities A+, cost of living A+, housing A+; Watch: crime F.
- Houston ISD (urban): math 27% / reading 35% proficiency, ranked #593 of 826 in TX (top 72%) — families likely to look elsewhere, expect single-tenant / working-renter base with shorter leases; 71% free/reduced lunch — lower-income household profile, screen leases tightly.
- Zoned schools: Pershing Middle (math 36% / reading 49%, grade D-, #553 of 1,662 statewide, top 34%, 1,390 students, 60% FRL); Lamar H S (math 38% / reading 65%, grade D+, #478 of 1,632 statewide, top 29%, 3,125 students, 49% FRL) — zoned schools average 55% FRL vs 71% district-wide (16 pts lower); this property's tenant base skews higher-income than the district average.
- Zoned-school proficiency averages 47% at this address vs 31% district-wide (+16 pts) — the actual schools serving this property are materially stronger than the Houston ISD average implies; a family-tenant draw the district grade alone would hide.
- Market conditions: Rents falling (-3.9%/yr); 230 active listings in the ZIP; 40 comparable units currently listed for rent nearby; rentals leasing fast (median 8d on market — plan ~1-2 weeks tenant-placement turnaround); solid renter incomes; 29,883 units permitted in Harris County in 2024 (8,621 in 5+ unit buildings).
- This rent is only 17% of the median local income ($81k/yr) — well below the 30% rent-burden line; pricing power to push rent on renewal without tenant pushback.
Forward outlook
- Local home prices are declining (-3.0%/yr); year-one equity from $429 of loan paydown is wiped out by about $2k of value loss. Plan a longer hold.
- Harris County population projected at +47% by 2050 — long-run rental-demand tailwind backs the buy-and-hold thesis.
Negotiation context
- Only 12 days on market — expect competitive offers; lowballing is unlikely to land.
- 2 sale attempts since 15y ago with the ask held roughly flat each time — persistent listings suggest the price (not the market) is what's stuck; bring a comps-based counter.
Risks & watch-outs
- Watch-outs: HOA is 54% of rent.
- Climate carrying-cost: major flood risk; severe wind risk, 99% chance of damaging wind over 30y; extreme-heat days projected 7→24/yr by 2055 (HVAC capex compounding) — expect insurance premiums to compound above CPI over the hold.
Questions for the listing agent
- What do current leases actually rent for vs. the listed asking? Can we see a recent rent roll and the last 12 months of T-12 income?
- Built in 1960 — when were the roof, HVAC, electrical panel, plumbing, and water heater last replaced?
- What does the HOA fee cover, when was the last increase, and are there any pending special assessments or reserve-fund shortfalls?
- Is there a deadline driving the sale (1031 exchange, divorce, estate, relocation)? That informs how much negotiation room exists.
- Schools are D-rated, which usually means shorter tenancies and higher turnover. Who's the typical renter profile here, and what's been the actual vacancy rate?
- Crime grade is F in this area — have there been break-ins, vandalism, or insurance claims at this property in the last 3 years? What carrier currently insures it and at what premium?
- The area grade is low — what's the realistic commute time and amenity access for the typical tenant pool here? Any planned neighborhood developments (good or bad) we should know about?
- What's the average days-on-market for RENTAL listings here right now (not sales)? A rising rental-DOM trend means longer vacancies and softer asking-rent achievability than the comps imply.
- What's the recent tenant-quality profile in this submarket — average credit score on applications, eviction rate, late-payment / NSF rate, and stable-employment percentage? A property-management company in the area should have these aggregated.
- How much new for-sale + rental construction is in the pipeline within 1–3 miles? Heavy new supply typically softens prices + rents 12–24 months out; constrained supply supports both.
Investment metrics
- 1% rule
- 1.82% ✓
- Cap rate
- 3.56%
- Cash-on-cash
- -9.76%
- DSCR
- 0.57
- GRM
- 4.6
CMA / ARV
- ARV (median comp)
- $93,074
- List price
- $62,000
- Delta
- -33.39%
- Verdict
- UNDERPRICED
- Comps
- 20 within 1.0 mi
Show comp detail 12 sales within ~0.75 mi
| Address | Dist | Beds/Ba | Sqft | Sold | Price | $/sf | Match |
|---|---|---|---|---|---|---|---|
| 2701 Bellefontaine St Unit A23 | 0.13mi | 1/1.0 | 712 (-4%) | 4mo | $69,800 | $98 | 84 |
| 2701 Bellefontaine St Unit A26 | 0.09mi | 1/1.0 | 672 (-10%) | 6mo | $75,000 | $112 | 75 |
| 7575 Kirby Dr #1104 | 0.30mi | 1/1.0 | 783 (+5%) | 9mo | $189,000 | $241 | 70 |
| 7575 Kirby Dr #1203 | 0.30mi | 1/1.0 | 783 (+5%) | 10mo | $199,900 | $255 | 69 |
| 2255 Braeswood Park Dr #227 | 0.74mi | 1/1.0 | 774 (+4%) | 1mo | $115,000 | $149 | 58 |
| 2255 Braeswood Park Dr #219 | 0.74mi | 1/1.0 | 774 (+4%) | 1mo | $119,000 | $154 | 58 |
| 2255 Braeswood Park Dr #296 | 0.74mi | 1/1.0 | 774 (+4%) | 2mo | $115,000 | $149 | 57 |
| 2255 Braeswood Park Dr #225 | 0.74mi | 1/1.0 | 774 (+4%) | 6mo | $120,000 | $155 | 54 |
| 2255 Braeswood Park Dr #206 | 0.74mi | 1/1.0 | 774 (+4%) | 11mo | $119,000 | $154 | 50 |
| 2255 Braeswood Park Dr #133 | 0.74mi | 1/1.0 | 774 (+4%) | 12mo | $137,500 | $178 | 49 |
| 2207 S Braeswood Blvd Unit 42H | 0.67mi | 1/1.0 | 833 (+12%) | 3mo | $99,500 | $119 | 46 |
| 2213 S Braeswood Blvd Unit 12A | 0.70mi | 1/1.0 | 833 (+12%) | 3mo | $99,500 | $119 | 45 |
Match score weights: distance 35% · size 25% · config 20% · recency 20%. Top-matched comps best support the ARV.
Projected returns pro-forma
-3.0% appreciation · 0.0% rent growth · sell at horizon
- IRR
- -43.8%
- Equity multiple
- -0.27×
- Total profit
- $-21,962
- Equity at exit
- $9,244
- IRR
- —
- Equity multiple
- -1.42×
- Total profit
- $-41,927
- Equity at exit
- $5,361
Cash invested: $17,360 (down + closing). Projections, not guarantees.
Landlord ↔ Tenant lean methodology
- Overall (STATE)
- 87 Strongly Landlord-Friendly
- State Texas
- 87 Strongly Landlord-Friendly · R+5
- County
- — inherits STATE
- City
- — inherits STATE
ZIP-level market 77025
- Rents YoY
- -3.9%
- Active inventory
- 230
- Price-to-rent
- 4.6×
Monthly cashflow live
- Estimated rent
- $1,131 high interval (Pro) →
- Mortgage (P&I)
- −$325
- Tax est. 1.5%
- −$78 /mo · $930/yr
- Insurance
- −$26
- HOA
- −$606
- Vacancy / Maint / Mgmt
- −$237
- Net cashflow
- $-141
Break-even live
Sensitivity live
| Price | -10% $-98 | -5% $-120 | +0% $-141 | +5% $-163 | +10% $-184 |
|---|---|---|---|---|---|
| Rent | -10% $-231 | -5% $-186 | +0% $-141 | +5% $-97 | +10% $-52 |
| Rate | -1.0pp $-110 | -0.5pp $-125 | base $-141 | +0.5pp $-157 | +1.0pp $-174 |
UW: 25.0% down · 7.5% · 30yr · 1.5% tax · 5.0% vac · 8.0% maint · 8.0% mgmt
Financing live
Cash to close
- Down payment
- $15,500
- Closing costs
- $1,860
- Reserves months
- —
- Total cash needed
- —
Loan-product check · same deal, 3 products live
Conventional
25% down · 7.5% · 30yr
- Down + closing
- —
- Monthly P&I
- —
- Monthly cashflow
- —
- DSCR
- —
- Eligible?
- —
Personal DTI + credit; lowest rate.
DSCR
20% down · 8.5% · 30yr
- Down + closing
- —
- Monthly P&I
- —
- Monthly cashflow
- —
- DSCR
- —
- Eligible?
- —
No personal income docs; deal must DSCR.
Hard money
10% down · 12.0% · 12mo
- Down + closing
- —
- Monthly P&I
- —
- Monthly cashflow
- —
- DSCR
- —
- Eligible?
- —
Short-term bridge; refi at stabilization.
Rent comps 40 comps
| Address | Beds | Baths | Sqft | Rent | $/sqft | DOM | Units | Dist |
|---|---|---|---|---|---|---|---|---|
| 2825 Bellefontaine Apt 105A Houston, TX | 1.0 | 1.0 | 686 | $1,150 | $1.68 | 44d | 1 | 0.18mi |
| 2831 Bellefontaine Houston, TX | 1.0 | 1.0 | 505 | $1,025 | $2.03 | 44d | 1 | 0.19mi |
| 2825 Bellefontaine Unit 123A Houston, TX | 1.0 | 1.0 | 686 | $1,150 | $1.68 | 6d | 1 | 0.20mi |
| 2825 Bellefontaine Unit 227A Houston, TX | 1.0 | 1.0 | 686 | $1,095 | $1.60 | 25d | 1 | 0.20mi |
| 2825 Bellefontaine Unit 142A Houston, TX | 1.0 | 1.0 | 505 | $1,035 | $2.05 | 44d | 1 | 0.20mi |
| 2825 Bellefontaine Unit 122A Houston, TX | 1.0 | 1.0 | 686 | $1,150 | $1.68 | 25d | 1 | 0.20mi |
| 2825 Bellefontaine Unit 231A Houston, TX | 1.0 | 1.0 | 631 | $1,025 | $1.62 | 6d | 1 | 0.20mi |
| 2825 Bellefontaine Apt 307A Houston, TX | 1.0 | 1.0 | 686 | $1,075 | $1.57 | 15d | 1 | 0.20mi |
| 7315 Brompton St Unit 7336 Houston, TX | 1.0 | 1.0 | 505 | $1,015 | $2.01 | 14d | 1 | 0.22mi |
| 7315 Brompton St Unit 7389 Houston, TX | 1.0 | 1.0 | 505 | $1,019 | $2.02 | 11d | 1 | 0.22mi |
| 7315 Brompton St Unit 324 Houston, TX | 1.0 | 1.0 | 505 | $980 | $1.94 | 8d | 1 | 0.22mi |
| 7315 Brompton St Unit 1112 Houston, TX | 1.0 | 1.0 | 505 | $1,015 | $2.01 | 0d | 1 | 0.22mi |
| 7315 Brompton St Unit 1047 Houston, TX | 1.0 | 1.0 | 505 | $1,019 | $2.02 | 3d | 1 | 0.24mi |
| 7315 Brompton St Houston, TX | 1.0–2.0 | 1.0–2.0 | 832 | $1,045 | $1.26 | 13d | 6 | 0.24mi |
| 7315 Brompton St Houston, TX | 1.0–2.0 | 1.0–2.0 | 769 | $969 | $1.26 | 5d | 6 | 0.24mi |
| 7550 Kirby Dr Houston, TX | 1.0–3.0 | 1.0–2.0 | 947 | $1,437 | $1.52 | 0d | 30 | 0.28mi |
| 7510 Brompton Rd Houston, TX | 1.0–3.0 | 1.0–2.0 | 1338 | $770 | $0.58 | 2d | 165 | 0.38mi |
| 2900 N Braeswood Blvd Houston, TX | 1.0–3.0 | 1.0–2.0 | 1193 | $1,301 | $1.09 | 0d | 30 | 0.41mi |
| 7000 Greenbriar Dr Houston, TX | 1.0–2.0 | 1.0–2.0 | 829 | $1,200 | $1.45 | 8d | 4 | 0.42mi |
| 7556 Kirby Dr Houston, TX | 1.0 | 1.0 | 715 | $1,339 | $1.87 | 44d | 1 | 0.46mi |
| 7171 Buffalo Speedway Houston, TX | 1.0–2.0 | 1.0–2.0 | 976 | $1,469 | $1.50 | 0d | 26 | 0.49mi |
| 2228 Maroneal St Houston, TX | 1.0 | 1.0 | 610 | $1,324 | $2.17 | 44d | 1 | 0.51mi |
| 2222 Maroneal St Houston, TX | 1.0–3.0 | 1.0–2.0 | 951 | $1,303 | $1.37 | 0d | 37 | 0.52mi |
| 7710 S Main St Unit 147 Houston, TX | 1.0 | 1.0 | 580 | $774 | $1.33 | 11d | 1 | 0.54mi |
| 7600 Kirby Dr Houston, TX | 3.0 | 1.0–2.0 | 931 | $1,576 | $1.69 | 0d | 29 | 0.54mi |
| 7710 S Main St Unit 7752 Houston, TX | 1.0 | 1.0 | 580 | $769 | $1.33 | 0d | 1 | 0.60mi |
| 8333 Braesmain Dr Houston, TX | 1.0–2.0 | 1.0–2.0 | 1086 | $1,457 | $1.34 | 0d | 29 | 0.69mi |
| 1333 Old Spanish Trl Unit 324 Houston, TX | 1.0 | 1.0 | 725 | $1,285 | $1.77 | 8d | 1 | 0.74mi |
| 1333 Old Spanish Trl Unit 1348 Houston, TX | 1.0 | 1.0 | 725 | $1,324 | $1.83 | 11d | 1 | 0.74mi |
| 1333 Old Spanish Trl Unit 1354 Houston, TX | 1.0 | 1.0 | 725 | $1,335 | $1.84 | 14d | 1 | 0.74mi |
| 1333 Old Spanish Trl Houston, TX | 1.0 | 1.0 | 725 | $1,274 | $1.76 | 13d | 1 | 0.76mi |
| 7900 N Stadium Dr Houston, TX | 1.0 | 1.0 | 696 | $1,250 | $1.80 | 44d | 1 | 0.76mi |
| 8600 Main St Houston, TX | 1.0 | 1.0 | 634 | $1,080 | $1.70 | 44d | 1 | 0.79mi |
| 1333 Old Spanish Trl Unit 1148 Houston, TX | 1.0 | 1.0 | 725 | $1,320 | $1.82 | 0d | 1 | 0.80mi |
| 7777 Greenbriar Houston, TX | 1.0–2.0 | 1.0–2.0 | 879 | $1,333 | $1.52 | 0d | 18 | 0.81mi |
| 1339 Old Spanish Trl Houston, TX | 1.0 | 1.0 | 725 | $1,680 | $2.32 | 44d | 1 | 0.81mi |
| 7950 N Stadium Dr Houston, TX | 1.0–2.0 | 1.0 | 696 | $1,100 | $1.58 | 8d | 3 | 0.83mi |
| 8700 Main St Houston, TX | 1.0–2.0 | 1.0–2.0 | 954 | $1,401 | $1.47 | 0d | 5 | 0.87mi |
| 1330 Old Spanish Trl Houston, TX | 1.0–2.0 | 1.0 | 726 | $1,050 | $1.45 | 0d | 7 | 0.89mi |
| 1856 Old Main St Houston, TX | 1.0 | 1.0 | 613 | $2,100 | $3.43 | 44d | 1 | 0.90mi |
HOA detail
- Monthly dues
- $606 · $7,272/yr
Listing history 5 events
-
2026-05-05status Pending 653-char remark
-
2026-04-23$62,000 Active 653-char remark
-
2011-09-07soldstatus 221-char remark
Show marketing remark (221 chars)
Situated close to the Medical Center, Downtown, Herman Park, Reliant Stadium and area shopping & conveniences. All utilities included in maintenance fee. Refrigerator to stay with the condo. Make this condo home!!
-
2011-08-26historical 221-char remark
Show marketing remark (221 chars)
Situated close to the Medical Center, Downtown, Herman Park, Reliant Stadium and area shopping & conveniences. All utilities included in maintenance fee. Refrigerator to stay with the condo. Make this condo home!!
-
2011-08-17$52,000 221-char remark
Show marketing remark (221 chars)
Situated close to the Medical Center, Downtown, Herman Park, Reliant Stadium and area shopping & conveniences. All utilities included in maintenance fee. Refrigerator to stay with the condo. Make this condo home!!
ⓘ Source: listings_history table (triggers on properties + properties_extension) + one-shot
backfill from property_details.listing_events for pre-trigger history.
Climate risk First Street
- Flood 6/10 Major FEMA zone X (shaded) · 74% chance over 30 yrs
- Wildfire 1/10 Low
- Heat 9/10 Extreme 7 d/yr ≥109°F today · 24 d/yr by 30 yrs out
- Wind 9/10 Extreme 99% chance of damaging wind over 30 yrs
- Air quality 2/10 Low 2 unhealthy d/yr today · 2 by 30 yrs out
Nearby sold comps map
Loading sold comps map…
Walkable amenities ~0.75 mi
Loading nearby amenities…
Taxation est. · year 1
- Rental income
- $13,569
- − Mortgage interest
- −$3,473
- − Property taxes
- −$930
- − Insurance
- −$310
- − Repairs & maintenance
- −$1,086
- − Management
- −$1,086
- − HOA
- −$7,272
- − Depreciation
- −$1,804
- Taxable loss
- −$2,391
- Est. tax savings @ 24.0%
- +$574
- After-tax cash flow
- $-1,120/yr
For passive investors: Depreciation is non-cash, so a rental often shows a tax loss while cash-flowing — sheltering income. Rental losses are passive: they offset passive income freely, and up to $25,000/yr can offset ordinary (W-2) income if you actively participate and your MAGI is under $100k (phasing out to $0 by $150k); unused losses carry forward. On sale, claimed depreciation is recaptured at up to 25%, and gains may owe capital-gains tax (a 1031 exchange can defer both). Figures are a year-1 estimate at your 24.0% rate — not tax advice; consult a CPA.
Schools (NCES district)
- District
- Houston ISD
- NCES district ID
- 4823640
- Math proficiency
- 27% ▼ -18.00%
- Reading proficiency
- 35% ▼ -6.00%
- Median HH income
- $46,054
- Composite
- 26.63/100
- National rank
- #7173
- State rank
- #593 of 826 in TX
Livability — Houston
- Score
- 74/100
- State rank
- #184
- US rank
- #4771
Category grades
Schools grade is shown separately in the Schools card above.
Census & demographics
- Census place
- Houston, TX
- County
- Harris County · 4,702,590 people
- City population
- 3,226,434
- Metro
- Houston-The Woodlands-Sugar Land, TX
- Population (ZIP)
- 29,715
- Household income
- $81,008
- Rent vs Own
- Severe rent burden
- 2502.0
Population outlook (Harris County) Hauer SSP2
- Today (2025)
- 5,571,493 people
- By 2030
- 6,089,821 · +9.3%
- By 2040
- 7,142,806 · +28.2%
- By 2050
- 8,185,864 · +46.9%
- By 2075
- 10,574,329 · +89.8%
- By 2100
- 12,109,958 · +117.4%
Race, ethnicity, and origin ACS 2023
- Neighborhood character
- Highly diverse neighborhood (Simpson 0.74)
- Race & ethnicity
- White 42% Hispanic / Latino 20% Asian 17% Black 15% Two or more races 13% Native American 1%
- Hispanic origin (detail)
- Mexican 11%
- Common ancestry
- Slovak 3% Lithuanian 2% Romanian 2%
- Foreign-born
- 29% · Canada, China, Vietnam
- Languages at home
- 60% English-only · Spanish 16% Other Indo-European 7% Chinese 6%
Political lean MEDSL · Harris
- 2024 margin
- Lean D (+5.5) · D 52.0% · R 46.4% · Other 1.6%
- 2008→2024 swing
- +3.9pp toward D · 2008: 1.6pp · 2024: 5.5pp
- All cycles
- 2024: D+5.5 2020: D+13.3 2016: D+12.4 2012: D+0.1 2008: D+1.6
Not yet ingested
- Civics
- —
Market trends
- HPI YoY
- ▼ -363.31%
- Current HPI
- 187.5872
- Rent YoY
- ▼ -3.93%
- Metro
- Houston-The Woodlands-Sugar Land, TX
- State GDP YoY
- ▲ 3.95%
- F500 in state
- 110
Industry mix (Fortune 500 HQ in TX)
| Industry | F500 HQs | Revenue |
|---|---|---|
| Energy | 16 | $1,198B |
|
||
| Technology | 5 | $198B |
|
||
| Engineering / Construction | 4 | $72B |
|
||
| Energy Services | 3 | $60B |
|
||
| Utilities | 3 | $41B |
|
||
| Healthcare | 2 | $330B |
|
||
Price history
+19.2% since first listed5 events — show timeline
- 2026-05-05 Pending — HARMLS
- 2026-04-23 Listed $62,000 HARMLS
- 2011-09-07 Sold (MLS) — HARMLS
- 2011-08-26 Listing Removed — HARMLS
- 2011-08-17 Listed $52,000 HARMLS
Cash-flow waterfall
monthlySold comps — $/sqft
last 12 mo · ≤1 miLoading sold comps…