10 Acres Aardvark Rd · Fort Garland, CO
Flood risk 1/10 · Minimal
- FEMA flood zone
- X
- Chance of flooding over 30 yrs
- 0.0%
- Est. flood insurance / yr
- $507 – $1,088
Fire risk 2/10 · Minimal
- Est. fire insurance / yr
- $939 – $1,743
Heat risk 1/10 · Minimal
- Hot days now (above 83°F)
- 9 days/yr
- Hot days in 30 yrs
- 25 days/yr
Wind risk 1/10 · Minimal
- Chance of severe wind over 30 yrs
- —
Air-quality risk 1/10 · Minimal
- Unhealthy air days now
- 0 days/yr
- Unhealthy air days in 30 yrs
- 0 days/yr
Risk factors via First Street. Map © Google.
Why this score? — see what drove the C grade
The composite is a weighted blend of 9 inputs, each scored 0–100. Each bar is that input's sub-score; the figure is the points it added to the 100-point composite (weight × sub-score).
- Cash flow +24.4/30.0
- DSCR +7.9/10.0
- ARV discount +7.5/15.0
- 1% rule +6.3/10.0
- Appreciation +4.4/10.0
- Livability +2.7/5.0
- Rent growth +2.5/5.0
- Schools +2.2/10.0
- Condition / age +1.0/5.0
$69,500
🖨 Deal sheet 📄 Offer letter ✓ Due diligence
Listing remarks
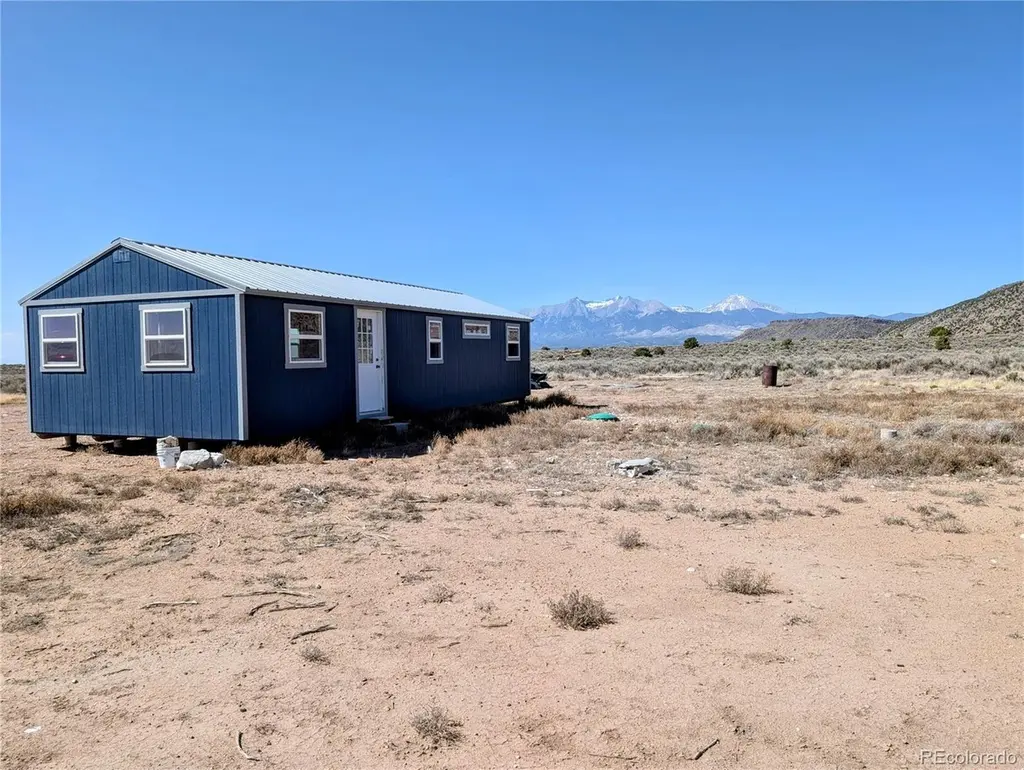
Set in the wide-open beauty of the Sangre de Cristo Ranches of Fort Garland, this 10+ acre property offers a thoughtfully improved basecamp for your Colorado getaway or full-time residence! The property features a new 640 sq ft home with a durable metal roof and a blank canvas to finish the interior to your exact taste and needs! Inside, the space is prepped for efficient use with framing in place for pocket doors and a sliding barn door—ideal for maximizing space while adding character. Recent upgrades include a septic system installed in 2024 and a solid structural foundation with concrete pillars set 3 feet below ground, reinforced with rebar and straps for added durability. The ma
Key facts
- Durable metal roof
- 10 acre property
- Septic system
Tags
Property features AI
Finance
- Other: Approximately 10.39 acres
Exterior
- Parking: Four off-street parking spaces (unpaved)
- Utilities: Septic tank
- Home design: Single-family manufactured home; One story; Faces west; Individually owned
- Construction: Frame construction; Built as a manufactured house
- Exterior features: Metal roof; Dirt road access; Zoned residential
Interior
- Bedrooms: One bedroom on the main level
- Heating & cooling: Wood heat
- Interior features: Living room on the main level; Kitchen on the main level
Neighborhood map
What this means for you Summary
Snapshot
- This is a 1-bed/?-bath single-family listed at $70k. Condition is rated poor.
Deal economics
- At list price, monthly cash flow is $141 ($2k/yr) — positive.
- The deal already cash-flows at list — no discount required.
- Meets the 1% rule at list price ($787 rent vs $70k).
- Recommended offer: $67k (3.0% below list) — sets the bar for market timing.
- Cap rate 8.7% vs local median 1.7% in Fort Garland — top-decile yield for the area; either an underpriced asset or a hidden risk that comps aren't pricing in. Stress-test before assuming the spread holds.
Location & tenants
- Location reads 54/100 on livability (#364 in CO) — a working-class tenant base; expect higher turnover. Strengths: cost of living A, housing A; Watch: health & safety C-, schools F, crime F.
- Sierra Grande School District No. R-30 (rural): math 20% / reading 25% proficiency, ranked #148 of 176 in CO (top 84%) — low school quality limits family demand, transient renter base, plan for 1-2y turnover; 67% free/reduced lunch — lower-income household profile, screen leases tightly.
- Market conditions: 591 active listings in the ZIP.
Forward outlook
- Local home prices are declining (-1.2%/yr); year-one equity from $481 of loan paydown is wiped out by about $814 of value loss. Plan a longer hold.
- Costilla County population projected to shrink 9% by 2050 — rents likely to lag national; underwrite the cash flow, not the appreciation.
- At projected returns (-1.2% appreciation + 3.0% rent growth), your $19k cash investment doubles in ~9 years — after that, you're playing with house money.
Negotiation context
- It's been on market 52 days — a 3% lower offer ($67k) is reasonable based on typical stale-listing flexibility.
Questions for the listing agent
- It's been on market 52 days. Have you received any prior offers? Is the seller open to a 3% concession, seller financing, or rate buy-down credit?
- Have any recent inspections been done? Can we get a copy of the seller's disclosures and any deferred-maintenance estimates?
- Is there a deadline driving the sale (1031 exchange, divorce, estate, relocation)? That informs how much negotiation room exists.
- Schools are F-rated, which usually means shorter tenancies and higher turnover. Who's the typical renter profile here, and what's been the actual vacancy rate?
- Crime grade is F in this area — have there been break-ins, vandalism, or insurance claims at this property in the last 3 years? What carrier currently insures it and at what premium?
- What's the average days-on-market for RENTAL listings here right now (not sales)? A rising rental-DOM trend means longer vacancies and softer asking-rent achievability than the comps imply.
- What's the recent tenant-quality profile in this submarket — average credit score on applications, eviction rate, late-payment / NSF rate, and stable-employment percentage? A property-management company in the area should have these aggregated.
- How much new for-sale + rental construction is in the pipeline within 1–3 miles? Heavy new supply typically softens prices + rents 12–24 months out; constrained supply supports both.
Investment metrics
- 1% rule
- 1.13% ✓
- Cap rate
- 8.73%
- Cash-on-cash
- 8.71%
- DSCR
- 1.39
- GRM
- 7.4
CMA / ARV
No comps found within radius.
Projected returns pro-forma
-1.17% appreciation · 3.0% rent growth · sell at horizon
- IRR
- 3.8%
- Equity multiple
- 1.17×
- Total profit
- $3,239
- Equity at exit
- $16,207
- IRR
- 10.5%
- Equity multiple
- 2.01×
- Total profit
- $19,566
- Equity at exit
- $16,537
Cash invested: $19,460 (down + closing). Projections, not guarantees.
Landlord ↔ Tenant lean methodology
- Overall (STATE)
- 38 Tenant-Leaning
- State Colorado
- 38 Tenant-Leaning · D+4
- County
- — inherits STATE
- City
- — inherits STATE
ZIP-level market 81133
- Home prices YoY
- -0.7%
- Active inventory
- 591
- Price-to-rent
- 7.4×
Monthly cashflow live
- Estimated rent
- $787 medium interval (Pro) →
- Mortgage (P&I)
- −$364
- Tax est. 1.5%
- −$87 /mo · $1,042/yr
- Insurance
- −$29
- HOA
- −$0
- Vacancy / Maint / Mgmt
- −$165
- Net cashflow
- $141
Break-even live
UW: 25.0% down · 7.5% · 30yr · 1.5% tax · 5.0% vac · 8.0% maint · 8.0% mgmt
Financing live
Cash to close
- Down payment
- $17,375
- Closing costs
- $2,085
- Reserves months
- —
- Total cash needed
- —
Loan-product check · same deal, 3 products live
Conventional
25% down · 7.5% · 30yr
- Down + closing
- —
- Monthly P&I
- —
- Monthly cashflow
- —
- DSCR
- —
- Eligible?
- —
Personal DTI + credit; lowest rate.
DSCR
20% down · 8.5% · 30yr
- Down + closing
- —
- Monthly P&I
- —
- Monthly cashflow
- —
- DSCR
- —
- Eligible?
- —
No personal income docs; deal must DSCR.
Hard money
10% down · 12.0% · 12mo
- Down + closing
- —
- Monthly P&I
- —
- Monthly cashflow
- —
- DSCR
- —
- Eligible?
- —
Short-term bridge; refi at stabilization.
Listing history 18 events
-
2026-06-18days on market $69,500 Active 52 DOM
-
2026-06-17days on market $69,500 Active 51 DOM
-
2026-06-16days on market $69,500 Active 50 DOM
-
2026-06-15days on market $69,500 Active 49 DOM
-
2026-06-14days on market $69,500 Active 47 DOM
-
2026-06-13days on market $69,500 Active 46 DOM
-
2026-06-10days on market $69,500 Active 44 DOM
-
2026-06-09days on market $69,500 Active 43 DOM
-
2026-06-08days on market $69,500 Active 42 DOM
-
2026-06-07days on market $69,500 Active 41 DOM
-
2026-06-05days on market $69,500 Active 38 DOM
-
2026-06-03days on market $69,500 Active 37 DOM
-
2026-06-02days on market $69,500 Active 36 DOM
-
2026-06-01days on market $69,500 Active 35 DOM
-
2026-05-31days on market $69,500 Active 34 DOM
-
2026-05-31days on market $69,500 Active 33 DOM
-
2026-05-21price $69,500
-
2026-04-27$75,000 Active
ⓘ Source: listings_history table (triggers on properties + properties_extension) + one-shot
backfill from property_details.listing_events for pre-trigger history.
Climate risk First Street
- Flood 1/10 Low FEMA zone X · 0% chance over 30 yrs
- Wildfire 2/10 Low
- Heat 1/10 Low 9 d/yr ≥83°F today · 25 d/yr by 30 yrs out
- Wind 1/10 Low
- Air quality 1/10 Low 0 unhealthy d/yr today · 0 by 30 yrs out
Nearby sold comps map
Loading sold comps map…
Walkable amenities ~0.75 mi
Loading nearby amenities…
Taxation est. · year 1
- Rental income
- $9,441
- − Mortgage interest
- −$3,893
- − Property taxes
- −$1,042
- − Insurance
- −$348
- − Repairs & maintenance
- −$755
- − Management
- −$755
- − Depreciation
- −$2,022
- Taxable income
- $626
- Est. tax owed @ 24.0%
- −$150
- After-tax cash flow
- $1,545/yr
For passive investors: Depreciation is non-cash, so a rental often shows a tax loss while cash-flowing — sheltering income. Rental losses are passive: they offset passive income freely, and up to $25,000/yr can offset ordinary (W-2) income if you actively participate and your MAGI is under $100k (phasing out to $0 by $150k); unused losses carry forward. On sale, claimed depreciation is recaptured at up to 25%, and gains may owe capital-gains tax (a 1031 exchange can defer both). Figures are a year-1 estimate at your 24.0% rate — not tax advice; consult a CPA.
Condition & rehab AI · 6 photos
This property requires extensive renovations, including kitchen and bathroom fixtures, cabinets, countertops, and flooring. The property is currently a blank canvas with no appliances or fixtures, making it a significant investment opportunity.
Repairs flagged
- Major kitchen appliances — No kitchen appliances visible
- Major bathroom fixtures — No bathroom fixtures visible
- Major kitchen cabinets — No kitchen cabinets visible
- Major bathroom cabinets — No bathroom cabinets visible
- Major kitchen countertops — No kitchen countertops visible
- Major bathroom countertops — No bathroom countertops visible
- Major kitchen flooring — No kitchen flooring visible
- Major bathroom flooring — No bathroom flooring visible
Value-add opportunities
- Resale Kitchen appliances — Appliances enhance functionality and attract buyers
- Resale Bathroom fixtures — Fixtures improve functionality and attract buyers
- Resale Kitchen cabinets — Cabinets provide storage and enhance functionality
- Resale Bathroom cabinets — Cabinets provide storage and enhance functionality
- Resale Kitchen countertops — Countertops provide workspace and enhance functionality
- Resale Bathroom countertops — Countertops provide workspace and enhance functionality
- Resale Kitchen flooring — Flooring enhances aesthetics and functionality
- Resale Bathroom flooring — Flooring enhances aesthetics and functionality
Renovation cost estimate screening
| Repair item | Severity | Est. cost |
|---|---|---|
| kitchen appliances · No kitchen appliances visible | Major | $15,000–50,000 |
| bathroom fixtures · No bathroom fixtures visible | Major | $15,000–50,000 |
| kitchen cabinets · No kitchen cabinets visible | Major | $15,000–50,000 |
| bathroom cabinets · No bathroom cabinets visible | Major | $15,000–50,000 |
| kitchen countertops · No kitchen countertops visible | Major | $15,000–50,000 |
| bathroom countertops · No bathroom countertops visible | Major | $15,000–50,000 |
| kitchen flooring · No kitchen flooring visible | Major | $15,000–50,000 |
| bathroom flooring · No bathroom flooring visible | Major | $15,000–50,000 |
| Total estimated repair cost · 8 items | $120,000–400,000 |
Value-add ROI direction
- Resale Kitchen appliances — Appliances enhance functionality and attract buyers ↑
- Resale Bathroom fixtures — Fixtures improve functionality and attract buyers ↑
- Resale Kitchen cabinets — Cabinets provide storage and enhance functionality ↑
- Resale Bathroom cabinets — Cabinets provide storage and enhance functionality ↑
- Resale Kitchen countertops — Countertops provide workspace and enhance functionality ↑
- Resale Bathroom countertops — Countertops provide workspace and enhance functionality ↑
- Resale Kitchen flooring — Flooring enhances aesthetics and functionality ↑
- Resale Bathroom flooring — Flooring enhances aesthetics and functionality ↑
ⓘ Cost ranges are severity-bucket heuristics (US national rule-of-thumb). Get contractor quotes + a written scope before underwriting a rehab budget.
Schools (NCES district)
- District
- Sierra Grande School District No. R-30
- NCES district ID
- 0804140
- Math proficiency
- 20% ▲ 10.00%
- Reading proficiency
- 25% ▲ 10.00%
- Median HH income
- $34,865
- Composite
- 21.67/100
- National rank
- #13595
- State rank
- #148 of 176 in CO
Livability — Fort Garland
- Score
- 54/100
- State rank
- #364
- US rank
- #24220
Category grades
Schools grade is shown separately in the Schools card above.
Census & demographics
- Population (ZIP)
- 1,056
Population outlook (Costilla County) Hauer SSP2
- Today (2025)
- 3,560 people
- By 2030
- 3,524 · -1.0%
- By 2040
- 3,393 · -4.7%
- By 2050
- 3,226 · -9.4%
- By 2075
- 3,027 · -15.0%
- By 2100
- 2,637 · -25.9%
Race, ethnicity, and origin ACS 2023
- Neighborhood character
- Diverse neighborhood (Simpson 0.56)
- Race & ethnicity
- White 54% Hispanic / Latino 38% Two or more races 26% Black 4%
- Hispanic origin (detail)
- Mexican 29%
- Common ancestry
- Russian 8% Serbian 7% Italian 6%
- Foreign-born
- 5% · Canada
- Languages at home
- 85% English-only · Spanish 14% German/W. Germanic 1%
Political lean MEDSL · Costilla
- 2024 margin
- D (+14.7) · D 55.5% · R 40.9% · Other 3.6%
- 2008→2024 swing
- -34.2pp toward R · 2008: 48.9pp · 2024: 14.7pp
- All cycles
- 2024: D+14.7 2020: D+27.2 2016: D+29.0 2012: D+48.6 2008: D+48.9
Not yet ingested
- Civics
- —
Market trends
- HPI YoY
- ▼ -1.17%
- Current HPI
- 162.9232
- Rent YoY
- —
- Metro
- —
- State GDP YoY
- ▲ 1.95%
- F500 in state
- 14
Industry mix (Fortune 500 HQ in CO)
| Industry | F500 HQs | Revenue |
|---|---|---|
| Technology Distribution | 1 | $31B |
|
||
| Food / Agriculture | 1 | $18B |
|
||
| Packaging | 1 | $14B |
|
||
| Healthcare | 1 | $13B |
|
||
| Energy | 1 | $10B |
|
||
| Technology | 1 | $4B |
|
||
Price history
-7.3% since first listed2 events — show timeline
- 2026-05-21 Price Changed $69,500 REColorado as Distributed by MLS Grid
- 2026-04-27 Listed $75,000 REColorado as Distributed by MLS Grid
Cash-flow waterfall
monthlySold comps — $/sqft
last 12 mo · ≤1 miLoading sold comps…