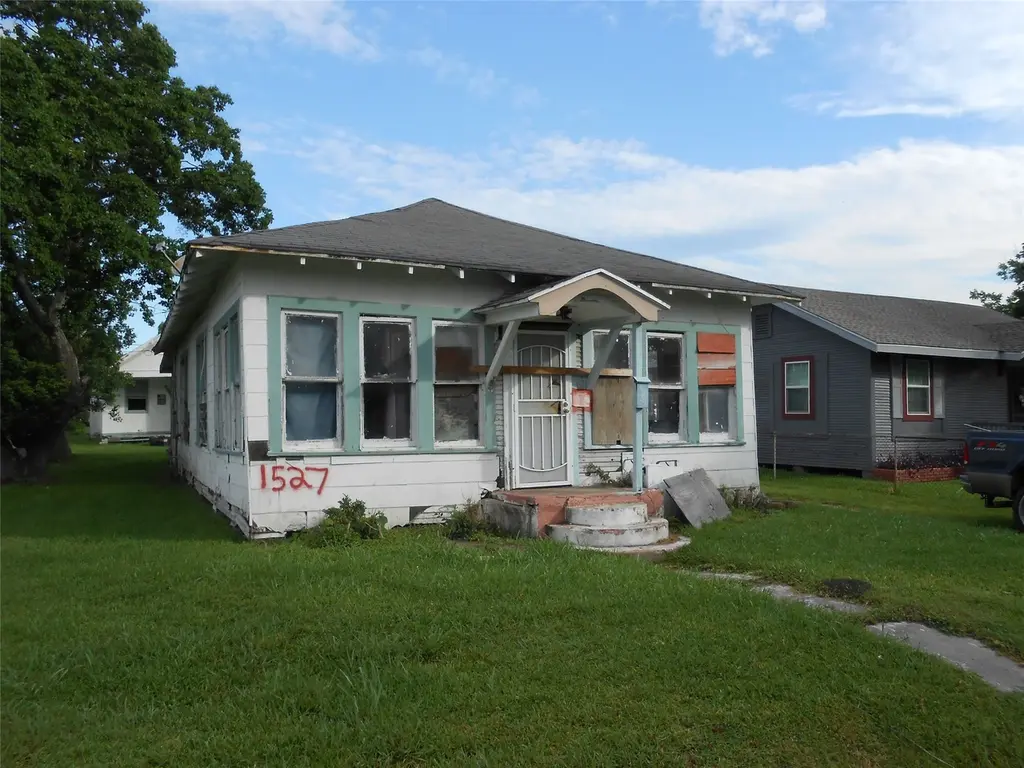
1527 14th St · Port Arthur, TX
Flood risk 9/10 · Severe
- FEMA flood zone
- X (shaded)
- Chance of flooding over 30 yrs
- 0.99%
- Est. flood insurance / yr
- $507 – $1,088
Fire risk 1/10 · Minimal
- Est. fire insurance / yr
- $1,222 – $2,270
Heat risk 9/10 · Severe
- Hot days now (above 109°F)
- 7 days/yr
- Hot days in 30 yrs
- 24 days/yr
Wind risk 9/10 · Severe
- Chance of severe wind over 30 yrs
- 99.0%
Air-quality risk 2/10 · Minimal
- Unhealthy air days now
- 1 days/yr
- Unhealthy air days in 30 yrs
- 1 days/yr
Risk factors via First Street. Map © Google.
Why this score? — see what drove the B- grade
The composite is a weighted blend of 9 inputs, each scored 0–100. Each bar is that input's sub-score; the figure is the points it added to the 100-point composite (weight × sub-score).
- Cash flow +30.0/30.0
- 1% rule +10.0/10.0
- DSCR +10.0/10.0
- ARV discount +7.5/15.0
- Livability +3.1/5.0
- Rent growth +2.5/5.0
- Condition / age +2.5/5.0
- Schools +1.5/10.0
- Appreciation +0.0/10.0
$44,900
🖨 Deal sheet 📄 Offer letter ✓ Due diligence
Listing remarks
Great investment opportunity! This rare 2-for-1 property features two homes on one lot, offering endless potential for the right investor or visionary buyer. Both homes require a full rehab, making this the perfect blank canvas to design and create something truly special. Whether you're looking to renovate and rent, flip for profit, or build your dream multi-generational setup, the possibilities are wide open. With solid potential and priced to sell, this property is a steal of a value for anyone ready to bring their creativity and craftsmanship to life. Don’t miss the chance to transform this diamond in the rough into a true masterpiece!
Key facts
- 2-for-1 property
- Two homes on one lot
- 7,000 sq ft lot
Tags
Property features AI
Finance
- Financial info: Lease not considered
Exterior
- Utilities: Public water; Public sewer
- Home design: Residential property; Built in 1962; Single-story entry (first-floor living)
- Construction: Wood siding exterior; Pillar/post/pier foundation; Composition roof
- Exterior features: Located in a subdivision
Interior
- Bedrooms: Three bedrooms (two 10x10; primary 10x12) — all on the first floor
- Bathrooms: 1 full bathroom
- Interior features: 3 total rooms
Neighborhood map
What this means for you Summary
Snapshot
- This is a 3-bed/1.0-bath single-family listed at $45k.
Deal economics
- At list price, monthly cash flow is $628 ($8k/yr) — positive.
- The deal already cash-flows at list — no discount required.
- Meets the 1% rule at list price ($1k rent vs $45k).
- Recommended offer: $44k (1.5% below list) — sets the bar for market timing.
- Cap rate 24.8% vs local median 5.0% in Port Arthur — top-decile yield for the area; either an underpriced asset or a hidden risk that comps aren't pricing in. Stress-test before assuming the spread holds.
Location & tenants
- Location reads 61/100 on livability (#1,014 in TX) — a middle-class / working-renter tenant base. Strengths: cost of living A+, housing A+; Watch: crime F, amenities F, commute F.
- Port Arthur ISD (urban): math 15% / reading 22% proficiency, ranked #796 of 826 in TX (top 96%) — low school quality limits family demand, transient renter base, plan for 1-2y turnover; 80% free/reduced lunch — lower-income household profile, screen leases tightly.
- Zoned schools: Lincoln Middle (math 14% / reading 21%, grade F, #1,507 of 1,662 statewide, top 91%, 722 students, 87% FRL); Memorial H S (math 15% / reading 27%, grade F, #1,385 of 1,632 statewide, top 85%, 2,116 students, 77% FRL) — zoned schools at 82% FRL track the district average.
- Market conditions: 148 active listings in the ZIP; 5 comparable units currently listed for rent nearby; rentals at typical pace (median 24d on market — plan ~3-4 weeks tenant-placement turnaround); 40% of comp listings sitting > 30 days — soft ceiling on asking rent; 343 units permitted in Jefferson County in 2024 (0 in 5+ unit buildings).
Forward outlook
- Local home prices are declining (-3.0%/yr); year-one equity from $310 of loan paydown is wiped out by about $1k of value loss. Plan a longer hold.
- At projected returns (-3.0% appreciation + 3.0% rent growth), your $13k cash investment doubles in ~2 years — after that, you're playing with house money.
Negotiation context
- It's been on market 16 days — a 2% lower offer ($44k) is reasonable based on typical stale-listing flexibility.
Risks & watch-outs
- Watch-outs: flood insurance adds $66/mo.
- Climate carrying-cost: severe flood risk; severe wind risk, 99% chance of damaging wind over 30y; extreme-heat days projected 7→24/yr by 2055 (HVAC capex compounding) — expect insurance premiums to compound above CPI over the hold.
Questions for the listing agent
- Built in 1962 — when were the roof, HVAC, electrical panel, plumbing, and water heater last replaced?
- What's the actual annual flood-insurance premium (NFIP or private), and is the property in a SFHA with mandatory coverage?
- Is there a deadline driving the sale (1031 exchange, divorce, estate, relocation)? That informs how much negotiation room exists.
- Schools are D-rated, which usually means shorter tenancies and higher turnover. Who's the typical renter profile here, and what's been the actual vacancy rate?
- Crime grade is F in this area — have there been break-ins, vandalism, or insurance claims at this property in the last 3 years? What carrier currently insures it and at what premium?
- What's the average days-on-market for RENTAL listings here right now (not sales)? A rising rental-DOM trend means longer vacancies and softer asking-rent achievability than the comps imply.
- What's the recent tenant-quality profile in this submarket — average credit score on applications, eviction rate, late-payment / NSF rate, and stable-employment percentage? A property-management company in the area should have these aggregated.
- How much new for-sale + rental construction is in the pipeline within 1–3 miles? Heavy new supply typically softens prices + rents 12–24 months out; constrained supply supports both.
Investment metrics
- 1% rule
- 2.83% ✓
- Cap rate
- 24.85%
- Cash-on-cash
- 66.27%
- DSCR
- 3.95
- GRM
- 2.9
CMA / ARV
- ARV (on-the-fly)
- $108,120
- Comps found
- 4
Show comp detail 4 sales within ~0.75 mi
| Address | Dist | Beds/Ba | Sqft | Sold | Price | $/sf | Match |
|---|---|---|---|---|---|---|---|
| 1312 13th St | 0.20mi | 3/2.0 | 1,176 (-8%) | 5mo | $99,900 | $85 | 70 |
| 1110 15th St | 0.31mi | 4/2.0 (+1) | 1,436 (+13%) | 3mo | $135,000 | $94 | 52 |
| 1320 9th St | 0.48mi | 3/2.0 | 1,425 (+12%) | 8mo | $90,000 | $63 | 47 |
| 2217 Rev Dr Ransom Howard St | 0.74mi | 2/1.0 (-1) | 1,144 (-10%) | 18mo | $30,000 | $26 | 29 |
Match score weights: distance 35% · size 25% · config 20% · recency 20%. Top-matched comps best support the ARV.
Projected returns pro-forma
-3.0% appreciation · 3.0% rent growth · sell at horizon
- IRR
- 58.7%
- Equity multiple
- 3.61×
- Total profit
- $32,773
- Equity at exit
- $6,695
- IRR
- 63.5%
- Equity multiple
- 7.39×
- Total profit
- $80,274
- Equity at exit
- $3,882
Cash invested: $12,572 (down + closing). Projections, not guarantees.
Landlord ↔ Tenant lean methodology
- Overall (STATE)
- 87 Strongly Landlord-Friendly
- State Texas
- 87 Strongly Landlord-Friendly · R+5
- County
- — inherits STATE
- City
- — inherits STATE
ZIP-level market 77640
- Home prices YoY
- -22.2%
- Active inventory
- 148
- Price-to-rent
- 2.9×
Monthly cashflow live
- Estimated rent
- $1,272 high interval (Pro) →
- Mortgage (P&I)
- −$235
- Tax est. 1.5%
- −$56 /mo · $674/yr
- Insurance
- −$19
- Flood insurance flood zone
- −$66 /mo · $798/yr
- HOA
- −$0
- Vacancy / Maint / Mgmt
- −$267
- Net cashflow
- $628
Break-even live
UW: 25.0% down · 7.5% · 30yr · 1.5% tax · 5.0% vac · 8.0% maint · 8.0% mgmt
Financing live
Cash to close
- Down payment
- $11,225
- Closing costs
- $1,347
- Reserves months
- —
- Total cash needed
- —
Loan-product check · same deal, 3 products live
Conventional
25% down · 7.5% · 30yr
- Down + closing
- —
- Monthly P&I
- —
- Monthly cashflow
- —
- DSCR
- —
- Eligible?
- —
Personal DTI + credit; lowest rate.
DSCR
20% down · 8.5% · 30yr
- Down + closing
- —
- Monthly P&I
- —
- Monthly cashflow
- —
- DSCR
- —
- Eligible?
- —
No personal income docs; deal must DSCR.
Hard money
10% down · 12.0% · 12mo
- Down + closing
- —
- Monthly P&I
- —
- Monthly cashflow
- —
- DSCR
- —
- Eligible?
- —
Short-term bridge; refi at stabilization.
Rent comps 5 comps
| Address | Beds | Baths | Sqft | Rent | $/sqft | DOM | Units | Dist |
|---|---|---|---|---|---|---|---|---|
| 1300 18th St Port Arthur, TX | 3.0 | 1.0 | 1400 | $1,495 | $1.07 | 43d | 1 | 0.31mi |
| 1409 10th St Port Arthur, TX | 2.0 | 1.0 | 1000 | $925 | $0.93 | 43d | 1 | 0.35mi |
| 1409 10th St Unit A Port Arthur, TX | 3.0 | 1.0 | 1278 | $1,275 | $1.00 | 21d | 1 | 0.35mi |
| 311 12th St Port Arthur, TX | 2.0 | 1.0 | 894 | $1,200 | $1.34 | 13d | 1 | 0.88mi |
| 2510 Avenue A Port Arthur, TX | 2.0 | 2.0 | 1270 | $1,500 | $1.18 | 23d | 1 | 1.35mi |
Listing history 11 events
-
2026-06-13statusdays on market $44,900 Pending 16 DOM
-
2026-06-10days on market $44,900 Active 14 DOM
-
2026-06-09days on market $44,900 Active 13 DOM
-
2026-06-08days on market $44,900 Active 12 DOM
-
2026-06-07days on market $44,900 Active 11 DOM
-
2026-06-03days on market $44,900 Active 7 DOM
-
2026-06-02days on market $44,900 Active 6 DOM
-
2026-06-01days on market $44,900 Active 5 DOM
-
2026-05-31days on market $44,900 Active 4 DOM
-
2026-05-30days on market $44,900 Active 3 DOM
-
2026-05-27$44,900 Active
ⓘ Source: listings_history table (triggers on properties + properties_extension) + one-shot
backfill from property_details.listing_events for pre-trigger history.
Climate risk First Street
- Flood 9/10 Extreme FEMA zone X (shaded) · 99% chance over 30 yrs
- Wildfire 1/10 Low
- Heat 9/10 Extreme 7 d/yr ≥109°F today · 24 d/yr by 30 yrs out
- Wind 9/10 Extreme 99% chance of damaging wind over 30 yrs
- Air quality 2/10 Low 1 unhealthy d/yr today · 1 by 30 yrs out
Nearby sold comps map
Loading sold comps map…
Walkable amenities ~0.75 mi
Loading nearby amenities…
Taxation est. · year 1
- Rental income
- $15,260
- − Mortgage interest
- −$2,515
- − Property taxes
- −$674
- − Insurance
- −$1,022
- − Repairs & maintenance
- −$1,221
- − Management
- −$1,221
- − Depreciation
- −$1,306
- Taxable income
- $7,302
- Est. tax owed @ 24.0%
- −$1,752
- After-tax cash flow
- $5,782/yr
For passive investors: Depreciation is non-cash, so a rental often shows a tax loss while cash-flowing — sheltering income. Rental losses are passive: they offset passive income freely, and up to $25,000/yr can offset ordinary (W-2) income if you actively participate and your MAGI is under $100k (phasing out to $0 by $150k); unused losses carry forward. On sale, claimed depreciation is recaptured at up to 25%, and gains may owe capital-gains tax (a 1031 exchange can defer both). Figures are a year-1 estimate at your 24.0% rate — not tax advice; consult a CPA.
Schools (NCES district)
- District
- Port Arthur ISD
- NCES district ID
- 4835400
- Math proficiency
- 15% ▼ -22.00%
- Reading proficiency
- 22% ▼ -10.00%
- Median HH income
- $31,795
- Composite
- 14.9/100
- National rank
- #9373
- State rank
- #796 of 826 in TX
Livability — Port Arthur
- Score
- 61/100
- State rank
- #1014
- US rank
- #18061
Category grades
Schools grade is shown separately in the Schools card above.
Census & demographics
- Census place
- Port Arthur, TX
- City population
- 38,358
- Population (ZIP)
- 17,480
Population outlook (Jefferson County) Hauer SSP2
- Today (2025)
- 259,015 people
- By 2030
- 260,685 · +0.6%
- By 2040
- 263,309 · +1.7%
- By 2050
- 265,237 · +2.4%
- By 2075
- 270,193 · +4.3%
- By 2100
- 255,628 · -1.3%
Race, ethnicity, and origin ACS 2023
- Neighborhood character
- Diverse neighborhood (Simpson 0.62)
- Race & ethnicity
- Black 54% White 22% Hispanic / Latino 21% Two or more races 8% Asian 2%
- Hispanic origin (detail)
- Mexican 16% Dominican 1%
- Common ancestry
- Lithuanian 3%
- Foreign-born
- 11% · Canada
- Languages at home
- 79% English-only · Spanish 17% Other Indo-European 2% German/W. Germanic 1%
Political lean MEDSL · Jefferson
- 2024 margin
- Lean R (+8.9) · D 45.1% · R 54.0%
- 2008→2024 swing
- -11.1pp toward R · 2008: 2.2pp · 2024: -8.9pp
- All cycles
- 2024: R+8.9 2020: R+1.6 2016: R+0.5 2012: D+1.6 2008: D+2.2
Not yet ingested
- Civics
- —
Market trends
- HPI YoY
- ▼ -47.78%
- Current HPI
- 167.6359
- Rent YoY
- —
- Metro
- —
- State GDP YoY
- ▲ 3.95%
- F500 in state
- 110
Industry mix (Fortune 500 HQ in TX)
| Industry | F500 HQs | Revenue |
|---|---|---|
| Energy | 16 | $1,198B |
|
||
| Technology | 5 | $198B |
|
||
| Engineering / Construction | 4 | $72B |
|
||
| Energy Services | 3 | $60B |
|
||
| Utilities | 3 | $41B |
|
||
| Healthcare | 2 | $330B |
|
||
Price history
1 event — show timeline
- 2026-05-27 Listed $44,900 HARMLS
Property tax history
+10.8%/yrLatest (2025): $3,021 · -3.9% YoY. Source: county tax records.
Cash-flow waterfall
monthlySold comps — $/sqft
last 12 mo · ≤1 miLoading sold comps…