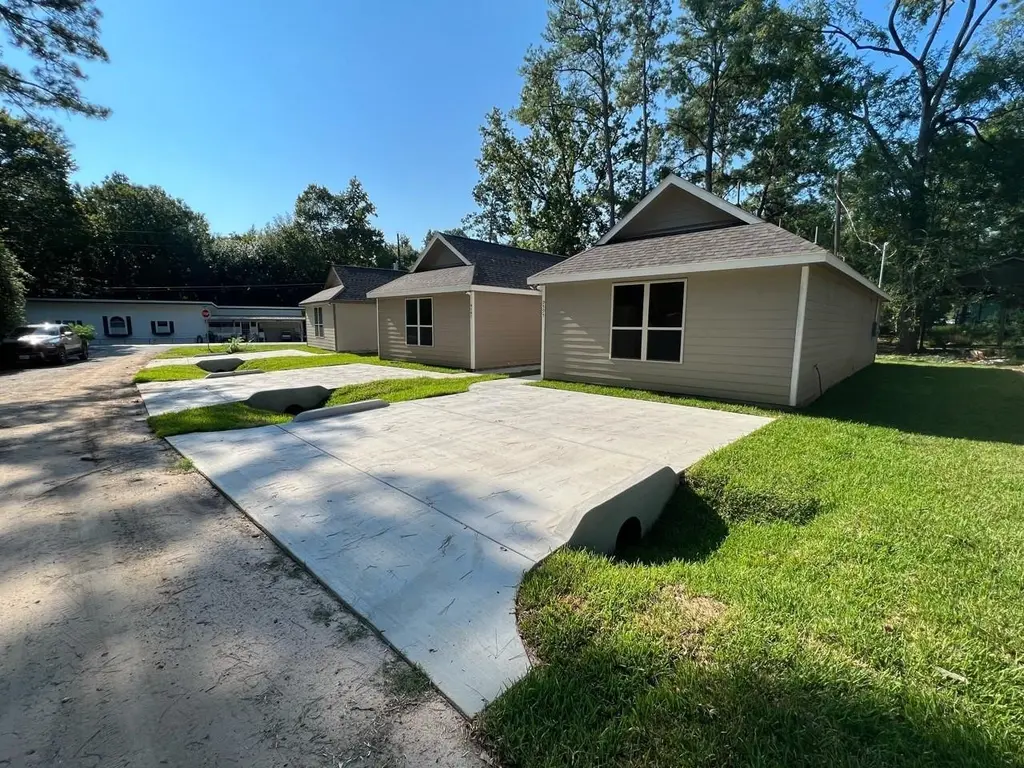
9757 Black Gum St · Willis, TX
Flood risk 7/10 · Major
- FEMA flood zone
- X (unshaded)
- Chance of flooding over 30 yrs
- 0.99%
- Est. flood insurance / yr
- $507 – $1,088
Fire risk 4/10 · Minor
- Est. fire insurance / yr
- $1,222 – $2,270
Heat risk 8/10 · Major
- Hot days now (above 111°F)
- 7 days/yr
- Hot days in 30 yrs
- 24 days/yr
Wind risk 8/10 · Major
- Chance of severe wind over 30 yrs
- 99.0%
Air-quality risk 2/10 · Minimal
- Unhealthy air days now
- 1 days/yr
- Unhealthy air days in 30 yrs
- 1 days/yr
Risk factors via First Street. Map © Google.
Why this score? — see what drove the C grade
The composite is a weighted blend of 9 inputs, each scored 0–100. Each bar is that input's sub-score; the figure is the points it added to the 100-point composite (weight × sub-score).
- Cash flow +22.8/30.0
- ARV discount +10.3/15.0
- DSCR +7.3/10.0
- 1% rule +6.1/10.0
- Condition / age +4.0/5.0
- Schools +3.2/10.0
- Livability +3.1/5.0
- Rent growth +2.0/5.0
- Appreciation +0.0/10.0
$135,000
🖨 Deal sheet 📄 Offer letter ✓ Due diligence
Listing remarks
Postive cash flowing investement property. Tenant occupied. No showings without an executed contract. Perfect opportunity to purchase a turnkey cash flowing property in a phenomenal area that is experiencing growth. Part of a 3 home package beeing sold together. 9757 Black Gum St. Willis TX (MLS 78548677), 9759 Black Gum St. Willis (MLS Number: 79562045), TX, and 9595 Darkwood St. Willis, TX (MLS Number: 48072007)
Key facts
- 2,378 sq ft lot
- Community pool
- Built 2022
Property features AI
Finance
- HOA & community: Part of Walnut Cove POA; Community amenities include basketball court, boat ramp, clubhouse, playground, pickleball, park, and pool; Association fee $57 quarterly
Exterior
- Security: Smoke detector(s)
- Utilities: Public water; Public sewer
- Home design: Residential property; Entry level: first floor
- Construction: Built in 2022; Cement siding; Composition roof; Slab foundation
- Exterior features: Private yard; Subdivision lot
Interior
- Kitchen: Dishwasher; Electric oven and electric range; Microwave; Oven
- Bedrooms: Primary bedroom on the first floor (approx. 14 x 10); Second bedroom on the first floor (approx. 14 x 10)
- Flooring: Plank flooring; Vinyl flooring
- Bathrooms: 2 full bathrooms
- Heating & cooling: Central heating (electric); Central air (electric)
- Interior features: High ceilings; Kitchen and family room combined; Pantry; Tub with shower
- Laundry & utility: Washer hookup; Electric dryer hookup
Neighborhood map
What this means for you Summary
Snapshot
- This is a 2-bed/2.0-bath single-family listed at $135k. Condition is rated good.
Deal economics
- At list price, monthly cash flow is $167 ($2k/yr) — positive.
- The deal already cash-flows at list — no discount required.
- Meets the 1% rule at list price ($2k rent vs $135k).
- Recommended offer: $131k (3.0% below list) — sets the bar for market timing.
- Cap rate 8.4% vs local median 4.7% in Willis — top-decile yield for the area; either an underpriced asset or a hidden risk that comps aren't pricing in. Stress-test before assuming the spread holds.
Location & tenants
- Location reads 62/100 on livability (#933 in TX) — a middle-class / working-renter tenant base. Strengths: cost of living A+, housing A+; Watch: crime C-, employment D+, amenities F.
- Willis ISD (rural): math 33% / reading 40% proficiency, ranked #458 of 826 in TX (top 55%) — families likely to look elsewhere, expect single-tenant / working-renter base with shorter leases.
- Zoned schools: Lynn Lucas Middle (math 23% / reading 32%, grade F, #1,156 of 1,662 statewide, top 71%, 971 students, 74% FRL); Willis H S (math 19% / reading 46%, grade F, #1,029 of 1,632 statewide, top 64%, 2,521 students, 57% FRL).
- Market conditions: Rents soft (-2.1%/yr); 1189 active listings in the ZIP; 6 comparable units currently listed for rent nearby; rentals lingering (median 44d on market — plan ~5-8 weeks vacancy on turnover, expect pricing pressure); 83% of comp listings sitting > 30 days — soft ceiling on asking rent; solid renter incomes; 13,259 units permitted in Montgomery County in 2024 (1,402 in 5+ unit buildings).
Forward outlook
- Local home prices are declining (-3.0%/yr); year-one equity from $933 of loan paydown is wiped out by about $4k of value loss. Plan a longer hold.
- Montgomery County population projected at +65% by 2050 — long-run rental-demand tailwind backs the buy-and-hold thesis.
Negotiation context
- It's been on market 38 days — a 3% lower offer ($131k) is reasonable based on typical stale-listing flexibility.
- 9 sale attempts since 4y ago with the ask held roughly flat each time — persistent listings suggest the price (not the market) is what's stuck; bring a comps-based counter.
Risks & watch-outs
- Watch-outs: flood insurance adds $66/mo.
- Climate carrying-cost: major flood risk; severe wind risk, 99% chance of damaging wind over 30y; extreme-heat days projected 7→24/yr by 2055 (HVAC capex compounding) — expect insurance premiums to compound above CPI over the hold.
Questions for the listing agent
- It's been on market 38 days. Have you received any prior offers? Is the seller open to a 3% concession, seller financing, or rate buy-down credit?
- What's the actual annual flood-insurance premium (NFIP or private), and is the property in a SFHA with mandatory coverage?
- What does the HOA fee cover, when was the last increase, and are there any pending special assessments or reserve-fund shortfalls?
- Is there a deadline driving the sale (1031 exchange, divorce, estate, relocation)? That informs how much negotiation room exists.
- Schools are D-rated, which usually means shorter tenancies and higher turnover. Who's the typical renter profile here, and what's been the actual vacancy rate?
- What's the average days-on-market for RENTAL listings here right now (not sales)? A rising rental-DOM trend means longer vacancies and softer asking-rent achievability than the comps imply.
- What's the recent tenant-quality profile in this submarket — average credit score on applications, eviction rate, late-payment / NSF rate, and stable-employment percentage? A property-management company in the area should have these aggregated.
- How much new for-sale + rental construction is in the pipeline within 1–3 miles? Heavy new supply typically softens prices + rents 12–24 months out; constrained supply supports both.
Investment metrics
- 1% rule
- 1.11% ✓
- Cap rate
- 8.37%
- Cash-on-cash
- 7.41%
- DSCR
- 1.33
- GRM
- 7.5
CMA / ARV
- ARV (on-the-fly)
- $144,000
- Comps found
- 12
Show comp detail 12 sales within ~0.75 mi
| Address | Dist | Beds/Ba | Sqft | Sold | Price | $/sf | Match |
|---|---|---|---|---|---|---|---|
| 9770 Blackgum Dr | 0.05mi | 3/2.0 (+1) | 988 (+10%) | 2mo | $158,000 | $160 | 75 |
| 10088 Calendar St | 0.30mi | 3/2.0 (+1) | 930 (+3%) | 1mo | $159,900 | $172 | 74 |
| 11712 White Cedar St | 0.27mi | 2/1.0 | 855 (-5%) | 2mo | $145,000 | $170 | 73 |
| 9775 Black Gum | 0.05mi | 3/2.0 (+1) | 1,000 (+11%) | 4mo | $154,900 | $155 | 71 |
| 9763 Blackgum St | 0.03mi | 3/2.0 (+1) | 1,000 (+11%) | 6mo | $159,900 | $160 | 70 |
| 9864 Arbor Oak St | 0.13mi | 3/2.0 (+1) | 1,000 (+11%) | 1mo | $159,900 | $160 | 69 |
| 9866 Arbor Oak St | 0.13mi | 3/2.0 (+1) | 1,000 (+11%) | 1mo | $159,900 | $160 | 69 |
| 9868 Arbor Oak St | 0.13mi | 3/2.0 (+1) | 1,000 (+11%) | 1mo | $159,900 | $160 | 69 |
| 9583 Darkwood St | 0.11mi | 3/2.0 (+1) | 1,000 (+11%) | 6mo | $159,900 | $160 | 66 |
| 11847 Nelwood St | 0.22mi | 3/2.0 (+1) | 1,000 (+11%) | 2mo | $159,900 | $160 | 65 |
| 11753 White Cedar St | 0.27mi | 3/2.0 (+1) | 1,000 (+11%) | 1mo | $159,900 | $160 | 63 |
| 11755 White Cedar St | 0.28mi | 3/2.0 (+1) | 1,000 (+11%) | 1mo | $159,900 | $160 | 63 |
Match score weights: distance 35% · size 25% · config 20% · recency 20%. Top-matched comps best support the ARV.
Projected returns pro-forma
-3.0% appreciation · 0.0% rent growth · sell at horizon
- IRR
- -11.7%
- Equity multiple
- 0.59×
- Total profit
- $-15,557
- Equity at exit
- $20,129
- IRR
- -8.2%
- Equity multiple
- 0.56×
- Total profit
- $-16,534
- Equity at exit
- $11,672
Cash invested: $37,800 (down + closing). Projections, not guarantees.
Landlord ↔ Tenant lean methodology
- Overall (STATE)
- 87 Strongly Landlord-Friendly
- State Texas
- 87 Strongly Landlord-Friendly · R+5
- County
- — inherits STATE
- City
- — inherits STATE
ZIP-level market 77318
- Home prices YoY
- -32.7%
- Rents YoY
- -2.1%
- Active inventory
- 1189
- Price-to-rent
- 7.5×
Monthly cashflow live
- Estimated rent
- $1,501 high interval (Pro) →
- Mortgage (P&I)
- −$708
- Tax est. 1.5%
- −$169 /mo · $2,025/yr
- Insurance
- −$56
- Flood insurance flood zone
- −$66 /mo · $798/yr
- HOA
- −$19
- Vacancy / Maint / Mgmt
- −$315
- Net cashflow
- $167
Break-even live
UW: 25.0% down · 7.5% · 30yr · 1.5% tax · 5.0% vac · 8.0% maint · 8.0% mgmt
Financing live
Cash to close
- Down payment
- $33,750
- Closing costs
- $4,050
- Reserves months
- —
- Total cash needed
- —
Loan-product check · same deal, 3 products live
Conventional
25% down · 7.5% · 30yr
- Down + closing
- —
- Monthly P&I
- —
- Monthly cashflow
- —
- DSCR
- —
- Eligible?
- —
Personal DTI + credit; lowest rate.
DSCR
20% down · 8.5% · 30yr
- Down + closing
- —
- Monthly P&I
- —
- Monthly cashflow
- —
- DSCR
- —
- Eligible?
- —
No personal income docs; deal must DSCR.
Hard money
10% down · 12.0% · 12mo
- Down + closing
- —
- Monthly P&I
- —
- Monthly cashflow
- —
- DSCR
- —
- Eligible?
- —
Short-term bridge; refi at stabilization.
Rent comps 6 comps
| Address | Beds | Baths | Sqft | Rent | $/sqft | DOM | Units | Dist |
|---|---|---|---|---|---|---|---|---|
| 9745 Black Gum Willis, TX | 3.0 | 2.0 | 1000 | $1,300 | $1.30 | 43d | 1 | 0.06mi |
| 9743 Black Gum Willis, TX | 3.0 | 2.0 | 1000 | $1,350 | $1.35 | 2d | 1 | 0.06mi |
| 9992 Calendar St Willis, TX | 2.0 | 1.0 | 800 | $1,200 | $1.50 | 43d | 1 | 0.07mi |
| 11555 Persimmon St Willis, TX | 3.0 | 2.0 | 1000 | $1,495 | $1.50 | 43d | 1 | 0.25mi |
| 11559 Persimmon St Willis, TX | 3.0 | 2.0 | 1000 | $1,490 | $1.49 | 43d | 1 | 0.26mi |
| 11561 Persimmon St Willis, TX | 3.0 | 2.0 | 1000 | $1,530 | $1.53 | 43d | 1 | 0.27mi |
HOA detail
- Monthly dues
- $19 · $228/yr
Listing history 32 events
-
2026-06-18days on market $135,000 Active 38 DOM
-
2026-06-17days on market $135,000 Active 37 DOM
-
2026-06-16days on market $135,000 Active 36 DOM
-
2026-06-15days on market $135,000 Active 35 DOM
-
2026-06-13days on market $135,000 Active 33 DOM
-
2026-06-09days on market $135,000 Active 29 DOM
-
2026-06-08days on market $135,000 Active 28 DOM
-
2026-06-07days on market $135,000 Active 27 DOM
-
2026-06-04days on market $135,000 Active 24 DOM
-
2026-06-03days on market $135,000 Active 23 DOM
-
2026-06-02days on market $135,000 Active 22 DOM
-
2026-06-01days on market $135,000 Active 21 DOM
-
2026-05-31days on market $135,000 Active 20 DOM
-
2026-05-22status Active
-
2026-05-22historical
-
2026-05-21status Active
-
2026-04-17status Pending
-
2026-04-13status Pending
-
2026-04-13status Active
-
2026-04-01historical
-
2026-03-26$135,000 Active
-
2023-10-12historical $1,250
-
2023-08-23$1,250
-
2022-09-30historical
-
2022-09-21historical
-
2022-09-21$149,900 Active
-
2022-09-13$149,900 Active
-
2022-09-13historical
-
2022-08-31$154,900 Active
-
2022-08-31historical
-
2022-08-10price $154,900
-
2022-07-07$149,900 Active
ⓘ Source: listings_history table (triggers on properties + properties_extension) + one-shot
backfill from property_details.listing_events for pre-trigger history.
Climate risk First Street
- Flood 7/10 Severe FEMA zone X (unshaded) · 99% chance over 30 yrs
- Wildfire 4/10 Moderate
- Heat 8/10 Severe 7 d/yr ≥111°F today · 24 d/yr by 30 yrs out
- Wind 8/10 Severe 99% chance of damaging wind over 30 yrs
- Air quality 2/10 Low 1 unhealthy d/yr today · 1 by 30 yrs out
Nearby sold comps map
Loading sold comps map…
Walkable amenities ~0.75 mi
Loading nearby amenities…
Taxation est. · year 1
- Rental income
- $18,008
- − Mortgage interest
- −$7,562
- − Property taxes
- −$2,025
- − Insurance
- −$1,472
- − Repairs & maintenance
- −$1,441
- − Management
- −$1,441
- − HOA
- −$228
- − Depreciation
- −$3,927
- Taxable loss
- −$89
- Est. tax savings @ 24.0%
- +$21
- After-tax cash flow
- $2,026/yr
For passive investors: Depreciation is non-cash, so a rental often shows a tax loss while cash-flowing — sheltering income. Rental losses are passive: they offset passive income freely, and up to $25,000/yr can offset ordinary (W-2) income if you actively participate and your MAGI is under $100k (phasing out to $0 by $150k); unused losses carry forward. On sale, claimed depreciation is recaptured at up to 25%, and gains may owe capital-gains tax (a 1031 exchange can defer both). Figures are a year-1 estimate at your 24.0% rate — not tax advice; consult a CPA.
Condition & rehab AI · 7 photos
This single-family home is in good condition with a good condition score of 80. It is a turnkey investment property with no visible repairs or maintenance needed. The highest-ROI updates would be painting the exterior and interior walls, landscaping, and adding smart home features.
Value-add opportunities
- Both Painting exterior and interior walls — Fresh paint enhances curb appeal and interior aesthetics
- Both Landscaping and curb appeal improvements — Enhances property's visual appeal and can attract more tenants
- Both Add smart home features — Improves convenience and can increase property's market value
Renovation cost estimate screening
Value-add ROI direction
- Both Painting exterior and interior walls — Fresh paint enhances curb appeal and interior aesthetics ↑
- Both Landscaping and curb appeal improvements — Enhances property's visual appeal and can attract more tenants ↑
- Both Add smart home features — Improves convenience and can increase property's market value ↑
ⓘ Cost ranges are severity-bucket heuristics (US national rule-of-thumb). Get contractor quotes + a written scope before underwriting a rehab budget.
Schools (NCES district)
- District
- Willis ISD
- NCES district ID
- 4845900
- Math proficiency
- 33% ▼ -15.00%
- Reading proficiency
- 40% ▼ -2.00%
- Median HH income
- $57,828
- Composite
- 32.32/100
- National rank
- #5746
- State rank
- #458 of 826 in TX
Livability — Willis
- Score
- 62/100
- State rank
- #933
- US rank
- #16579
Category grades
Schools grade is shown separately in the Schools card above.
Census & demographics
- County
- Montgomery County · 663,713 people
- City population
- 38,421
- Metro
- Houston-The Woodlands-Sugar Land, TX
- Population (ZIP)
- 20,792
- Household income
- $92,415
- Rent vs Own
- Severe rent burden
- 279.0
Population outlook (Montgomery County) Hauer SSP2
- Today (2025)
- 713,896 people
- By 2030
- 805,263 · +12.8%
- By 2040
- 992,708 · +39.1%
- By 2050
- 1,179,590 · +65.2%
- By 2075
- 1,628,084 · +128.1%
- By 2100
- 1,937,880 · +171.5%
Race, ethnicity, and origin ACS 2023
- Neighborhood character
- Predominantly White (72%)
- Race & ethnicity
- White 72% Hispanic / Latino 17% Two or more races 14% Black 3%
- Hispanic origin (detail)
- Mexican 12%
- Common ancestry
- Lithuanian 4% Slovak 2% Serbian 2%
- Foreign-born
- 6% · Canada, Jamaica
- Languages at home
- 88% English-only · Spanish 10%
Political lean MEDSL · Montgomery
- 2024 margin
- Solid R (+45.5) · D 26.8% · R 72.3%
- 2008→2024 swing
- +7.2pp toward D · 2008: -52.7pp · 2024: -45.5pp
- All cycles
- 2024: R+45.5 2020: R+43.8 2016: R+51.4 2012: R+60.7 2008: R+52.7
Not yet ingested
- Civics
- —
Market trends
- HPI YoY
- ▼ -114.58%
- Current HPI
- 236.256
- Rent YoY
- ▼ -2.09%
- Metro
- Houston-The Woodlands-Sugar Land, TX
- State GDP YoY
- ▲ 3.95%
- F500 in state
- 110
Industry mix (Fortune 500 HQ in TX)
| Industry | F500 HQs | Revenue |
|---|---|---|
| Energy | 16 | $1,198B |
|
||
| Technology | 5 | $198B |
|
||
| Engineering / Construction | 4 | $72B |
|
||
| Energy Services | 3 | $60B |
|
||
| Utilities | 3 | $41B |
|
||
| Healthcare | 2 | $330B |
|
||
Price history
-9.9% since first listed19 events — show timeline
- 2026-05-22 Relisted — HARMLS
- 2026-05-22 Listing Removed — HARMLS
- 2026-05-21 Relisted — HARMLS
- 2026-04-17 Pending — HARMLS
- 2026-04-13 Pending — HARMLS
- 2026-04-13 Relisted — HARMLS
- 2026-04-01 Listing Removed — HARMLS
- 2026-03-26 Listed $135,000 HARMLS
- 2023-10-12 Rental Removed $1,250 HARMLS
- 2023-08-23 Listed for Rent $1,250 HARMLS
- 2022-09-30 Listing Removed — HARMLS
- 2022-09-21 Listed $149,900 HARMLS
- 2022-09-21 Listing Removed — HARMLS
- 2022-09-13 Listing Removed — HARMLS
- 2022-09-13 Listed $149,900 HARMLS
- 2022-08-31 Listing Removed — HARMLS
- 2022-08-31 Listed $154,900 HARMLS
- 2022-08-10 Price Changed $154,900 HARMLS
- 2022-07-07 Listed $149,900 HARMLS
Cash-flow waterfall
monthlySold comps — $/sqft
last 12 mo · ≤1 miLoading sold comps…