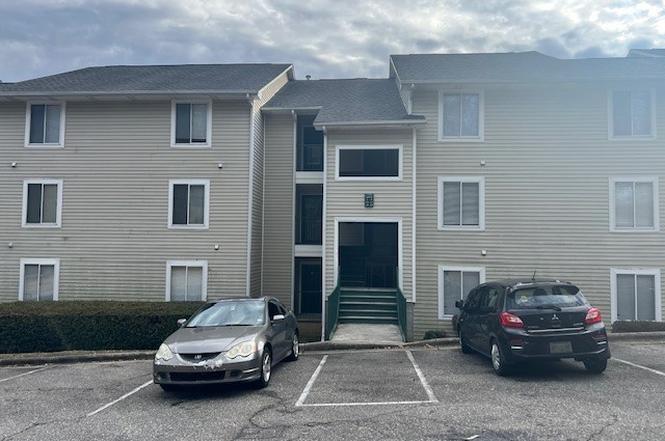
3385 Galleria Pl #20 · Fayetteville, NC
Flood risk 1/10 · Minimal
- FEMA flood zone
- X (unshaded)
- Chance of flooding over 30 yrs
- 0.0%
- Est. flood insurance / yr
- $507 – $1,088
Fire risk 4/10 · Minor
- Est. fire insurance / yr
- $906 – $1,684
Heat risk 7/10 · Major
- Hot days now (above 107°F)
- 7 days/yr
- Hot days in 30 yrs
- 16 days/yr
Wind risk 6/10 · Moderate
- Chance of severe wind over 30 yrs
- 71.0%
Air-quality risk 2/10 · Minimal
- Unhealthy air days now
- 0 days/yr
- Unhealthy air days in 30 yrs
- 1 days/yr
Risk factors via First Street. Map © Google.
Why this score? — see what drove the C grade
The composite is a weighted blend of 9 inputs, each scored 0–100. Each bar is that input's sub-score; the figure is the points it added to the 100-point composite (weight × sub-score).
- Cash flow +23.1/30.0
- ARV discount +7.5/15.0
- DSCR +7.4/10.0
- 1% rule +6.9/10.0
- Livability +3.8/5.0
- Rent growth +3.3/5.0
- Schools +3.1/10.0
- Condition / age +2.5/5.0
- Appreciation +0.0/10.0
$124,990
🖨 Deal sheet (PDF) 📄 Offer letter ✓ Due diligence
Listing remarks
Welcome to this spacious 3-bedroom, 2-bath condominium offering over 1,300 square feet of comfortable living space in the desirable Galleria Place community. Owner upgraded ceiling fans throughout unit to include replacing toilets in bathrooms. This unit features an open floor plan, vaulted ceilings, a wood-burning fireplace, and abundant natural light throughout. The generous living and dining areas flow seamlessly to a private balcony, perfect for relaxing or entertaining. The kitchen offers ample cabinet space and overlooks the main living area, while all bedrooms are well-sized with excellent closet storage. Washer and dryer connections are included for added convenience. Community amen
Key facts
- Open floor plan
- Private balcony
- Swimming pool
Tags
Property features AI
Finance
- Other: Located in the GALLERIA PLACE subdivision; Situated on a paved road in a cul-de-sac (see remarks for details)
- HOA & community: Homeowners association with a $175 monthly fee; Association fee includes grounds maintenance; Community pool; Street lighting
Exterior
- Parking: Other parking
- Security: Smoke detectors
- Utilities: Public water; Public sewer
- Home design: Residential condominium
- Construction: Concrete and vinyl siding construction
- Exterior features: Balcony; Covered patio; Exterior storage; Storm door(s); Smoke detector(s)
Interior
- Kitchen: Oven; Convection oven; Electric cooktop; Electric oven; Electric range; Dishwasher; Disposal; Microwave; Refrigerator; Ice maker; Self-cleaning oven
- Bedrooms: Total of 5 rooms (includes bedrooms and living spaces)
- Flooring: Vinyl flooring
- Bathrooms: 2 full bathrooms
- Heating & cooling: Heat pump heating; Ceiling fan cooling
- Interior features: Ceiling fans; Pantry; Stone countertops; Storage; Walk-in closets; Window coverings and blinds; Gas-log fireplace in the living room
- Laundry & utility: Washer and dryer in-unit on the main level; Gas water heater
Neighborhood map
What this means for you Summary
Snapshot
- This is a 3-bed/3.0-bath condo listed at $125k.
Deal economics
- At list price, monthly cash flow is $224 ($3k/yr) — positive.
- The deal already cash-flows at list — no discount required.
- Meets the 1% rule at list price ($1k rent vs $125k).
- Recommended offer: $110k (12.0% below list) — sets the bar for market timing.
- Cap rate 8.4% vs local median 4.8% in Fayetteville — top-decile yield for the area; either an underpriced asset or a hidden risk that comps aren't pricing in. Stress-test before assuming the spread holds.
Location & tenants
- Location reads 75/100 on livability (#45 in NC, #4,031 nationally) — a middle-class / working-renter tenant base. Strengths: commute A+, cost of living A+, housing A+; Watch: crime F, employment D-.
- Cumberland County Schools (urban): math 32% / reading 41% proficiency, ranked #126 of 178 in NC (top 71%) — families likely to look elsewhere, expect single-tenant / working-renter base with shorter leases.
- Zoned schools: Vanstory Hills Elementary (math 46% / reading 50%, grade D, #477 of 1,410 statewide, top 35%, 469 students, 99% FRL); R Max Abbott Middle (math 31% / reading 45%, grade F, #251 of 475 statewide, top 54%, 759 students, 99% FRL); Terry Sanford High (math 49% / reading 52%, grade D+, #306 of 535 statewide, top 57%, 1,224 students, 59% FRL) — zoned schools average 86% FRL vs 55% district-wide (31 pts higher); higher-poverty schools than district average — tighter screening recommended.
- Market conditions: Rents rising (+3.0%/yr); 285 active listings in the ZIP; 31 comparable units currently listed for rent nearby; rentals at typical pace (median 26d on market — plan ~3-4 weeks tenant-placement turnaround); 1,125 units permitted in Cumberland County in 2024 (104 in 5+ unit buildings).
- This rent runs 31% of the median local income ($58k/yr) — at the standard rent-burdened threshold; future hikes will face affordability resistance.
Forward outlook
- Local home prices are declining (-3.0%/yr); year-one equity from $864 of loan paydown is wiped out by about $4k of value loss. Plan a longer hold.
Negotiation context
- It's been on market 130 days — a 12% lower offer ($110k) is reasonable based on typical stale-listing flexibility.
- Current owner paid $78k; list at $125k implies a 60% gain — meaningful room to come down on a strong offer.
Risks & watch-outs
- Climate carrying-cost: major wind risk, 71% chance of damaging wind over 30y; extreme-heat days projected 7→16/yr by 2055 (HVAC capex compounding) — expect insurance premiums to compound above CPI over the hold.
Questions for the listing agent
- It's been on market 130 days. Have you received any prior offers? Is the seller open to a 12% concession, seller financing, or rate buy-down credit?
- What does the HOA fee cover, when was the last increase, and are there any pending special assessments or reserve-fund shortfalls?
- Any open or pending special assessments — roof, HVAC, plumbing, elevator, façade? What's the per-unit balance and payoff schedule, and is the seller paying it off at close or rolling it to the buyer?
- Why hasn't it sold? Are there any deal-killer items the seller is aware of (foundation, flood, title, zoning, code violations)?
- Is there a deadline driving the sale (1031 exchange, divorce, estate, relocation)? That informs how much negotiation room exists.
- Crime grade is F in this area — have there been break-ins, vandalism, or insurance claims at this property in the last 3 years? What carrier currently insures it and at what premium?
- What's the average days-on-market for RENTAL listings here right now (not sales)? A rising rental-DOM trend means longer vacancies and softer asking-rent achievability than the comps imply.
- What's the recent tenant-quality profile in this submarket — average credit score on applications, eviction rate, late-payment / NSF rate, and stable-employment percentage? A property-management company in the area should have these aggregated.
- How much new apartment / multifamily construction is in the pipeline within 1–3 miles? Heavy new supply (>2% of stock underway) typically softens rents 12–24 months out; light construction supports rent growth.
Investment metrics
- 1% rule
- 1.19% ✓
- Cap rate
- 8.44%
- Cash-on-cash
- 7.67%
- DSCR
- 1.34
- GRM
- 7.0
CMA / ARV
No comps found within radius.
Projected returns pro-forma
-3.0% appreciation · 3.01% rent growth · sell at horizon
- IRR
- -4.5%
- Equity multiple
- 0.83×
- Total profit
- $-5,914
- Equity at exit
- $18,636
- IRR
- 5.2%
- Equity multiple
- 1.39×
- Total profit
- $13,563
- Equity at exit
- $10,807
Cash invested: $34,997 (down + closing). Projections, not guarantees.
Landlord ↔ Tenant lean methodology
- Overall (STATE)
- 85 Strongly Landlord-Friendly
- State North Carolina
- 85 Strongly Landlord-Friendly · R+3
- County
- — inherits STATE
- City
- — inherits STATE
ZIP-level market 28303
- Home prices YoY
- -25.4%
- Rents YoY
- 3.0%
- Active inventory
- 285
- Price-to-rent
- 7.0×
Monthly cashflow live
- Estimated rent
- $1,484 high interval (Pro) →
- Mortgage (P&I)
- −$655
- Tax from tax record
- −$49 /mo · $588/yr
- Insurance
- −$52
- HOA
- −$192
- Vacancy / Maint / Mgmt
- −$312
- Net cashflow
- $224
Break-even live
Sensitivity live
| Price | -10% $294 | -5% $259 | +0% $224 | +5% $188 | +10% $153 |
|---|---|---|---|---|---|
| Rent | -10% $107 | -5% $165 | +0% $224 | +5% $282 | +10% $341 |
| Rate | -1.0pp $287 | -0.5pp $256 | base $224 | +0.5pp $191 | +1.0pp $158 |
UW: 25.0% down · 7.5% · 30yr · 1.5% tax · 5.0% vac · 8.0% maint · 8.0% mgmt
Financing live
Cash to close
- Down payment
- $31,248
- Closing costs
- $3,750
- Reserves months
- —
- Total cash needed
- —
Loan-product check · same deal, 3 products live
Conventional
25% down · 7.5% · 30yr
- Down + closing
- —
- Monthly P&I
- —
- Monthly cashflow
- —
- DSCR
- —
- Eligible?
- —
Personal DTI + credit; lowest rate.
DSCR
20% down · 8.5% · 30yr
- Down + closing
- —
- Monthly P&I
- —
- Monthly cashflow
- —
- DSCR
- —
- Eligible?
- —
No personal income docs; deal must DSCR.
Hard money
10% down · 12.0% · 12mo
- Down + closing
- —
- Monthly P&I
- —
- Monthly cashflow
- —
- DSCR
- —
- Eligible?
- —
Short-term bridge; refi at stabilization.
Rent comps 31 comps
| Address | Beds | Baths | Sqft | Rent | $/sqft | DOM | Units | Dist |
|---|---|---|---|---|---|---|---|---|
| 3374 Galleria Dr Fayetteville, NC | 3.0 | 2.0 | 1350 | $1,200 | $0.89 | 25d | 1 | 0.03mi |
| 710 Villagio Pl Fayetteville, NC | 1.0–2.0 | 1.0–2.0 | 984 | $1,686 | $1.71 | 16d | 9 | 0.27mi |
| 1712 Scampton Dr Unit NA Fayetteville, NC | 3.0 | 2.0 | 1814 | $1,900 | $1.05 | 16d | 1 | 0.29mi |
| 1712 Scampton Dr Fayetteville, NC | 3.0 | 1.5 | 1814 | $2,000 | $1.10 | 25d | 1 | 0.29mi |
| 1849 Tryon Dr Fayetteville, NC | 2.0 | 2.0 | 1061 | $998 | $0.94 | 25d | 2 | 0.31mi |
| 3527 Scottywood Dr Fayetteville, NC | 4.0 | 2.0 | 1454 | $1,775 | $1.22 | 25d | 1 | 0.32mi |
| 4420 Blanton Rd Unit 4420-H Fayetteville, NC | 2.0 | 1.5 | 990 | $1,025 | $1.04 | 16d | 1 | 0.33mi |
| 1861 Tryon Dr Unit 3 Fayetteville, NC | 2.0 | 2.0 | 1050 | $995 | $0.95 | 25d | 1 | 0.36mi |
| 1909 Tryon Dr #7 Fayetteville, NC | 2.0 | 2.0 | 1060 | $1,050 | $0.99 | 25d | 1 | 0.36mi |
| 1808 Tryon Dr Fayetteville, NC | 2.0 | 2.0 | 1066 | $995 | $0.93 | 25d | 1 | 0.40mi |
| 1882 Tryon Dr #4 Fayetteville, NC | 2.0 | 2.0 | 1063 | $1,100 | $1.03 | 16d | 1 | 0.41mi |
| 853 Shannon Dr Fayetteville, NC | 3.0 | 1.5 | 1820 | $1,650 | $0.91 | 25d | 1 | 0.49mi |
| 1937 Sardonyx Rd Fayetteville, NC | 2.0 | 2.0 | 1200 | $1,150 | $0.96 | 25d | 1 | 0.51mi |
| 1615 Morehead Ave Fayetteville, NC | 3.0 | 2.0 | 1073 | $1,400 | $1.30 | 25d | 1 | 0.56mi |
| 1199 Wrenwood Ct Fayetteville, NC | 2.0 | 2.5 | 1224 | $1,345 | $1.10 | 25d | 1 | 0.60mi |
| 1907 Eichelberger Dr Fayetteville, NC | 3.0 | 2.0 | 1463 | $1,650 | $1.13 | 25d | 1 | 0.61mi |
| 1198 Windham Ct Fayetteville, NC | 2.0 | 2.5 | 1200 | $1,100 | $0.92 | 16d | 1 | 0.61mi |
| 1160 Windham Ct Fayetteville, NC | 2.0 | 2.5 | 1200 | $1,250 | $1.04 | 25d | 1 | 0.65mi |
| 1276 N Forest Dr Fayetteville, NC | 2.0 | 2.5 | 1200 | $1,295 | $1.08 | 25d | 1 | 0.66mi |
| 3318 Rogers Dr Fayetteville, NC | 3.0 | 2.0 | 1392 | $1,750 | $1.26 | 16d | 1 | 0.68mi |
| 3618 Sugar Cane Cir Fayetteville, NC | 3.0 | 2.0 | 1596 | $1,900 | $1.19 | 25d | 1 | 0.92mi |
| 1547 Londonderry Pl Fayetteville, NC | 3.0 | 2.5 | 1636 | $1,750 | $1.07 | 25d | 1 | 1.02mi |
| 1526 Trevino Dr Fayetteville, NC | 3.0 | 2.0 | 1629 | $1,800 | $1.10 | 25d | 1 | 1.08mi |
| 301 Barcelona Dr Fayetteville, NC | 1.0–2.0 | 1.0–2.0 | 845 | $1,326 | $1.57 | 16d | 58 | 1.19mi |
| 1014 Enclave Dr Fayetteville, NC | 1.0–3.0 | 1.0–2.0 | 1112 | $1,685 | $1.52 | 16d | 19 | 1.23mi |
| 2056 Wheeling St Fayetteville, NC | 3.0 | 2.5 | 1401 | $1,595 | $1.14 | 25d | 1 | 1.33mi |
| 1817 McGougan Rd Fayetteville, NC | 3.0 | 2.0 | 1811 | $2,100 | $1.16 | 16d | 1 | 1.40mi |
| 2436 Bragg Blvd Fayetteville, NC | 2.0 | 1.0 | 1000 | $1,200 | $1.20 | 25d | 1 | 1.44mi |
| 2436 Bragg Blvd Fayetteville, NC | 2.0 | 1.0 | 1000 | $1,200 | $1.20 | 16d | 1 | 1.44mi |
| 2434 Bragg Blvd Fayetteville, NC | 2.0 | 1.0 | 1000 | $1,200 | $1.20 | 25d | 1 | 1.44mi |
| 1981 Wheeling St Fayetteville, NC | 3.0 | 2.0 | 1400 | $1,500 | $1.07 | 25d | 1 | 1.45mi |
HOA detail condo
- Monthly dues
- $192 · $2,304/yr
- Assessments
- None detected in remarks — confirm with the listing agent.
Listing history 20 events
-
2026-06-21days on market $124,990 Active 130 DOM
-
2026-06-18days on market $124,990 Active 127 DOM
-
2026-06-17days on market $124,990 Active 126 DOM
-
2026-06-16days on market $124,990 Active 125 DOM
-
2026-06-15days on market $124,990 Active 124 DOM
-
2026-06-14pricedays on market $124,990 Active 122 DOM
-
2026-06-13days on market $129,000 Active 121 DOM
-
2026-06-10days on market $129,000 Active 119 DOM
-
2026-06-09days on market $129,000 Active 118 DOM
-
2026-06-08days on market $129,000 Active 117 DOM
-
2026-06-07days on market $129,000 Active 116 DOM
-
2026-06-03days on market $129,000 Active 112 DOM
-
2026-06-02days on market $129,000 Active 111 DOM
-
2026-06-01days on market $129,000 Active 110 DOM
-
2026-05-31days on market $129,000 Active 109 DOM
-
2026-05-30days on market $129,000 Active 108 DOM
-
2026-04-08price $129,000
-
2026-02-11$140,000 Active
-
2005-11-01soldstatus $78,000
-
2002-06-17soldstatus $65,000
ⓘ Source: listings_history table (triggers on properties + properties_extension) + one-shot
backfill from property_details.listing_events for pre-trigger history.
Tax reassessment forecast NC · Resets to sale price
- Current annual tax
- $588 · $49/mo
- Projected year-2 tax
- $1,025 · $85/mo
- Expected delta
- +$437/yr (+$36/mo · 74.5%)
ⓘ Screening estimate from a state-policy table — verify with the county assessor before closing.
Climate risk First Street
- Flood 1/10 Low FEMA zone X (unshaded) · 0% chance over 30 yrs
- Wildfire 4/10 Moderate
- Heat 7/10 Severe 7 d/yr ≥107°F today · 16 d/yr by 30 yrs out
- Wind 6/10 Major 71% chance of damaging wind over 30 yrs
- Air quality 2/10 Low 0 unhealthy d/yr today · 1 by 30 yrs out
Nearby sold comps map
Loading sold comps map…
Walkable amenities ~0.75 mi
Loading nearby amenities…
Taxation est. · year 1
- Rental income
- $17,806
- − Mortgage interest
- −$7,001
- − Property taxes
- −$588
- − Insurance
- −$625
- − Repairs & maintenance
- −$1,424
- − Management
- −$1,424
- − HOA
- −$2,304
- − Depreciation
- −$3,636
- Taxable income
- $803
- Est. tax owed @ 24.0%
- −$193
- After-tax cash flow
- $2,492/yr
For passive investors: Depreciation is non-cash, so a rental often shows a tax loss while cash-flowing — sheltering income. Rental losses are passive: they offset passive income freely, and up to $25,000/yr can offset ordinary (W-2) income if you actively participate and your MAGI is under $100k (phasing out to $0 by $150k); unused losses carry forward. On sale, claimed depreciation is recaptured at up to 25%, and gains may owe capital-gains tax (a 1031 exchange can defer both). Figures are a year-1 estimate at your 24.0% rate — not tax advice; consult a CPA.
Schools (NCES district)
- District
- Cumberland County Schools
- NCES district ID
- 3700011
- Math proficiency
- 32% ▼ -2.00%
- Reading proficiency
- 41% ▼ -1.00%
- Median HH income
- $44,168
- Composite
- 31.0/100
- National rank
- #6096
- State rank
- #126 of 178 in NC
Livability — Fayetteville
- Score
- 75/100
- State rank
- #45
- US rank
- #4031
Category grades
Schools grade is shown separately in the Schools card above.
Census & demographics
- Census place
- Fayetteville, NC
- County
- Cumberland County · 265,314 people
- City population
- 226,118
- Metro
- Fayetteville, NC
- Population (ZIP)
- 30,965
- Household income
- $58,223
- Rent vs Own
- Severe rent burden
- 1370.0
Population outlook (Cumberland County) Hauer SSP2
- Today (2025)
- 330,855 people
- By 2030
- 333,523 · +0.8%
- By 2040
- 335,583 · +1.4%
- By 2050
- 335,325 · +1.4%
- By 2075
- 342,853 · +3.6%
- By 2100
- 340,698 · +3.0%
Race, ethnicity, and origin ACS 2023
- Neighborhood character
- Diverse neighborhood (Simpson 0.70)
- Race & ethnicity
- White 39% Black 37% Two or more races 11% Hispanic / Latino 10% Asian 4% Pacific Islander 1%
- Hispanic origin (detail)
- Mexican 2% Puerto Rican 3%
- Common ancestry
- Slovak 3% Serbian 1% Lithuanian 1%
- Foreign-born
- 9% · Canada, South Korea, Vietnam
- Languages at home
- 86% English-only · Spanish 7% Other Asian/Pacific 2% Korean 1%
Political lean MEDSL · Cumberland
- 2024 margin
- D (+13.4) · D 56.1% · R 42.7% · Other 1.2%
- 2008→2024 swing
- -4.3pp toward R · 2008: 17.7pp · 2024: 13.4pp
- All cycles
- 2024: D+13.4 2020: D+16.6 2016: D+16.0 2012: D+19.7 2008: D+17.7
Not yet ingested
- Civics
- —
Market trends
- HPI YoY
- ▼ -77.14%
- Current HPI
- 226.5097
- Rent YoY
- ▲ 3.01%
- Metro
- Fayetteville, NC
- State GDP YoY
- ▲ 3.28%
- F500 in state
- 26
Industry mix (Fortune 500 HQ in NC)
| Industry | F500 HQs | Revenue |
|---|---|---|
| Financial Services | 2 | $213B |
|
||
| Retail | 2 | $95B |
|
||
| Industrial Conglomerate | 1 | $38B |
|
||
| Metals / Steel | 1 | $35B |
|
||
| Utilities | 1 | $30B |
|
||
| Industrial Machinery | 1 | $19B |
|
||
Price history
+98.5% since first listed4 events — show timeline
- 2026-04-08 Price Changed $129,000 LPRMLS
- 2026-02-11 Listed $140,000 LPRMLS
- 2005-11-01 Sold (Public Records) $78,000 Public Records
- 2002-06-17 Sold (Public Records) $65,000 Public Records
Property tax history
-11.9%/yrLatest (2019): $588 · +0.0% YoY. Source: county tax records.
Cash-flow waterfall
monthlySold comps — $/sqft
last 12 mo · ≤1 miLoading sold comps…