 🔨 Auction
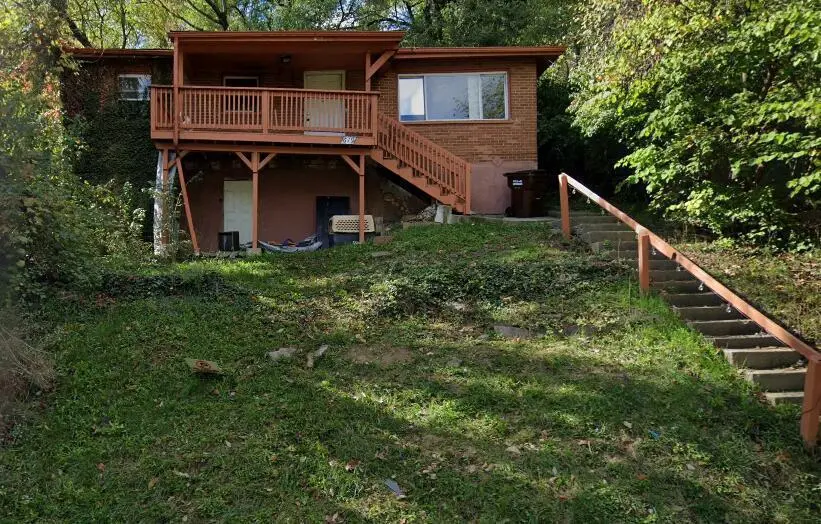
619 Edgecliff Rd · Covington, KY
Flood risk 1/10 · Minimal
- FEMA flood zone
- X (unshaded)
- Chance of flooding over 30 yrs
- 0.0%
- Est. flood insurance / yr
- $507 – $1,088
Fire risk 1/10 · Minimal
- Est. fire insurance / yr
- $839 – $1,559
Heat risk 4/10 · Minor
- Hot days now (above 103°F)
- 7 days/yr
- Hot days in 30 yrs
- 19 days/yr
Wind risk 2/10 · Minimal
- Chance of severe wind over 30 yrs
- 1.0%
Air-quality risk 3/10 · Minor
- Unhealthy air days now
- 2 days/yr
- Unhealthy air days in 30 yrs
- 3 days/yr
Risk factors via First Street. Map © Google.
Why this score? — see what drove the D- grade
The composite is a weighted blend of 9 inputs, each scored 0–100. Each bar is that input's sub-score; the figure is the points it added to the 100-point composite (weight × sub-score).
- Cash flow +11.3/30.0
- ARV discount +7.5/15.0
- Livability +4.3/5.0
- Rent growth +3.8/5.0
- DSCR +3.3/10.0
- Condition / age +2.5/5.0
- 1% rule +2.3/10.0
- Schools +1.5/10.0
- Appreciation +0.0/10.0
$25,000
🖨 Deal sheet (PDF) 📄 Offer letter ✓ Due diligence
Listing remarks MLS
Attention investors, flippers, and visionaries! This is your chance to own a diamond in the rough in Covington, Kentucky. This home is ready for a makeover and priced to move at auction pricing—don't miss your opportunity to unlock its full potential! Situated just minutes from MainStrasse Village, downtown Cincinnati, and the riverfront, this property offers an upside for the right buyer. Auction ends August 11, 2025 at 6PM. 10 percent Buyers Premium added to the high bid, $5,000 deposit is due within 24 hours of bidding end.
Key facts
- 8,750 sq ft lot
- Parking
- Listed 55 days
Property features AI
Exterior
- Parking: Off-street parking
- Utilities: Public water; Private sewer; Natural gas available
- Home design: Single-family residence; One level; Existing structure
- Construction: Concrete construction; Concrete perimeter foundation
- Exterior features: Shingle roof; Lot roughly 0.2 acres (approx. 175 x 50)
Interior
- Bedrooms: Primary bedroom (approx. 12 x 12); Second bedroom (approx. 12 x 9)
- Bathrooms: 1 full bathroom (room approx. 12 x 7)
- Interior features: Living room (approx. 18 x 12)
Neighborhood map
What this means for you Summary
Snapshot
- This is a 2-bed/1.0-bath single-family listed at $25k.
Deal economics
- At list price, monthly cash flow is $-71 ($-854/yr) — negative.
- The deal already cash-flows at list — no discount required.
- Meets the 1% rule at list price ($1k rent vs $25k).
- Recommended offer: $24k (3.0% below list) — sets the bar for market timing.
Location & tenants
- Location reads 86/100 on livability (#40 in KY, #376 nationally) — a professional / high-income tenant draw. Strengths: amenities A+, commute A+, cost of living A+; Watch: employment D+.
- Covington Independent (suburban): math 10% / reading 27% proficiency, ranked #162 of 165 in KY (top 98%) — low school quality limits family demand, transient renter base, plan for 1-2y turnover; 78% free/reduced lunch — lower-income household profile, screen leases tightly.
- Zoned schools: Glenn O Swing Elementary (math 29% / reading 50%, grade F, #208 of 676 statewide, top 34%, 407 students, 78% FRL); Holmes Middle School (math 8% / reading 26%, grade F, #211 of 217 statewide, top 97%, 656 students, 84% FRL); Holmes High School (math 12% / reading 17%, grade F, #227 of 254 statewide, top 89%, 878 students, 80% FRL) — zoned schools at 81% FRL track the district average.
- Market conditions: Rents rising fast (+5.1%/yr); 60 active listings in the ZIP; 31 comparable units currently listed for rent nearby; rentals at typical pace (median 17d on market — plan ~3-4 weeks tenant-placement turnaround); 699 units permitted in Kenton County in 2024 (287 in 5+ unit buildings).
Forward outlook
- Local home prices are declining (-3.0%/yr); year-one equity from $1k of loan paydown is wiped out by about $6k of value loss. Plan a longer hold.
- Kenton County population projected at +5% by 2050 — modest demand growth; plan on rents tracking national, not racing it.
Negotiation context
- It's been on market 56 days — a 3% lower offer ($24k) is reasonable based on typical stale-listing flexibility.
- 4 sale attempts since 2y ago with the ask held roughly flat each time — persistent listings suggest the price (not the market) is what's stuck; bring a comps-based counter.
Risks & watch-outs
- Watch-outs: property tax is 4.7% of price; built in 1952 — expect roof / HVAC / electrical / plumbing capex.
Questions for the listing agent
- What do current leases actually rent for vs. the listed asking? Can we see a recent rent roll and the last 12 months of T-12 income?
- It's been on market 56 days. Have you received any prior offers? Is the seller open to a 3% concession, seller financing, or rate buy-down credit?
- Built in 1952 — when were the roof, HVAC, electrical panel, plumbing, and water heater last replaced?
- Property tax is high relative to price — has the assessment been appealed recently, and will the sale trigger a re-assessment?
- Is there a deadline driving the sale (1031 exchange, divorce, estate, relocation)? That informs how much negotiation room exists.
- The area grade is low — what's the realistic commute time and amenity access for the typical tenant pool here? Any planned neighborhood developments (good or bad) we should know about?
- What's the average days-on-market for RENTAL listings here right now (not sales)? A rising rental-DOM trend means longer vacancies and softer asking-rent achievability than the comps imply.
- What's the recent tenant-quality profile in this submarket — average credit score on applications, eviction rate, late-payment / NSF rate, and stable-employment percentage? A property-management company in the area should have these aggregated.
- How much new for-sale + rental construction is in the pipeline within 1–3 miles? Heavy new supply typically softens prices + rents 12–24 months out; constrained supply supports both.
Investment metrics
- 1% rule
- 0.73% ✗
- Cap rate
- 5.86%
- Cash-on-cash
- -1.54%
- DSCR
- 0.93
- GRM
- 11.4
CMA / ARV
- ARV (on-the-fly)
- $198,588
- Comps found
- 12
Show comp detail 12 sales within ~0.75 mi
| Address | Dist | Beds/Ba | Sqft | Sold | Price | $/sf | Match |
|---|---|---|---|---|---|---|---|
| 417 W 16th St | 0.19mi | 2/1.0 | 1,104 (+12%) | 1mo | $52,500 | $48 | 71 |
| 1549 Woodburn Ave | 0.28mi | 2/1.0 | 1,072 (+8%) | 3mo | $215,000 | $201 | 70 |
| 1432 Banklick St | 0.47mi | 2/1.0 | 1,026 (+4%) | 2mo | $85,000 | $83 | 70 |
| 331 W 17th St | 0.25mi | 2/1.0 | 1,131 (+14%) | 2mo | $97,000 | $86 | 62 |
| 1624 Woodburn Ave | 0.29mi | 2/1.0 | 840 (-15%) | 0mo | $105,000 | $125 | 61 |
| 1821 Jefferson Ave | 0.26mi | 3/2.0 (+1) | 1,116 (+13%) | 2mo | $242,000 | $217 | 55 |
| 1211 Hilltop Dr | 0.58mi | 3/1.0 (+1) | 1,059 (+7%) | 1mo | $230,000 | $217 | 55 |
| 644 W 12th St | 0.48mi | 3/2.5 (+1) | 1,056 (+7%) | 1mo | $235,000 | $223 | 54 |
| 602 Rosemont Ave | 0.60mi | 2/1.5 | 1,080 (+9%) | 2mo | $310,000 | $287 | 53 |
| 2011 Howell St | 0.50mi | 3/1.5 (+1) | 1,104 (+12%) | 2mo | $189,000 | $171 | 49 |
| 907 Highland Ave | 0.61mi | 3/1.5 (+1) | 1,080 (+9%) | 3mo | $185,000 | $171 | 46 |
| 936 York St | 0.67mi | 1/1.0 (-1) | 882 (-11%) | 1mo | $205,000 | $232 | 45 |
Match score weights: distance 35% · size 25% · config 20% · recency 20%. Top-matched comps best support the ARV.
Projected returns pro-forma
-3.0% appreciation · 5.13% rent growth · sell at horizon
- IRR
- -16.8%
- Equity multiple
- 0.40×
- Total profit
- $-33,593
- Equity at exit
- $29,610
- IRR
- -5.6%
- Equity multiple
- 0.61×
- Total profit
- $-21,708
- Equity at exit
- $17,170
Cash invested: $55,605 (down + closing). Projections, not guarantees.
Landlord ↔ Tenant lean methodology
- Overall (STATE)
- 83 Strongly Landlord-Friendly
- State Kentucky
- 83 Strongly Landlord-Friendly · R+16
- County
- — inherits STATE
- City
- — inherits STATE
ZIP-level market 41014
- Rents YoY
- 5.1%
- Active inventory
- 60
- Price-to-rent
- 1.4×
Monthly cashflow live
- Estimated rent
- $1,457 high interval (Pro) →
- Mortgage (P&I)
- −$1,041
- Tax from tax record
- −$98 /mo · $1,174/yr
- Insurance
- −$83
- HOA
- −$0
- Vacancy / Maint / Mgmt
- −$306
- Net cashflow
- $-71
Break-even live
Sensitivity live
| Price | -10% $41 | -5% $-15 | +0% $-71 | +5% $-127 | +10% $-184 |
|---|---|---|---|---|---|
| Rent | -10% $-186 | -5% $-129 | +0% $-71 | +5% $-14 | +10% $44 |
| Rate | -1.0pp $29 | -0.5pp $-21 | base $-71 | +0.5pp $-123 | +1.0pp $-175 |
UW: 25.0% down · 7.5% · 30yr · 1.5% tax · 5.0% vac · 8.0% maint · 8.0% mgmt
Financing live
Cash to close
- Down payment
- $49,647
- Closing costs
- $5,958
- Reserves months
- —
- Total cash needed
- —
Loan-product check · same deal, 3 products live
Conventional
25% down · 7.5% · 30yr
- Down + closing
- —
- Monthly P&I
- —
- Monthly cashflow
- —
- DSCR
- —
- Eligible?
- —
Personal DTI + credit; lowest rate.
DSCR
20% down · 8.5% · 30yr
- Down + closing
- —
- Monthly P&I
- —
- Monthly cashflow
- —
- DSCR
- —
- Eligible?
- —
No personal income docs; deal must DSCR.
Hard money
10% down · 12.0% · 12mo
- Down + closing
- —
- Monthly P&I
- —
- Monthly cashflow
- —
- DSCR
- —
- Eligible?
- —
Short-term bridge; refi at stabilization.
Rent comps 31 comps
| Address | Beds | Baths | Sqft | Rent | $/sqft | DOM | Units | Dist |
|---|---|---|---|---|---|---|---|---|
| 1431 Dixie Hwy Park Hills, KY | 1.0–2.0 | 1.0–2.0 | 920 | $2,553 | $2.77 | 3d | 10 | 0.49mi |
| 1205 Lee St Unit 1 Covington, KY | 1.0 | 1.0 | 675 | $1,350 | $2.00 | 25d | 1 | 0.53mi |
| 1205 Lee St Unit 2 Covington, KY | 1.0 | 1.0 | 800 | $1,500 | $1.88 | 25d | 1 | 0.53mi |
| 918 Highland Ave Fort Wright, KY | 1.0 | 1.0 | 525 | $995 | $1.90 | 23d | 1 | 0.66mi |
| 1215 Elberta Cir Park Hills, KY | 2.0 | 1.0 | 825 | $1,050 | $1.27 | 5d | 1 | 0.67mi |
| 920 Highland Ave Fort Wright, KY | 1.0 | 1.0 | 525 | $1,045 | $1.99 | 16d | 1 | 0.67mi |
| 1002 Parkvale Ct Unit 1002 3 Park Hills, KY | 1.0 | 1.0 | 750 | $925 | $1.23 | 9d | 1 | 0.67mi |
| 1002 Parkvale Ct Unit 1004 1 Park Hills, KY | 2.0 | 1.0 | 850 | $995 | $1.17 | 45d | 1 | 0.67mi |
| 1000 Parkvale Ct Park Hills, KY | 2.0 | 1.0 | 850 | $1,495 | $1.76 | 45d | 1 | 0.67mi |
| 2220 Cityscape Dr Covington, KY | 1.0–2.0 | 1.0–2.0 | 932 | $1,985 | $2.13 | 3d | 9 | 0.92mi |
| 1025 Scott St Unit 2 Covington, KY | 2.0 | 2.0 | 1100 | $1,800 | $1.64 | 4d | 1 | 0.94mi |
| 1914 Eastern Ave Apt 3 Covington, KY | 1.0 | 1.0 | 900 | $995 | $1.11 | 16d | 1 | 1.05mi |
| 1914 Eastern Ave Apt 1 Covington, KY | 2.0 | 1.0 | 750 | $1,200 | $1.60 | 25d | 1 | 1.05mi |
| 344 E 13th St Unit 1 Covington, KY | 2.0 | 1.0 | 1000 | $1,275 | $1.27 | 25d | 1 | 1.07mi |
| 512 Wallace Ave Unit 512/08 Covington, KY | 1.0 | 1.0 | 550 | $899 | $1.63 | 19d | 1 | 1.10mi |
| 512 Wallace Ave Unit 512/09 Covington, KY | 1.0 | 1.0 | 550 | $899 | $1.63 | 9d | 1 | 1.10mi |
| 512 Wallace Ave Unit 512/16 Covington, KY | 1.0 | 1.0 | 550 | $939 | $1.71 | 9d | 1 | 1.10mi |
| 512 Wallace Ave Unit 512/18 Covington, KY | 2.0 | 2.0 | 900 | $1,299 | $1.44 | 9d | 1 | 1.10mi |
| 515 Main St Covington, KY | 1.0–2.0 | 1.0–2.0 | 934 | $2,215 | $2.37 | 3d | 8 | 1.11mi |
| 218 W 5th St Covington, KY | 1.0 | 1.0 | 800 | $1,595 | $1.99 | 16d | 1 | 1.15mi |
| 634 Greenup St Covington, KY | 1.0 | 1.5 | 1050 | $1,595 | $1.52 | 9d | 1 | 1.21mi |
| 521 Garrard St Apt 6 Covington, KY | 1.0 | 1.0 | 775 | $1,995 | $2.57 | 18d | 1 | 1.32mi |
| 521 Garrard St Apt 2 Covington, KY | 1.0 | 1.0 | 725 | $1,595 | $2.20 | 19d | 1 | 1.32mi |
| 521 Garrard St Apt 1 Covington, KY | 1.0 | 1.5 | 825 | $1,895 | $2.30 | 19d | 1 | 1.32mi |
| 521 Garrard St Apt 4 Covington, KY | 1.0 | 1.0 | 725 | $1,695 | $2.34 | 19d | 1 | 1.32mi |
| 521 Garrard St Apt 3 Covington, KY | 1.0 | 1.0 | 875 | $1,996 | $2.28 | 16d | 1 | 1.32mi |
| 5 Devou Woods Covington, KY | 2.0 | 1.0 | 700 | $890 | $1.27 | 3d | 1 | 1.43mi |
| 303 Greenup St Covington, KY | 1.0 | 1.0 | 678 | $1,445 | $2.13 | 25d | 1 | 1.45mi |
| 119 W 33rd St Unit 1 Latonia, KY | 1.0 | 1.0 | 900 | $1,075 | $1.19 | 25d | 1 | 1.46mi |
| 50 W Rivercenter Blvd Covington, KY | 1.0–2.0 | 1.0–2.5 | 1273 | $3,640 | $2.86 | 3d | 9 | 1.47mi |
| 1839 Pikeview Ct Covington, KY | 1.0 | 1.0 | 625 | $1,011 | $1.62 | 16d | 1 | 1.50mi |
Listing history 23 events
-
2026-06-18days on market $25,000 Active 56 DOM
-
2026-06-17days on market $25,000 Active 55 DOM
-
2026-06-16days on market $25,000 Active 54 DOM
-
2026-06-15days on market $25,000 Active 53 DOM
-
2026-06-09days on market $25,000 Active 47 DOM
-
2026-06-08days on market $25,000 Active 46 DOM
-
2026-06-07days on market $25,000 Active 45 DOM
-
2026-06-03days on market $25,000 Active 41 DOM
-
2026-06-02days on market $25,000 Active 40 DOM
-
2026-06-01days on market $25,000 Active 39 DOM
-
2026-05-31days on market $25,000 Active 38 DOM
-
2026-04-23$25,000 Active
-
2025-12-29historical
-
2025-10-30$30,000 Active
-
2025-09-04soldstatus $51,000 Sold 538-char remark
Show marketing remark (538 chars)
Attention investors, flippers, and visionaries! This is your chance to own a diamond in the rough in Covington, Kentucky. This home is ready for a makeover and priced to move at auction pricing—don't miss your opportunity to unlock its full potential! Situated just minutes from MainStrasse Village, downtown Cincinnati, and the riverfront, this property offers an upside for the right buyer. Auction ends August 11, 2025 at 6PM. 10 percent Buyers Premium added to the high bid, $5,000 deposit is due within 24 hours of bidding end.
-
2025-08-12status Pending 538-char remark
Show marketing remark (538 chars)
Attention investors, flippers, and visionaries! This is your chance to own a diamond in the rough in Covington, Kentucky. This home is ready for a makeover and priced to move at auction pricing—don't miss your opportunity to unlock its full potential! Situated just minutes from MainStrasse Village, downtown Cincinnati, and the riverfront, this property offers an upside for the right buyer. Auction ends August 11, 2025 at 6PM. 10 percent Buyers Premium added to the high bid, $5,000 deposit is due within 24 hours of bidding end.
-
2025-08-04$29,000 Active 538-char remark
Show marketing remark (538 chars)
Attention investors, flippers, and visionaries! This is your chance to own a diamond in the rough in Covington, Kentucky. This home is ready for a makeover and priced to move at auction pricing—don't miss your opportunity to unlock its full potential! Situated just minutes from MainStrasse Village, downtown Cincinnati, and the riverfront, this property offers an upside for the right buyer. Auction ends August 11, 2025 at 6PM. 10 percent Buyers Premium added to the high bid, $5,000 deposit is due within 24 hours of bidding end.
-
2025-04-22historical
-
2025-01-29price $69,900
-
2024-12-16price $79,900
-
2024-11-22price $89,900
-
2024-10-22$99,900 Active
-
1996-10-22soldstatus $14,000
ⓘ Source: listings_history table (triggers on properties + properties_extension) + one-shot
backfill from property_details.listing_events for pre-trigger history.
Tax reassessment forecast KY · Resets to sale price
- Current annual tax
- $1,174 · $98/mo
- Projected year-2 tax
- $1,174 · $98/mo
- Expected delta
- $0/yr ($0/mo · 0.0%)
ⓘ Screening estimate from a state-policy table — verify with the county assessor before closing.
Climate risk First Street
- Flood 1/10 Low FEMA zone X (unshaded) · 0% chance over 30 yrs
- Wildfire 1/10 Low
- Heat 4/10 Moderate 7 d/yr ≥103°F today · 19 d/yr by 30 yrs out
- Wind 2/10 Low 100% chance of damaging wind over 30 yrs
- Air quality 3/10 Moderate 2 unhealthy d/yr today · 3 by 30 yrs out
Nearby sold comps map
Loading sold comps map…
Walkable amenities ~0.75 mi
Loading nearby amenities…
Taxation est. · year 1
- Rental income
- $17,481
- − Mortgage interest
- −$11,124
- − Property taxes
- −$1,174
- − Insurance
- −$993
- − Repairs & maintenance
- −$1,398
- − Management
- −$1,398
- − Depreciation
- −$5,777
- Taxable loss
- −$4,384
- Est. tax savings @ 24.0%
- +$1,052
- After-tax cash flow
- $198/yr
For passive investors: Depreciation is non-cash, so a rental often shows a tax loss while cash-flowing — sheltering income. Rental losses are passive: they offset passive income freely, and up to $25,000/yr can offset ordinary (W-2) income if you actively participate and your MAGI is under $100k (phasing out to $0 by $150k); unused losses carry forward. On sale, claimed depreciation is recaptured at up to 25%, and gains may owe capital-gains tax (a 1031 exchange can defer both). Figures are a year-1 estimate at your 24.0% rate — not tax advice; consult a CPA.
Schools (NCES district)
- District
- Covington Independent
- NCES district ID
- 2101350
- Math proficiency
- 10% ▼ -20.00%
- Reading proficiency
- 27% ▼ -14.00%
- Median HH income
- $33,681
- Composite
- 15.04/100
- National rank
- #9353
- State rank
- #162 of 165 in KY
Livability — Covington
- Score
- 86/100
- State rank
- #40
- US rank
- #376
Category grades
Schools grade is shown separately in the Schools card above.
Census & demographics
- Census place
- Covington, KY
- County
- Kenton County · 142,881 people
- City population
- 34,373
- Metro
- Cincinnati, OH-KY-IN
- Population (ZIP)
- 7,392
- Household income
- $61,382
- Rent vs Own
- Severe rent burden
- 511.0
Population outlook (Kenton County) Hauer SSP2
- Today (2025)
- 174,205 people
- By 2030
- 177,897 · +2.1%
- By 2040
- 182,671 · +4.9%
- By 2050
- 183,543 · +5.4%
- By 2075
- 178,977 · +2.7%
- By 2100
- 159,920 · -8.2%
Race, ethnicity, and origin ACS 2023
- Neighborhood character
- Predominantly White (71%)
- Race & ethnicity
- White 71% Two or more races 11% Hispanic / Latino 10% Black 8% Asian 2%
- Hispanic origin (detail)
- Mexican 1%
- Common ancestry
- Romanian 2% Lithuanian 1% Italian 1%
- Foreign-born
- 6% · Canada, China
- Languages at home
- 91% English-only · Spanish 8%
Political lean MEDSL · Kenton
- 2024 margin
- Strong R (+21.7) · D 38.2% · R 59.9% · Other 1.9%
- 2008→2024 swing
- -0.9pp no change · 2008: -20.9pp · 2024: -21.7pp
- All cycles
- 2024: R+21.7 2020: R+19.3 2016: R+26.1 2012: R+24.3 2008: R+20.9
Not yet ingested
- Civics
- —
Market trends
- HPI YoY
- ▼ -172.77%
- Current HPI
- 233.8216
- Rent YoY
- ▲ 5.13%
- Metro
- Cincinnati, OH-KY-IN
- State GDP YoY
- ▲ 1.81%
- F500 in state
- 4
Industry mix (Fortune 500 HQ in KY)
| Industry | F500 HQs | Revenue |
|---|---|---|
| Healthcare | 1 | $118B |
|
||
| Food / Beverage | 1 | $7B |
|
||
Price history
+78.6% since first listed12 events — show timeline
- 2026-04-23 Listed $25,000 NKMLS
- 2025-12-29 Listing Removed — NKMLS
- 2025-10-30 Listed $30,000 NKMLS
- 2025-09-04 Sold (MLS) $51,000 NKMLS
- 2025-08-12 Pending — NKMLS
- 2025-08-04 Listed $29,000 NKMLS
- 2025-04-22 Listing Removed — NKMLS
- 2025-01-29 Price Changed $69,900 NKMLS
- 2024-12-16 Price Changed $79,900 NKMLS
- 2024-11-22 Price Changed $89,900 NKMLS
- 2024-10-22 Listed $99,900 NKMLS
- 1996-10-22 Sold (Public Records) $14,000 Public Records
Property tax history
+0.7%/yrLatest (2025): $1,174 · +0.7% YoY. Source: county tax records.
Cash-flow waterfall
monthlySold comps — $/sqft
last 12 mo · ≤1 miLoading sold comps…