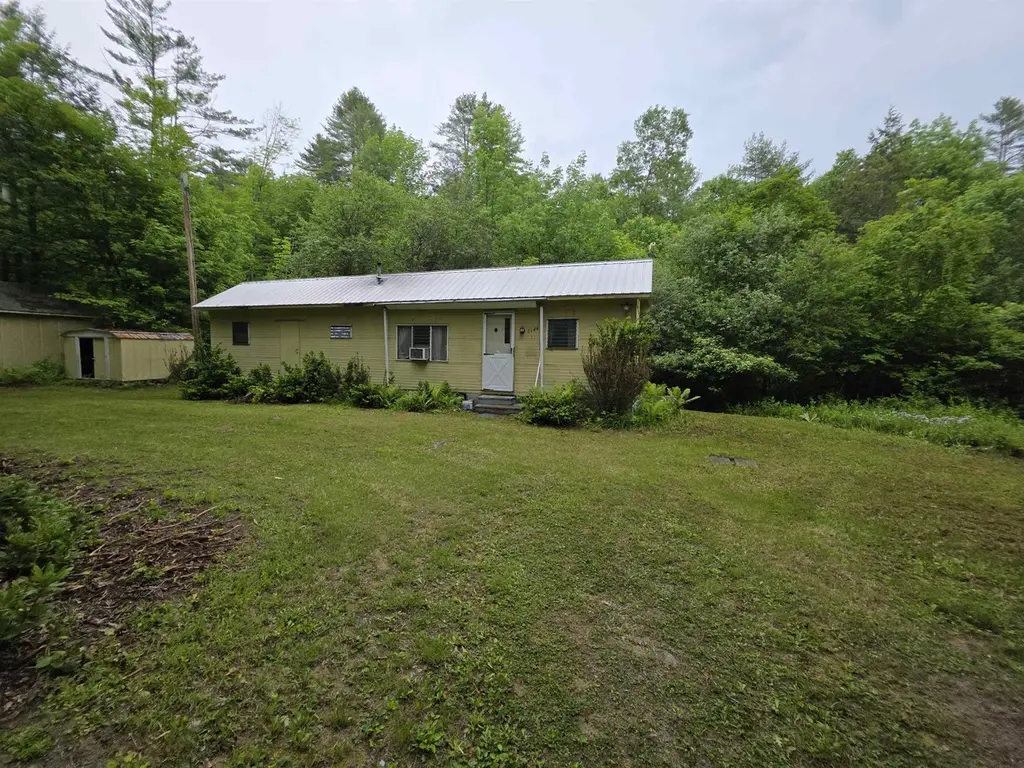
1144 Potash Brook Rd · Chester, VT
Flood risk 8/10 · Major
- FEMA flood zone
- A
- Chance of flooding over 30 yrs
- 0.99%
- Est. flood insurance / yr
- $946 – $6,584
Fire risk 1/10 · Minimal
- Est. fire insurance / yr
- $480 – $892
Heat risk 1/10 · Minimal
- Hot days now (above 89°F)
- 7 days/yr
- Hot days in 30 yrs
- 16 days/yr
Wind risk 3/10 · Minor
- Chance of severe wind over 30 yrs
- 6.0%
Air-quality risk 1/10 · Minimal
- Unhealthy air days now
- 0 days/yr
- Unhealthy air days in 30 yrs
- 0 days/yr
Risk factors via First Street. Map © Google.
Why this score? — see what drove the A- grade
The composite is a weighted blend of 9 inputs, each scored 0–100. Each bar is that input's sub-score; the figure is the points it added to the 100-point composite (weight × sub-score).
- Cash flow +30.0/30.0
- 1% rule +10.0/10.0
- DSCR +10.0/10.0
- Appreciation +10.0/10.0
- ARV discount +7.5/15.0
- Schools +5.0/10.0
- Livability +3.6/5.0
- Rent growth +2.5/5.0
- Condition / age +2.5/5.0
$75,000
🖨 Deal sheet (PDF) 📄 Offer letter ✓ Due diligence
Listing remarks
Nice country spot with older mobile home on it. Property is located in a flood zone so if removed could not be replaced with a permanent structure. Power, septic and electric on sight along with a 1 car garage. Home could be repaired, would also make a great spot for a snowbird wanting a spot in Vermont or anyone looking to park an RV. Property is sold AS IS CASH ONLY
Key facts
- 0.6 acre lot
- Garage
- Built 1959
Property features AI
Finance
- Other: Property is on existing (not new) status; Survey status: Unknown; Use GPS for directions; sign on property
- Financial info: No investor or income/expense details listed
- HOA & community: No HOA information listed
Exterior
- Parking: Detached or on-site space for 1 vehicle (1-car garage capacity)
- Security: Not specified
- Utilities: Drilled well water source; Private 1,000 gallon septic with leach field; Electric service with fuses; Fiber optic internet available; Telephone service available
- Home design: Single wide mobile home; Existing structure; Built in 1959
- Construction: Aluminum exterior construction; Metal roof; Year built: 1959
- Exterior features: Country setting with open areas and river frontage; Gravel driveway; Gravel public road frontage (283 feet); Yellow exterior color
Interior
- Kitchen: No appliances listed
- Bedrooms: Not specified
- Flooring: Not specified
- Bathrooms: One full bathroom
- Heating & cooling: Pellet stove heating
- Interior features: Five total rooms
- Laundry & utility: No laundry details listed
Neighborhood map
What this means for you Summary
Snapshot
- This is a 2-bed/1.0-bath manufactured listed at $75k.
Deal economics
- At list price, monthly cash flow is $192 ($2k/yr) — positive.
- The deal already cash-flows at list — no discount required.
- Meets the 1% rule at list price ($1k rent vs $75k).
Location & tenants
- Location reads 72/100 on livability (#30 in VT) — a middle-class / working-renter tenant base. Strengths: crime A+, housing A+, health & safety A+; Watch: amenities F, commute F.
- Market conditions: 50 active listings in the ZIP; 339 units permitted in Windsor County in 2024 (240 in 5+ unit buildings).
Forward outlook
- In year one you build about $8k of equity ($519 loan paydown + $8k appreciation (10.0% local appreciation)).
- Windsor County population projected at -21% by 2050 — secular population decline; favor cash flow + early exit over multi-decade hold.
- At projected returns (10.0% appreciation + 3.0% rent growth), your $21k cash investment doubles in ~2 years — after that, you're playing with house money.
- By year 5, paydown + projected appreciation supports a ~$37k cash-out refi (75% LTV) — recoverable capital for the next deal without selling this one.
Negotiation context
- Only 13 days on market — expect competitive offers; lowballing is unlikely to land.
- Current owner paid $45k; list at $75k implies a 67% gain — meaningful room to come down on a strong offer.
Risks & watch-outs
- Watch-outs: flood insurance adds $314/mo; built in 1959 — expect roof / HVAC / electrical / plumbing capex.
- Climate carrying-cost: in FEMA flood zone A (mandatory federal flood insurance) — expect insurance premiums to compound above CPI over the hold.
Questions for the listing agent
- Built in 1959 — when were the roof, HVAC, electrical panel, plumbing, and water heater last replaced?
- What's the actual annual flood-insurance premium (NFIP or private), and is the property in a SFHA with mandatory coverage?
- Is there a deadline driving the sale (1031 exchange, divorce, estate, relocation)? That informs how much negotiation room exists.
- What's the average days-on-market for RENTAL listings here right now (not sales)? A rising rental-DOM trend means longer vacancies and softer asking-rent achievability than the comps imply.
- What's the recent tenant-quality profile in this submarket — average credit score on applications, eviction rate, late-payment / NSF rate, and stable-employment percentage? A property-management company in the area should have these aggregated.
- How much new for-sale + rental construction is in the pipeline within 1–3 miles? Heavy new supply typically softens prices + rents 12–24 months out; constrained supply supports both.
Investment metrics
- 1% rule
- 1.72% ✓
- Cap rate
- 14.38%
- Cash-on-cash
- 28.90%
- DSCR
- 2.29
- GRM
- 4.8
CMA / ARV
No comps found within radius.
Projected returns pro-forma
10.0% appreciation · 3.0% rent growth · sell at horizon
- IRR
- 32.4%
- Equity multiple
- 3.54×
- Total profit
- $53,279
- Equity at exit
- $67,566
- IRR
- 28.1%
- Equity multiple
- 8.03×
- Total profit
- $147,702
- Equity at exit
- $145,709
Cash invested: $21,000 (down + closing). Projections, not guarantees.
Landlord ↔ Tenant lean methodology
- Overall (STATE)
- 41 Moderately Tenant-Leaning
- State Vermont
- 41 Moderately Tenant-Leaning · D+15
- County
- — inherits STATE
- City
- — inherits STATE
ZIP-level market 05143
- Home prices YoY
- 7.7%
- Active inventory
- 50
- Price-to-rent
- 4.8×
Monthly cashflow live
- Estimated rent
- $1,289 medium interval (Pro) →
- Mortgage (P&I)
- −$393
- Tax from tax record
- −$88 /mo · $1,062/yr
- Insurance
- −$31
- Flood insurance flood zone
- −$314 /mo · $3,765/yr
- HOA
- −$0
- Vacancy / Maint / Mgmt
- −$271
- Net cashflow
- $192
Break-even live
Sensitivity live
| Price | -10% $234 | -5% $213 | +0% $192 | +5% $171 | +10% $149 |
|---|---|---|---|---|---|
| Rent | -10% $90 | -5% $141 | +0% $192 | +5% $243 | +10% $294 |
| Rate | -1.0pp $230 | -0.5pp $211 | base $192 | +0.5pp $172 | +1.0pp $153 |
UW: 25.0% down · 7.5% · 30yr · 1.5% tax · 5.0% vac · 8.0% maint · 8.0% mgmt
Financing live
Cash to close
- Down payment
- $18,750
- Closing costs
- $2,250
- Reserves months
- —
- Total cash needed
- —
Loan-product check · same deal, 3 products live
Conventional
25% down · 7.5% · 30yr
- Down + closing
- —
- Monthly P&I
- —
- Monthly cashflow
- —
- DSCR
- —
- Eligible?
- —
Personal DTI + credit; lowest rate.
DSCR
20% down · 8.5% · 30yr
- Down + closing
- —
- Monthly P&I
- —
- Monthly cashflow
- —
- DSCR
- —
- Eligible?
- —
No personal income docs; deal must DSCR.
Hard money
10% down · 12.0% · 12mo
- Down + closing
- —
- Monthly P&I
- —
- Monthly cashflow
- —
- DSCR
- —
- Eligible?
- —
Short-term bridge; refi at stabilization.
Listing history 11 events
-
2026-06-21days on market $75,000 Active 13 DOM
-
2026-06-18days on market $75,000 Active 11 DOM
-
2026-06-17days on market $75,000 Active 10 DOM
-
2026-06-16days on market $75,000 Active 9 DOM
-
2026-06-15days on market $75,000 Active 8 DOM
-
2026-06-15days on market $75,000 Active 7 DOM
-
2026-06-13days on market $75,000 Active 6 DOM
-
2026-06-12days on market $75,000 Active 5 DOM
-
2026-06-09days on market $75,000 Active 2 DOM
-
2026-06-08remarks 370-char remark
-
2026-06-08$75,000 Active 1 DOM
ⓘ Source: listings_history table (triggers on properties + properties_extension) + one-shot
backfill from property_details.listing_events for pre-trigger history.
Tax reassessment forecast VT · Partial reset (capped growth)
- Current annual tax
- $1,062 · $88/mo
- Projected year-2 tax
- $1,243 · $104/mo
- Expected delta
- +$182/yr (+$15/mo · 17.1%)
ⓘ Screening estimate from a state-policy table — verify with the county assessor before closing.
Climate risk First Street
- Flood 8/10 Severe FEMA zone A · 99% chance over 30 yrs
- Wildfire 1/10 Low
- Heat 1/10 Low 7 d/yr ≥89°F today · 16 d/yr by 30 yrs out
- Wind 3/10 Moderate 6% chance of damaging wind over 30 yrs
- Air quality 1/10 Low 0 unhealthy d/yr today · 0 by 30 yrs out
Nearby sold comps map
Loading sold comps map…
Walkable amenities ~0.75 mi
Loading nearby amenities…
Taxation est. · year 1
- Rental income
- $15,474
- − Mortgage interest
- −$4,201
- − Property taxes
- −$1,062
- − Insurance
- −$4,140
- − Repairs & maintenance
- −$1,238
- − Management
- −$1,238
- − Depreciation
- −$2,182
- Taxable income
- $1,413
- Est. tax owed @ 24.0%
- −$339
- After-tax cash flow
- $1,964/yr
For passive investors: Depreciation is non-cash, so a rental often shows a tax loss while cash-flowing — sheltering income. Rental losses are passive: they offset passive income freely, and up to $25,000/yr can offset ordinary (W-2) income if you actively participate and your MAGI is under $100k (phasing out to $0 by $150k); unused losses carry forward. On sale, claimed depreciation is recaptured at up to 25%, and gains may owe capital-gains tax (a 1031 exchange can defer both). Figures are a year-1 estimate at your 24.0% rate — not tax advice; consult a CPA.
Schools (NCES district)
No district data.
Livability — Chester
- Score
- 72/100
- State rank
- #30
- US rank
- #6451
Category grades
Schools grade is shown separately in the Schools card above.
Census & demographics
- Population (ZIP)
- 4,916
Population outlook (Windsor County) Hauer SSP2
- Today (2025)
- 53,235 people
- By 2030
- 51,269 · -3.7%
- By 2040
- 46,517 · -12.6%
- By 2050
- 41,859 · -21.4%
- By 2075
- 33,298 · -37.5%
- By 2100
- 24,523 · -53.9%
Race, ethnicity, and origin ACS 2023
- Neighborhood character
- Predominantly White (96%)
- Race & ethnicity
- White 96% Two or more races 2% Black 1%
- Common ancestry
- Romanian 8% Lithuanian 6% Slovak 6%
- Foreign-born
- 4% · Canada
- Languages at home
- 97% English-only · French/Haitian/Cajun 2%
Political lean MEDSL · Windsor
- 2024 margin
- Solid D (+35.6) · D 66.3% · R 30.7% · Other 2.9%
- 2008→2024 swing
- -4.1pp toward R · 2008: 39.7pp · 2024: 35.6pp
- All cycles
- 2024: D+35.6 2020: D+38.9 2016: D+32.1 2012: D+38.1 2008: D+39.7
Not yet ingested
- Civics
- —
Market trends
- HPI YoY
- ▲ 25.13%
- Current HPI
- 352.8055
- Rent YoY
- —
- Metro
- —
- State GDP YoY
- —
- F500 in state
- 0
Price history
+66.7% since first listed2 events — show timeline
- 2026-06-07 Listed $75,000 PrimeMLS
- 2024-10-21 Sold (Public Records) $45,000 Public Records
Property tax history
-2.5%/yrLatest (2024): $1,062 · +12.2% YoY. Source: county tax records.
Cash-flow waterfall
monthlySold comps — $/sqft
last 12 mo · ≤1 miLoading sold comps…