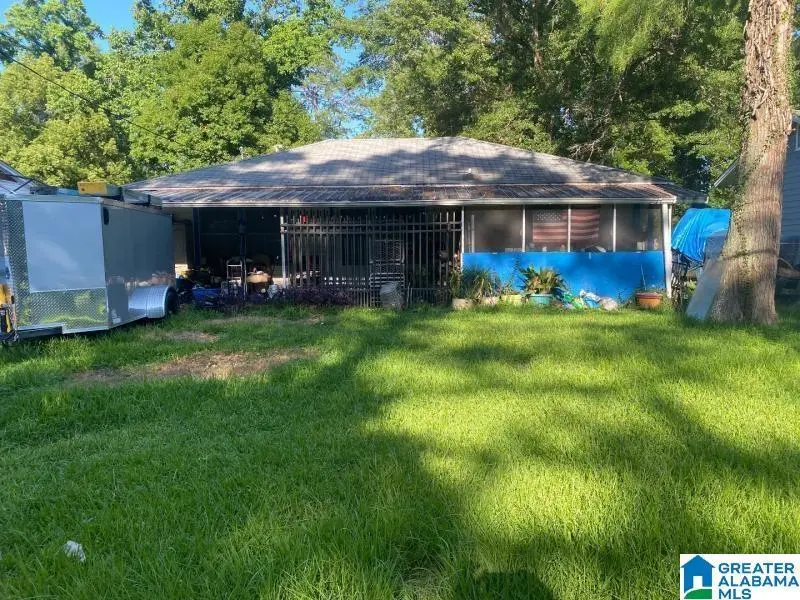
963 Cloverdale Dr · Mobile, AL
Flood risk 8/10 · Major
- FEMA flood zone
- X (unshaded)
- Chance of flooding over 30 yrs
- 0.99%
- Est. flood insurance / yr
- $507 – $1,088
Fire risk 1/10 · Minimal
- Est. fire insurance / yr
- $916 – $1,700
Heat risk 9/10 · Severe
- Hot days now (above 105°F)
- 7 days/yr
- Hot days in 30 yrs
- 19 days/yr
Wind risk 9/10 · Severe
- Chance of severe wind over 30 yrs
- 99.0%
Air-quality risk 2/10 · Minimal
- Unhealthy air days now
- 1 days/yr
- Unhealthy air days in 30 yrs
- 1 days/yr
Risk factors via First Street. Map © Google.
Why this score? — see what drove the B- grade
The composite is a weighted blend of 9 inputs, each scored 0–100. Each bar is that input's sub-score; the figure is the points it added to the 100-point composite (weight × sub-score).
- Cash flow +30.0/30.0
- DSCR +10.0/10.0
- 1% rule +9.2/10.0
- ARV discount +7.5/15.0
- Rent growth +3.8/5.0
- Livability +3.8/5.0
- Condition / age +2.5/5.0
- Schools +2.3/10.0
- Appreciation +0.0/10.0
$95,000
🖨 Deal sheet 📄 Offer letter ✓ Due diligence
Listing remarks MLS
READY TO MOVE INTO AND ENJOY THIS LOW-MAINTENANCE PROPERTY. THREE BEDROOMS THREE FULL BATHS. (ONE OF THE BED ROOM AND BATH HAS AN OUTSIDE ENTRANCE. THE KITCHEN AREA IS L SHAPE AND OFFERS AN EATING AREA AND SITTING AREA. A GREAT FEATURE IS THE COVERED PATIO WITH SLIDING GLASS DOOR FROM THE MASTER BED ROOM AND THE KITCHEN AREA. THE FENCED BACK YARD ALSO HAS A GATE TO ACCESS MAITRE PARK.
Key facts
- Cosmetic updates
- 0.27 acre lot
- Parking
Tags
Property features AI
Finance
- Other: Lot size approximately 0.27 acres; Not in a flood plain
- HOA & community: No association fee
Exterior
- Parking: Unassigned parking; One carport space
- Utilities: Public water; Connected sewer; Internet service available
- Home design: Existing construction; Single-story (all main level rooms listed); Slab foundation
- Construction: Vinyl siding
- Exterior features: Fenced yard; Porch; Covered and open patio; Garden/Patio
Interior
- Kitchen: Solid surface countertops; Refrigerator included
- Bedrooms: Master bedroom on main level; Two additional bedrooms on main level
- Flooring: Carpet; Tile; Vinyl
- Bathrooms: Three full bathrooms; Separate shower and separate vanities
- Heating & cooling: Forced air heating; Central cooling
- Interior features: Smooth ceilings; Split bedroom layout; Wood-burning fireplace with insert in the living room
- Laundry & utility: Electric water heater
Neighborhood map
What this means for you Summary
Snapshot
- This is a 3-bed/3.0-bath single-family listed at $95k.
Deal economics
- At list price, monthly cash flow is $381 ($5k/yr) — positive.
- The deal already cash-flows at list — no discount required.
- Meets the 1% rule at list price ($1k rent vs $95k).
- Cap rate 11.9% vs local median 4.9% in Mobile — top-decile yield for the area; either an underpriced asset or a hidden risk that comps aren't pricing in. Stress-test before assuming the spread holds.
Location & tenants
- Location reads 75/100 on livability (#20 in AL, #4,262 nationally) — a middle-class / working-renter tenant base. Strengths: commute A+, cost of living A+, housing A+; Watch: crime F, employment D-.
- Mobile County (urban): math 15% / reading 39% proficiency, ranked #81 of 129 in AL (top 63%) — low school quality limits family demand, transient renter base, plan for 1-2y turnover; 67% free/reduced lunch — lower-income household profile, screen leases tightly.
- Zoned schools: Maryvale Elementary School (math 5% / reading 25%, grade F, #505 of 627 statewide, top 81%, 494 students, 92% FRL); Murphy High School (math 10% / reading 19%, grade F, #220 of 305 statewide, top 77%, 1,254 students, 66% FRL).
- Zoned-school proficiency averages 15% at this address vs 27% district-wide (-12 pts) — the specific schools serving this property underperform the Mobile County average; the district grade overstates school quality for this exact location.
- Market conditions: Rents rising fast (+5.1%/yr); 174 active listings in the ZIP; 24 comparable units currently listed for rent nearby; rentals lingering (median 44d on market — plan ~5-8 weeks vacancy on turnover, expect pricing pressure); 62% of comp listings sitting > 30 days — soft ceiling on asking rent; 1,678 units permitted in Mobile County in 2024 (264 in 5+ unit buildings).
Forward outlook
- Local home prices are declining (-3.0%/yr); year-one equity from $657 of loan paydown is wiped out by about $3k of value loss. Plan a longer hold.
- Mobile County population projected to shrink 8% by 2050 — rents likely to lag national; underwrite the cash flow, not the appreciation.
- At projected returns (-3.0% appreciation + 5.1% rent growth), your $27k cash investment doubles in ~7 years — after that, you're playing with house money.
Negotiation context
- Only 9 days on market — expect competitive offers; lowballing is unlikely to land.
- 2 sale attempts since 11y ago with the ask held roughly flat each time — persistent listings suggest the price (not the market) is what's stuck; bring a comps-based counter.
- Current owner paid $49k; list at $95k implies a 94% gain — meaningful room to come down on a strong offer.
Risks & watch-outs
- Watch-outs: flood insurance adds $66/mo.
- Climate carrying-cost: severe flood risk; severe wind risk, 99% chance of damaging wind over 30y; extreme-heat days projected 7→19/yr by 2055 (HVAC capex compounding) — expect insurance premiums to compound above CPI over the hold.
Questions for the listing agent
- What's the actual annual flood-insurance premium (NFIP or private), and is the property in a SFHA with mandatory coverage?
- Is there a deadline driving the sale (1031 exchange, divorce, estate, relocation)? That informs how much negotiation room exists.
- Schools are D-rated, which usually means shorter tenancies and higher turnover. Who's the typical renter profile here, and what's been the actual vacancy rate?
- Crime grade is F in this area — have there been break-ins, vandalism, or insurance claims at this property in the last 3 years? What carrier currently insures it and at what premium?
- What's the average days-on-market for RENTAL listings here right now (not sales)? A rising rental-DOM trend means longer vacancies and softer asking-rent achievability than the comps imply.
- What's the recent tenant-quality profile in this submarket — average credit score on applications, eviction rate, late-payment / NSF rate, and stable-employment percentage? A property-management company in the area should have these aggregated.
- How much new for-sale + rental construction is in the pipeline within 1–3 miles? Heavy new supply typically softens prices + rents 12–24 months out; constrained supply supports both.
Investment metrics
- 1% rule
- 1.42% ✓
- Cap rate
- 11.94%
- Cash-on-cash
- 20.17%
- DSCR
- 1.90
- GRM
- 5.9
CMA / ARV
- ARV (on-the-fly)
- $199,836
- Comps found
- 12
Show comp detail 12 sales within ~0.75 mi
| Address | Dist | Beds/Ba | Sqft | Sold | Price | $/sf | Match |
|---|---|---|---|---|---|---|---|
| 957 Tanglewood Dr E | 0.15mi | 3/2.0 | 1,549 (-5%) | 8mo | $18,000 | $12 | 73 |
| 2755 Marcelus Dr | 0.56mi | 3/2.0 | 1,694 (+3%) | 0mo | $210,000 | $124 | 64 |
| 3006 Pleasant Valley Rd | 0.67mi | 3/2.0 | 1,613 (-2%) | 2mo | $110,000 | $68 | 61 |
| 2739 Belvedere Cir S | 0.62mi | 3/2.0 | 1,583 (-3%) | 8mo | $105,000 | $66 | 55 |
| 2758 Brookwood Dr | 0.75mi | 3/2.0 | 1,678 (+2%) | 3mo | $230,000 | $137 | 55 |
| 2755 Kreitner St | 0.65mi | 3/2.0 | 1,764 (+8%) | 0mo | $229,400 | $130 | 52 |
| 1000 Belvedere Cir E | 0.51mi | 4/2.0 (+1) | 1,467 (-10%) | 0mo | $190,000 | $130 | 50 |
| 918 Rowell St | 0.31mi | 3/1.0 | 1,413 (-14%) | 8mo | $78,000 | $55 | 48 |
| 509 W Barksdale Dr | 0.75mi | 3/2.0 | 1,550 (-5%) | 6mo | $250,000 | $161 | 48 |
| 716 Pinehill Dr | 0.55mi | 3/1.0 | 1,486 (-9%) | 9mo | $102,000 | $69 | 44 |
| 2762 Marcelus Dr | 0.61mi | 3/2.0 | 1,846 (+13%) | 5mo | $225,000 | $122 | 42 |
| 2113 Highland Ct | 0.71mi | 2/1.0 (-1) | 1,806 (+10%) | 5mo | $70,000 | $39 | 33 |
Match score weights: distance 35% · size 25% · config 20% · recency 20%. Top-matched comps best support the ARV.
Projected returns pro-forma
-3.0% appreciation · 5.06% rent growth · sell at horizon
- IRR
- 10.9%
- Equity multiple
- 1.44×
- Total profit
- $11,723
- Equity at exit
- $14,165
- IRR
- 21.6%
- Equity multiple
- 3.02×
- Total profit
- $53,734
- Equity at exit
- $8,214
Cash invested: $26,600 (down + closing). Projections, not guarantees.
Landlord ↔ Tenant lean methodology
- Overall (STATE)
- 90 Strongly Landlord-Friendly
- State Alabama
- 90 Strongly Landlord-Friendly · R+15
- County
- — inherits STATE
- City
- — inherits STATE
ZIP-level market 36606
- Rents YoY
- 5.1%
- Active inventory
- 174
- Price-to-rent
- 5.9×
Monthly cashflow live
- Estimated rent
- $1,344 high interval (Pro) →
- Mortgage (P&I)
- −$498
- Tax from tax record
- −$77 /mo · $927/yr
- Insurance
- −$40
- Flood insurance flood zone
- −$66 /mo · $798/yr
- HOA
- −$0
- Vacancy / Maint / Mgmt
- −$282
- Net cashflow
- $381
Break-even live
UW: 25.0% down · 7.5% · 30yr · 1.5% tax · 5.0% vac · 8.0% maint · 8.0% mgmt
Financing live
Cash to close
- Down payment
- $23,750
- Closing costs
- $2,850
- Reserves months
- —
- Total cash needed
- —
Loan-product check · same deal, 3 products live
Conventional
25% down · 7.5% · 30yr
- Down + closing
- —
- Monthly P&I
- —
- Monthly cashflow
- —
- DSCR
- —
- Eligible?
- —
Personal DTI + credit; lowest rate.
DSCR
20% down · 8.5% · 30yr
- Down + closing
- —
- Monthly P&I
- —
- Monthly cashflow
- —
- DSCR
- —
- Eligible?
- —
No personal income docs; deal must DSCR.
Hard money
10% down · 12.0% · 12mo
- Down + closing
- —
- Monthly P&I
- —
- Monthly cashflow
- —
- DSCR
- —
- Eligible?
- —
Short-term bridge; refi at stabilization.
Rent comps 24 comps
| Address | Beds | Baths | Sqft | Rent | $/sqft | DOM | Units | Dist |
|---|---|---|---|---|---|---|---|---|
| 955 Cloverdale Dr Mobile, AL | 3.0 | 1.5 | 1128 | $1,125 | $1.00 | 44d | 1 | 0.06mi |
| 2425 Nortons Ln Unit C Mobile, AL | 2.0 | 1.0 | 1050 | $1,200 | $1.14 | 44d | 1 | 0.44mi |
| 2425 Nortons Ln Unit D Mobile, AL | 2.0 | 1.0 | 1050 | $1,100 | $1.05 | 13d | 1 | 0.44mi |
| 817 Hawkins St Mobile, AL | 3.0 | 1.0 | 1217 | $1,200 | $0.99 | 44d | 1 | 0.48mi |
| 713 Iris Ave Mobile, AL | 3.0 | 1.0 | 1617 | $1,300 | $0.80 | 21d | 1 | 0.58mi |
| 751 Farnell Ln Mobile, AL | 2.0 | 1.0 | 1100 | $1,400 | $1.27 | 44d | 1 | 0.70mi |
| 2068 Victory Ct Mobile, AL | 4.0 | 1.0 | 1259 | $1,225 | $0.97 | 44d | 1 | 0.78mi |
| 618 Clarke St Mobile, AL | 3.0 | 1.0 | 1427 | $1,200 | $0.84 | 44d | 1 | 0.96mi |
| 418 Durande Dr Mobile, AL | 3.0 | 2.0 | 1456 | $1,350 | $0.93 | 13d | 1 | 0.97mi |
| 615 Mohawk St Mobile, AL | 3.0 | 1.0 | 1172 | $1,500 | $1.28 | 44d | 1 | 0.98mi |
| 412 Pinehill Dr Mobile, AL | 2.0 | 2.0 | 2000 | $2,450 | $1.23 | 13d | 1 | 0.98mi |
| 2456 McLaughlin Dr Mobile, AL | 3.0 | 1.0 | 1405 | $1,300 | $0.93 | 44d | 1 | 1.00mi |
| 916 Delmar Dr Mobile, AL | 3.0 | 1.0 | 1100 | $1,400 | $1.27 | 13d | 1 | 1.04mi |
| 562 Clarke St Mobile, AL | 2.0 | 1.0 | 1061 | $1,025 | $0.97 | 44d | 1 | 1.12mi |
| 505 Bel Air Blvd Mobile, AL | 1.0–2.0 | 1.0–2.0 | 976 | $1,274 | $1.30 | 13d | 16 | 1.12mi |
| 1411 Greenbrier Dr Mobile, AL | 3.0 | 1.0 | 1069 | $995 | $0.93 | 44d | 1 | 1.16mi |
| 315 Hadrian St Mobile, AL | 3.0 | 2.0 | 1843 | $1,800 | $0.98 | 44d | 1 | 1.19mi |
| 706 Cherokee St Mobile, AL | 3.0 | 1.0 | 1260 | $1,375 | $1.09 | 21d | 1 | 1.24mi |
| 611 Dauphin Island Pkwy Mobile, AL | 3.0 | 2.0 | 1450 | $1,300 | $0.90 | 44d | 1 | 1.26mi |
| 1466 Darwood Dr Mobile, AL | 3.0 | 1.5 | 1053 | $1,400 | $1.33 | 44d | 1 | 1.32mi |
| 561 Dauphin Island Pkwy Mobile, AL | 4.0 | 2.0 | 1389 | $1,050 | $0.76 | 44d | 1 | 1.32mi |
| 2859 Brierwood Dr Mobile, AL | 3.0 | 1.0 | 1057 | $1,500 | $1.42 | 13d | 1 | 1.39mi |
| 2055 Steiner St Mobile, AL | 2.0 | 1.0 | 1797 | $895 | $0.50 | 44d | 1 | 1.44mi |
| 200 S Florida St Unit 101 Mobile, AL | 2.0 | 2.0 | 1150 | $1,375 | $1.20 | 21d | 1 | 1.49mi |
Listing history 9 events
-
2026-06-18days on market $95,000 Active 9 DOM
-
2026-06-17price $95,000 Active 8 DOM
-
2026-06-17days on market $99,000 Active 8 DOM
-
2026-06-16days on market $99,000 Active 7 DOM
-
2026-06-15days on market $99,000 Active 6 DOM
-
2026-06-14days on market $99,000 Active 4 DOM
-
2026-06-13days on market $99,000 Active 3 DOM
-
2026-06-09remarks 641-char remark
-
2026-06-09$99,000 Active 1 DOM
ⓘ Source: listings_history table (triggers on properties + properties_extension) + one-shot
backfill from property_details.listing_events for pre-trigger history.
Tax reassessment forecast AL · Resets to sale price
- Current annual tax
- $927 · $77/mo
- Projected year-2 tax
- $927 · $77/mo
- Expected delta
- $0/yr ($0/mo · 0.0%)
ⓘ Screening estimate from a state-policy table — verify with the county assessor before closing.
Climate risk First Street
- Flood 8/10 Severe FEMA zone X (unshaded) · 99% chance over 30 yrs
- Wildfire 1/10 Low
- Heat 9/10 Extreme 7 d/yr ≥105°F today · 19 d/yr by 30 yrs out
- Wind 9/10 Extreme 99% chance of damaging wind over 30 yrs
- Air quality 2/10 Low 1 unhealthy d/yr today · 1 by 30 yrs out
Nearby sold comps map
Loading sold comps map…
Walkable amenities ~0.75 mi
Loading nearby amenities…
Taxation est. · year 1
- Rental income
- $16,132
- − Mortgage interest
- −$5,321
- − Property taxes
- −$927
- − Insurance
- −$1,272
- − Repairs & maintenance
- −$1,291
- − Management
- −$1,291
- − Depreciation
- −$2,764
- Taxable income
- $3,266
- Est. tax owed @ 24.0%
- −$784
- After-tax cash flow
- $3,783/yr
For passive investors: Depreciation is non-cash, so a rental often shows a tax loss while cash-flowing — sheltering income. Rental losses are passive: they offset passive income freely, and up to $25,000/yr can offset ordinary (W-2) income if you actively participate and your MAGI is under $100k (phasing out to $0 by $150k); unused losses carry forward. On sale, claimed depreciation is recaptured at up to 25%, and gains may owe capital-gains tax (a 1031 exchange can defer both). Figures are a year-1 estimate at your 24.0% rate — not tax advice; consult a CPA.
Schools (NCES district)
- District
- Mobile County
- NCES district ID
- 0102370
- Math proficiency
- 15% ▼ -28.00%
- Reading proficiency
- 39% ▬ 0.00%
- Median HH income
- $42,455
- Composite
- 22.9/100
- National rank
- #8002
- State rank
- #81 of 129 in AL
Livability — Mobile
- Score
- 75/100
- State rank
- #20
- US rank
- #4262
Category grades
Schools grade is shown separately in the Schools card above.
Census & demographics
- Census place
- Mobile, AL
- County
- Mobile County · 246,577 people
- City population
- 205,729
- Metro
- Mobile, AL
- Population (ZIP)
- 18,728
- Household income
- $51,303
- Rent vs Own
- Severe rent burden
- 999.0
Population outlook (Mobile County) Hauer SSP2
- Today (2025)
- 415,303 people
- By 2030
- 411,755 · -0.9%
- By 2040
- 399,670 · -3.8%
- By 2050
- 382,616 · -7.9%
- By 2075
- 337,353 · -18.8%
- By 2100
- 283,391 · -31.8%
Race, ethnicity, and origin ACS 2023
- Neighborhood character
- Majority Black (56%)
- Race & ethnicity
- Black 56% White 37% Two or more races 5% Hispanic / Latino 4%
- Common ancestry
- Italian 2% Scottish 2% Lithuanian 1%
- Foreign-born
- 3% · Canada
- Languages at home
- 96% English-only · Spanish 3%
Political lean MEDSL · Mobile
- 2024 margin
- R (+16.4) · D 41.3% · R 57.7%
- 2008→2024 swing
- -7.7pp toward R · 2008: -8.7pp · 2024: -16.4pp
- All cycles
- 2024: R+16.4 2020: R+11.9 2016: R+13.9 2012: R+9.3 2008: R+8.7
Not yet ingested
- Civics
- —
Market trends
- HPI YoY
- ▼ -232.19%
- Current HPI
- 145.9025
- Rent YoY
- ▲ 5.06%
- Metro
- Mobile, AL
- State GDP YoY
- ▲ 2.94%
- F500 in state
- 4
Industry mix (Fortune 500 HQ in AL)
| Industry | F500 HQs | Revenue |
|---|---|---|
| Financial Services | 1 | $8B |
|
||
| Healthcare | 1 | $5B |
|
||
Price history
+100.0% since first listed4 events — show timeline
- 2026-06-09 Listed $99,000 Greater Alabama MLS
- 2016-08-05 Sold (Public Records) $49,013 Public Records
- 2016-07-29 Sold (MLS) $48,900 BCAR
- 2015-12-02 Listed $49,500 BCAR
Property tax history
+5.8%/yrLatest (2025): $927 · +6.9% YoY. Source: county tax records.
Cash-flow waterfall
monthlySold comps — $/sqft
last 12 mo · ≤1 miLoading sold comps…