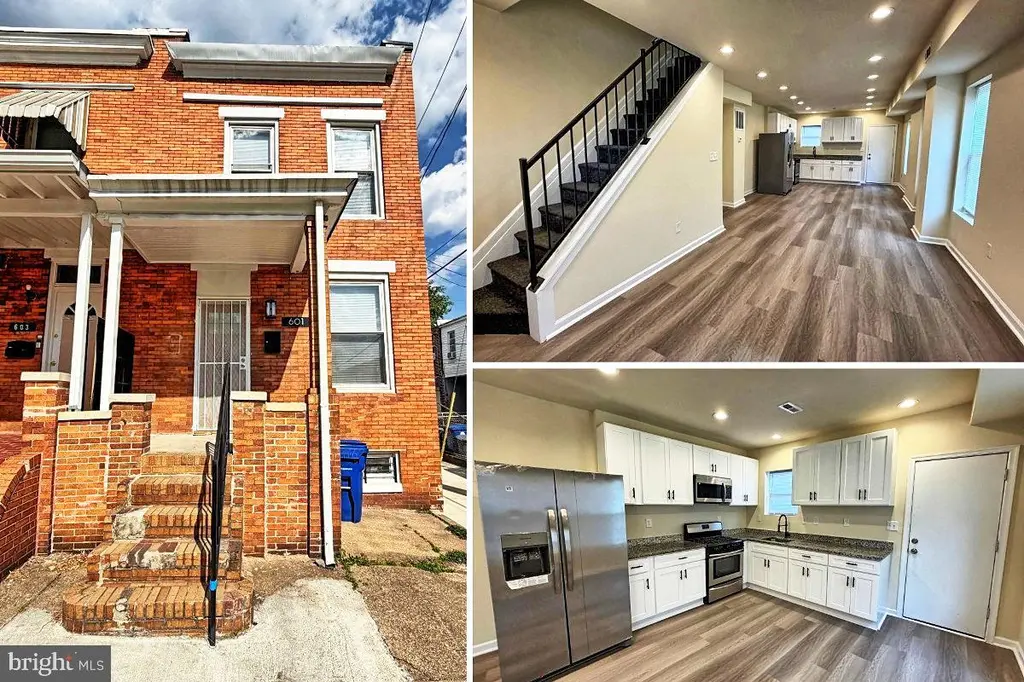
601 N Clinton St · Baltimore, MD
Flood risk 1/10 · Minimal
- FEMA flood zone
- X (unshaded)
- Chance of flooding over 30 yrs
- 0.0%
- Est. flood insurance / yr
- $473 – $860
Fire risk 1/10 · Minimal
- Est. fire insurance / yr
- $755 – $1,403
Heat risk 8/10 · Major
- Hot days now (above 103°F)
- 7 days/yr
- Hot days in 30 yrs
- 15 days/yr
Wind risk 6/10 · Moderate
- Chance of severe wind over 30 yrs
- 27.0%
Air-quality risk 4/10 · Minor
- Unhealthy air days now
- 6 days/yr
- Unhealthy air days in 30 yrs
- 7 days/yr
Risk factors via First Street. Map © Google.
Why this score? — see what drove the B- grade
The composite is a weighted blend of 9 inputs, each scored 0–100. Each bar is that input's sub-score; the figure is the points it added to the 100-point composite (weight × sub-score).
- Cash flow +30.0/30.0
- DSCR +10.0/10.0
- 1% rule +8.8/10.0
- ARV discount +7.5/15.0
- Rent growth +5.0/5.0
- Livability +3.8/5.0
- Condition / age +2.5/5.0
- Schools +1.0/10.0
- Appreciation +0.0/10.0
$139,900
🖨 Deal sheet (PDF) 📄 Offer letter ✓ Due diligence
Listing remarks
Beautifully renovated 3 brm EOG townhome. Featuring open and bright floorplan. Gleaming floors throughout the house. New kitchen w/ SS appliances and granite counter top. Updated baths. MUST SEE!
Key facts
- New kitchen
- Updated baths
- Open floorplan
Tags
Property features AI
Finance
- Other: Ownership is ground rent; Total below-grade area reported as 532 (unfinished); Above-grade finished area reported as 1,064; Year built reported by assessor
- HOA & community: Ground rent of $90 paid semi-annually
Exterior
- Parking: On-street parking
- Utilities: Public water; Public sewer; Electric cooling
- Home design: End of Row/Townhouse
- Construction: Brick construction
- Exterior features: End of row townhouse; Above-grade and below-grade structures
Interior
- Bedrooms: Three bedrooms on the upper level
- Bathrooms: One full bathroom
- Heating & cooling: Central heating; Central air conditioning; Natural gas heating; Natural gas hot water
- Interior features: Unfinished basement; Living area reported by assessor
Neighborhood map
What this means for you Summary
Snapshot
- This is a 3-bed/1.0-bath townhouse listed at $140k.
Deal economics
- At list price, monthly cash flow is $703 ($8k/yr) — positive.
- The deal already cash-flows at list — no discount required.
- Meets the 1% rule at list price ($2k rent vs $140k).
- Recommended offer: $136k (3.0% below list) — sets the bar for market timing.
Location & tenants
- Location reads 76/100 on livability (#90 in MD, #3,396 nationally) — a middle-class / working-renter tenant base. Strengths: amenities A+, commute A+, housing A+; Watch: crime F.
- Baltimore City Public Schools (urban): math 7% / reading 16% proficiency, ranked #24 of 24 in MD (top 100%) — low school quality limits family demand, transient renter base, plan for 1-2y turnover; 79% free/reduced lunch — lower-income household profile, screen leases tightly.
- Zoned schools: Highlandtown Elementary/Middle #237 (math 2% / reading 6%, grade F, #814 of 860 statewide, top 95%, 726 students, 59% FRL); Baltimore Polytechnic Institute (math 71% / reading 84%, grade A-, #22 of 222 statewide, top 10%, 1,555 students, 43% FRL) — zoned schools average 51% FRL vs 79% district-wide (28 pts lower); this property's tenant base skews higher-income than the district average.
- Zoned-school proficiency averages 41% at this address vs 12% district-wide (+29 pts) — the actual schools serving this property are materially stronger than the Baltimore City Public Schools average implies; a family-tenant draw the district grade alone would hide.
- Market conditions: Rents rising fast (+9.9%/yr); 145 active listings in the ZIP; 40 comparable units currently listed for rent nearby; rentals at typical pace (median 26d on market — plan ~3-4 weeks tenant-placement turnaround); lower-income renter base — watch delinquency; 1,273 units permitted in Baltimore city in 2024 (1,104 in 5+ unit buildings).
Forward outlook
- Local home prices are declining (-3.0%/yr); year-one equity from $967 of loan paydown is wiped out by about $4k of value loss. Plan a longer hold.
- Baltimore County population projected to shrink 4% by 2050 — rents likely to lag national; underwrite the cash flow, not the appreciation.
- At projected returns (-3.0% appreciation + 8.0% rent growth), your $39k cash investment doubles in ~5 years — after that, you're playing with house money.
Negotiation context
- It's been on market 58 days — a 3% lower offer ($136k) is reasonable based on typical stale-listing flexibility.
- 9 sale attempts since 28y ago with the ask held roughly flat each time — persistent listings suggest the price (not the market) is what's stuck; bring a comps-based counter.
- Current owner paid $24k; list at $140k implies a 483% gain — meaningful room to come down on a strong offer.
Risks & watch-outs
- Watch-outs: built in 1924 — expect roof / HVAC / electrical / plumbing capex.
- Climate carrying-cost: major wind risk, 27% chance of damaging wind over 30y; extreme-heat days projected 7→15/yr by 2055 (HVAC capex compounding) — expect insurance premiums to compound above CPI over the hold.
Questions for the listing agent
- It's been on market 58 days. Have you received any prior offers? Is the seller open to a 3% concession, seller financing, or rate buy-down credit?
- Built in 1924 — when were the roof, HVAC, electrical panel, plumbing, and water heater last replaced?
- Is there a deadline driving the sale (1031 exchange, divorce, estate, relocation)? That informs how much negotiation room exists.
- Schools are D-rated, which usually means shorter tenancies and higher turnover. Who's the typical renter profile here, and what's been the actual vacancy rate?
- Crime grade is F in this area — have there been break-ins, vandalism, or insurance claims at this property in the last 3 years? What carrier currently insures it and at what premium?
- What's the average days-on-market for RENTAL listings here right now (not sales)? A rising rental-DOM trend means longer vacancies and softer asking-rent achievability than the comps imply.
- What's the recent tenant-quality profile in this submarket — average credit score on applications, eviction rate, late-payment / NSF rate, and stable-employment percentage? A property-management company in the area should have these aggregated.
- How much new for-sale + rental construction is in the pipeline within 1–3 miles? Heavy new supply typically softens prices + rents 12–24 months out; constrained supply supports both.
Investment metrics
- 1% rule
- 1.38% ✓
- Cap rate
- 12.32%
- Cash-on-cash
- 21.53%
- DSCR
- 1.96
- GRM
- 6.0
CMA / ARV
- ARV (median comp)
- $79,658
- List price
- $139,900
- Delta
- 75.62%
- Verdict
- OVERPRICED
- Comps
- 20 within 1.0 mi
Show comp detail 12 sales within ~0.75 mi
| Address | Dist | Beds/Ba | Sqft | Sold | Price | $/sf | Match |
|---|---|---|---|---|---|---|---|
| 441 N East Ave | 0.13mi | 3/1.5 | 976 (-8%) | 2mo | $175,000 | $179 | 77 |
| 629 N Kenwood Ave | 0.39mi | 2/1.5 (-1) | 1,100 (+3%) | 1mo | $76,500 | $70 | 68 |
| 111 N Highland Ave | 0.32mi | 3/1.5 | 1,170 (+10%) | 1mo | $105,000 | $90 | 65 |
| 149 N Highland Ave | 0.27mi | 2/1.0 (-1) | 1,170 (+10%) | 1mo | $75,000 | $64 | 65 |
| 14 S Curley St | 0.54mi | 2/1.0 (-1) | 1,092 (+3%) | 1mo | $269,000 | $246 | 64 |
| 2703 Jefferson St | 0.46mi | 3/1.0 | 1,170 (+10%) | 2mo | $102,500 | $88 | 61 |
| 122 Ellwood Ave | 0.36mi | 3/1.5 | 1,200 (+13%) | 0mo | $235,000 | $196 | 60 |
| 735 N Lakewood Ave | 0.48mi | 3/1.5 | 970 (-9%) | 2mo | $80,000 | $82 | 60 |
| 2712 Ashland Ave | 0.50mi | 3/1.5 | 1,164 (+9%) | 1mo | $175,000 | $150 | 58 |
| 2736 Mura St | 0.66mi | 3/2.0 | 1,120 (+5%) | 0mo | $81,000 | $72 | 56 |
| 134 N Curley St | 0.42mi | 2/2.0 (-1) | 1,170 (+10%) | 1mo | $270,000 | $231 | 54 |
| 155 N Streeper St | 0.45mi | 2/2.0 (-1) | 912 (-14%) | 0mo | $220,000 | $241 | 46 |
Match score weights: distance 35% · size 25% · config 20% · recency 20%. Top-matched comps best support the ARV.
Projected returns pro-forma
-3.0% appreciation · 8.0% rent growth · sell at horizon
- IRR
- 19.2%
- Equity multiple
- 1.82×
- Total profit
- $32,239
- Equity at exit
- $20,860
- IRR
- 30.5%
- Equity multiple
- 4.37×
- Total profit
- $131,913
- Equity at exit
- $12,096
Cash invested: $39,172 (down + closing). Projections, not guarantees.
Landlord ↔ Tenant lean methodology
- Overall (CITY)
- 12 Strongly Tenant-Friendly
- State Maryland
- 27 Tenant-Leaning · D+14
- County
- — inherits STATE
- City Baltimore
- 12 Strongly Tenant-Friendly · D+58
ZIP-level market 21205
- Home prices YoY
- -5.8%
- Rents YoY
- 9.9%
- Active inventory
- 145
- Price-to-rent
- 6.0×
Monthly cashflow live
- Estimated rent
- $1,931 high interval (Pro) →
- Mortgage (P&I)
- −$734
- Tax from tax record
- −$31 /mo · $366/yr
- Insurance
- −$58
- HOA
- −$0
- Vacancy / Maint / Mgmt
- −$405
- Net cashflow
- $703
Break-even live
Sensitivity live
| Price | -10% $782 | -5% $742 | +0% $703 | +5% $663 | +10% $624 |
|---|---|---|---|---|---|
| Rent | -10% $550 | -5% $627 | +0% $703 | +5% $779 | +10% $855 |
| Rate | -1.0pp $773 | -0.5pp $738 | base $703 | +0.5pp $667 | +1.0pp $630 |
UW: 25.0% down · 7.5% · 30yr · 1.5% tax · 5.0% vac · 8.0% maint · 8.0% mgmt
Financing live
Cash to close
- Down payment
- $34,975
- Closing costs
- $4,197
- Reserves months
- —
- Total cash needed
- —
Loan-product check · same deal, 3 products live
Conventional
25% down · 7.5% · 30yr
- Down + closing
- —
- Monthly P&I
- —
- Monthly cashflow
- —
- DSCR
- —
- Eligible?
- —
Personal DTI + credit; lowest rate.
DSCR
20% down · 8.5% · 30yr
- Down + closing
- —
- Monthly P&I
- —
- Monthly cashflow
- —
- DSCR
- —
- Eligible?
- —
No personal income docs; deal must DSCR.
Hard money
10% down · 12.0% · 12mo
- Down + closing
- —
- Monthly P&I
- —
- Monthly cashflow
- —
- DSCR
- —
- Eligible?
- —
Short-term bridge; refi at stabilization.
Rent comps 40 comps
| Address | Beds | Baths | Sqft | Rent | $/sqft | DOM | Units | Dist |
|---|---|---|---|---|---|---|---|---|
| 3304 McElderry St Baltimore, MD | 3.0 | 2.0 | 1413 | $1,900 | $1.34 | 45d | 1 | 0.05mi |
| 520 N Decker Ave Baltimore, MD | 2.0 | 1.0 | 1000 | $1,650 | $1.65 | 45d | 1 | 0.22mi |
| 404 N Robinson St Baltimore, MD | 3.0 | 3.0 | 1320 | $2,200 | $1.67 | 26d | 1 | 0.23mi |
| 404 N Robinson St Baltimore, MD | 3.0 | 3.0 | 1320 | $2,100 | $1.59 | 18d | 1 | 0.23mi |
| 2934 E Monument St Baltimore, MD | 2.0 | 1.0 | 1200 | $1,499 | $1.25 | 45d | 1 | 0.24mi |
| 718 N Curley St Baltimore, MD | 3.0 | 3.0 | 1500 | $2,000 | $1.33 | 6d | 1 | 0.28mi |
| 724 N Curley St Baltimore, MD | 3.0 | 3.0 | 1500 | $2,200 | $1.47 | 6d | 1 | 0.28mi |
| 203 N Ellwood Ave Unit Main Baltimore, MD | 2.0 | 2.0 | 880 | $2,200 | $2.50 | 26d | 1 | 0.31mi |
| 3205 Esther Pl Baltimore, MD | 2.0 | 2.0 | 960 | $1,850 | $1.93 | 26d | 1 | 0.35mi |
| 2815 E Madison St Baltimore, MD | 4.0 | 2.0 | 1300 | $2,500 | $1.92 | 45d | 1 | 0.36mi |
| 113 N Clinton St Baltimore, MD | 2.0 | 1.0 | 1300 | $1,995 | $1.53 | 45d | 1 | 0.36mi |
| 2815 Orleans St Baltimore, MD | 2.0 | 1.0 | 1204 | $1,600 | $1.33 | 4d | 1 | 0.39mi |
| 2800 Orleans St Baltimore, MD | 3.0 | 1.0 | 1404 | $1,600 | $1.14 | 19d | 1 | 0.40mi |
| 2800 Orleans St Baltimore, MD | 3.0 | 1.0 | 1404 | $1,600 | $1.14 | 16d | 1 | 0.40mi |
| 17 N East Ave Baltimore, MD | 2.0 | 2.0 | 1326 | $2,550 | $1.92 | 26d | 1 | 0.41mi |
| 150 N Curley St Baltimore, MD | 2.0 | 2.5 | 1266 | $1,850 | $1.46 | 19d | 1 | 0.41mi |
| 531 N Belnord Ave Baltimore, MD | 2.0 | 1.5 | 1100 | $1,700 | $1.55 | 26d | 1 | 0.41mi |
| 29 N Ellwood Ave Baltimore, MD | 3.0 | 1.5 | 1100 | $2,395 | $2.18 | 26d | 1 | 0.42mi |
| 2729 Ashland Ave Baltimore, MD | 3.0 | 1.0 | 1000 | $1,350 | $1.35 | 4d | 1 | 0.43mi |
| 1 N Clinton St Baltimore, MD | 4.0 | 1.5 | 1200 | $1,700 | $1.42 | 22d | 1 | 0.43mi |
| 415 N Belnord Ave Baltimore, MD | 2.0 | 1.0 | 1008 | $1,300 | $1.29 | 26d | 1 | 0.44mi |
| 627 N Lakewood Ave Baltimore, MD | 3.0 | 2.5 | 1175 | $1,850 | $1.57 | 0d | 1 | 0.44mi |
| 3430 E Baltimore St Baltimore, MD | 3.0 | 2.5 | 1316 | $2,250 | $1.71 | 26d | 1 | 0.45mi |
| 1215 N Ellwood Ave Baltimore, MD | 3.0 | 1.0 | 1128 | $1,795 | $1.59 | 26d | 1 | 0.48mi |
| 34 N Linwood Ave Baltimore, MD | 2.0 | 1.5 | 1288 | $2,400 | $1.86 | 26d | 1 | 0.50mi |
| 502 N Glover St Baltimore, MD | 2.0 | 1.5 | 827 | $1,250 | $1.51 | 22d | 1 | 0.51mi |
| 415 N Glover St Baltimore, MD | 2.0 | 2.5 | 1092 | $1,600 | $1.47 | 26d | 1 | 0.51mi |
| 3436 Leverton Ave Baltimore, MD | 3.0 | 3.5 | 1500 | $2,350 | $1.57 | 26d | 1 | 0.51mi |
| 2608 McElderry St Baltimore, MD | 3.0 | 1.0 | 1144 | $1,525 | $1.33 | 0d | 1 | 0.51mi |
| 3413 Leverton Ave Baltimore, MD | 2.0 | 1.0 | 832 | $1,000 | $1.20 | 26d | 1 | 0.52mi |
| 1310 N Ellwood Ave #1 Baltimore, MD | 2.0 | 1.0 | 1000 | $1,550 | $1.55 | 23d | 1 | 0.54mi |
| 1310 N Ellwood Ave Baltimore, MD | 2.0 | 1.0 | 1000 | $1,450 | $1.45 | 14d | 1 | 0.54mi |
| 10 N Streeper St Baltimore, MD | 3.0 | 2.5 | 1440 | $2,500 | $1.74 | 26d | 1 | 0.54mi |
| 139 N Lakewood Ave Baltimore, MD | 4.0 | 2.5 | 1370 | $2,500 | $1.82 | 45d | 1 | 0.54mi |
| 139 N Lakewood Ave Unit 1 Baltimore, MD | 4.0 | 2.0 | 1370 | $2,500 | $1.82 | 45d | 1 | 0.54mi |
| 106 S Bouldin St Baltimore, MD | 2.0 | 3.0 | 1134 | $2,100 | $1.85 | 22d | 1 | 0.55mi |
| 218 N Glover St Baltimore, MD | 2.0 | 2.0 | 1360 | $1,750 | $1.29 | 45d | 1 | 0.55mi |
| 2608 E Fayette St Unit 1 Baltimore, MD | 2.0 | 1.0 | 900 | $1,700 | $1.89 | 16d | 1 | 0.56mi |
| 517 N Rose St Baltimore, MD | 3.0 | 1.0 | 845 | $1,400 | $1.66 | 6d | 1 | 0.57mi |
| 225 N Luzerne Ave Baltimore, MD | 3.0 | 1.0 | 1198 | $1,350 | $1.13 | 21d | 1 | 0.57mi |
Listing history 44 events
-
2026-06-21days on market $139,900 Active 58 DOM
-
2026-06-18days on market $139,900 Active 55 DOM
-
2026-06-17days on market $139,900 Active 54 DOM
-
2026-06-16days on market $139,900 Active 53 DOM
-
2026-06-15days on market $139,900 Active 52 DOM
-
2026-06-13days on market $139,900 Active 50 DOM
-
2026-06-09days on market $139,900 Active 46 DOM
-
2026-06-08days on market $139,900 Active 45 DOM
-
2026-06-07days on market $139,900 Active 44 DOM
-
2026-06-04days on market $139,900 Active 41 DOM
-
2026-06-03days on market $139,900 Active 40 DOM
-
2026-06-02days on market $139,900 Active 39 DOM
-
2026-06-01days on market $139,900 Active 38 DOM
-
2026-05-31days on market $139,900 Active 37 DOM
-
2026-04-24$139,900 Active 196-char remark
-
2014-08-25historical Withdrawn
-
2014-08-25historical
-
2014-05-29Active
-
2014-05-29$20,000
-
2012-01-27soldstatus $24,000
-
2012-01-27soldstatus $24,000 Sold
-
2012-01-06status Contract
-
2012-01-06historical
-
2011-12-01status Active
-
2011-12-01historical Expired
-
2011-10-10price $29,900
-
2011-09-12soldstatus $185,000
-
2011-09-08$24,900 Active
-
2011-09-08$29,900
-
2005-12-14soldstatus $52,500
-
2005-03-02historical
-
2005-02-18
-
2004-11-23soldstatus $51,000
-
2002-06-14soldstatus $15,000
-
2002-05-14historical
-
2002-05-08$19,900
-
1998-12-03soldstatus $54,000
-
1998-12-03soldstatus $54,000
-
1998-08-21soldstatus $14,500
-
1998-08-21soldstatus $14,500
-
1998-08-15soldstatus $14,500
-
1998-06-24historical
-
1998-06-18$15,900
-
1989-08-25soldstatus $29,868
ⓘ Source: listings_history table (triggers on properties + properties_extension) + one-shot
backfill from property_details.listing_events for pre-trigger history.
Tax reassessment forecast MD · Partial reset (capped growth)
- Current annual tax
- $366 · $31/mo
- Projected year-2 tax
- $946 · $79/mo
- Expected delta
- +$579/yr (+$48/mo · 158.1%)
ⓘ Screening estimate from a state-policy table — verify with the county assessor before closing.
Climate risk First Street
- Flood 1/10 Low FEMA zone X (unshaded) · 0% chance over 30 yrs
- Wildfire 1/10 Low
- Heat 8/10 Severe 7 d/yr ≥103°F today · 15 d/yr by 30 yrs out
- Wind 6/10 Major 27% chance of damaging wind over 30 yrs
- Air quality 4/10 Moderate 6 unhealthy d/yr today · 7 by 30 yrs out
Nearby sold comps map
Loading sold comps map…
Walkable amenities ~0.75 mi
Loading nearby amenities…
Taxation est. · year 1
- Rental income
- $23,169
- − Mortgage interest
- −$7,837
- − Property taxes
- −$366
- − Insurance
- −$700
- − Repairs & maintenance
- −$1,854
- − Management
- −$1,854
- − Depreciation
- −$4,070
- Taxable income
- $6,490
- Est. tax owed @ 24.0%
- −$1,558
- After-tax cash flow
- $6,876/yr
For passive investors: Depreciation is non-cash, so a rental often shows a tax loss while cash-flowing — sheltering income. Rental losses are passive: they offset passive income freely, and up to $25,000/yr can offset ordinary (W-2) income if you actively participate and your MAGI is under $100k (phasing out to $0 by $150k); unused losses carry forward. On sale, claimed depreciation is recaptured at up to 25%, and gains may owe capital-gains tax (a 1031 exchange can defer both). Figures are a year-1 estimate at your 24.0% rate — not tax advice; consult a CPA.
Schools (NCES district)
- District
- Baltimore City Public Schools
- NCES district ID
- 2400090
- Math proficiency
- 7% ▼ -9.00%
- Reading proficiency
- 16% ▼ -5.00%
- Median HH income
- $42,108
- Composite
- 10.08/100
- National rank
- #9805
- State rank
- #24 of 24 in MD
Livability — Baltimore
- Score
- 76/100
- State rank
- #90
- US rank
- #3396
Category grades
Schools grade is shown separately in the Schools card above.
Census & demographics
- Census place
- Baltimore, MD
- County
- Baltimore City · 558,601 people
- City population
- 588,727
- Metro
- Baltimore-Columbia-Towson, MD
- Population (ZIP)
- 13,013
- Household income
- $43,176
- Rent vs Own
- Severe rent burden
- 966.0
Population outlook (Baltimore County) Hauer SSP2
- Today (2025)
- 624,249 people
- By 2030
- 621,541 · -0.4%
- By 2040
- 609,756 · -2.3%
- By 2050
- 597,249 · -4.3%
- By 2075
- 552,236 · -11.5%
- By 2100
- 513,934 · -17.7%
Race, ethnicity, and origin ACS 2023
- Neighborhood character
- Diverse neighborhood (Simpson 0.60)
- Race & ethnicity
- Black 60% Hispanic / Latino 16% White 14% Two or more races 11% Asian 3%
- Hispanic origin (detail)
- Mexican 1% Cuban 1% Dominican 4%
- Common ancestry
- Slovak 3% Romanian 1%
- Foreign-born
- 16% · Canada, China
- Languages at home
- 79% English-only · Spanish 11% Arabic 4% Chinese 1%
Political lean MEDSL · Baltimore
- 2024 margin
- Solid D (+73.0) · D 85.2% · R 12.2% · Other 2.6%
- 2008→2024 swing
- -2.5pp toward R · 2008: 75.5pp · 2024: 73.0pp
- All cycles
- 2024: D+73.0 2020: D+76.6 2016: D+74.6 2012: D+76.4 2008: D+75.5
Not yet ingested
- Civics
- —
Market trends
- HPI YoY
- ▼ -15.03%
- Current HPI
- 244.1345
- Rent YoY
- ▲ 9.88%
- Metro
- Baltimore-Columbia-Towson, MD
- State GDP YoY
- ▲ 2.97%
- F500 in state
- 12
Industry mix (Fortune 500 HQ in MD)
| Industry | F500 HQs | Revenue |
|---|---|---|
| Aerospace / Defense | 1 | $71B |
|
||
| Utilities | 1 | $25B |
|
||
| Hotels | 1 | $24B |
|
||
| Consumer Goods | 1 | $7B |
|
||
| Real Estate | 1 | $6B |
|
||
| Chemicals | 1 | $2B |
|
||
Price history
+368.4% since first listed30 events — show timeline
- 2026-04-24 Listed $139,900 BRIGHT MLS
- 2014-08-25 Delisted — MRIS
- 2014-08-25 Listing Removed — BRIGHT MLS
- 2014-05-29 Listed — MRIS
- 2014-05-29 Listed $20,000 BRIGHT MLS
- 2012-01-27 Sold (MLS) $24,000 MRIS
- 2012-01-27 Sold (MLS) $24,000 BRIGHT MLS
- 2012-01-06 Pending — MRIS
- 2012-01-06 Listing Removed — BRIGHT MLS
- 2011-12-01 Relisted — MRIS
- 2011-12-01 Delisted — MRIS
- 2011-10-10 Price Changed $29,900 MRIS
- 2011-09-12 Sold (Public Records) $185,000 Public Records
- 2011-09-08 Listed $24,900 MRIS
- 2011-09-08 Listed $29,900 BRIGHT MLS
- 2005-12-14 Sold (Public Records) $52,500 Public Records
- 2005-03-02 Delisted — MRIS
- 2005-02-18 Listed — MRIS
- 2004-11-23 Sold (Public Records) $51,000 Public Records
- 2002-06-14 Sold (MLS) $15,000 MRIS
- 2002-05-14 Delisted — MRIS
- 2002-05-08 Listed $19,900 MRIS
- 1998-12-03 Sold (Public Records) $54,000 Public Records
- 1998-12-03 Sold (Public Records) $54,000 Public Records
- 1998-08-21 Sold (Public Records) $14,500 Public Records
- 1998-08-21 Sold (Public Records) $14,500 Public Records
- 1998-08-15 Sold (MLS) $14,500 MRIS
- 1998-06-24 Delisted — MRIS
- 1998-06-18 Listed $15,900 MRIS
- 1989-08-25 Sold (Public Records) $29,868 Public Records
Property tax history
-7.9%/yrLatest (2025): $366 · +9.1% YoY. Source: county tax records.
Cash-flow waterfall
monthlySold comps — $/sqft
last 12 mo · ≤1 miLoading sold comps…