80 Huntington St #259 · Huntington Beach, CA
Flood risk No data
- FEMA flood zone
- —
- Chance of flooding over 30 yrs
- —
- Est. flood insurance / yr
- —
Fire risk No data
- Est. fire insurance / yr
- —
Heat risk No data
- Hot days now (above threshold)
- —
- Hot days in 30 yrs
- —
Wind risk No data
- Chance of severe wind over 30 yrs
- —
Air-quality risk No data
- Unhealthy air days now
- —
- Unhealthy air days in 30 yrs
- —
Risk factors via First Street. Map © Google.
Why this score? — see what drove the B grade
The composite is a weighted blend of 9 inputs, each scored 0–100. Each bar is that input's sub-score; the figure is the points it added to the 100-point composite (weight × sub-score).
- Cash flow +30.0/30.0
- 1% rule +10.0/10.0
- DSCR +10.0/10.0
- ARV discount +6.9/15.0
- Schools +6.5/10.0
- Livability +3.4/5.0
- Rent growth +3.2/5.0
- Condition / age +2.5/5.0
- Appreciation +0.0/10.0
$89,900
🖨 Deal sheet (PDF) 📄 Offer letter ✓ Due diligence
Listing remarks MLS
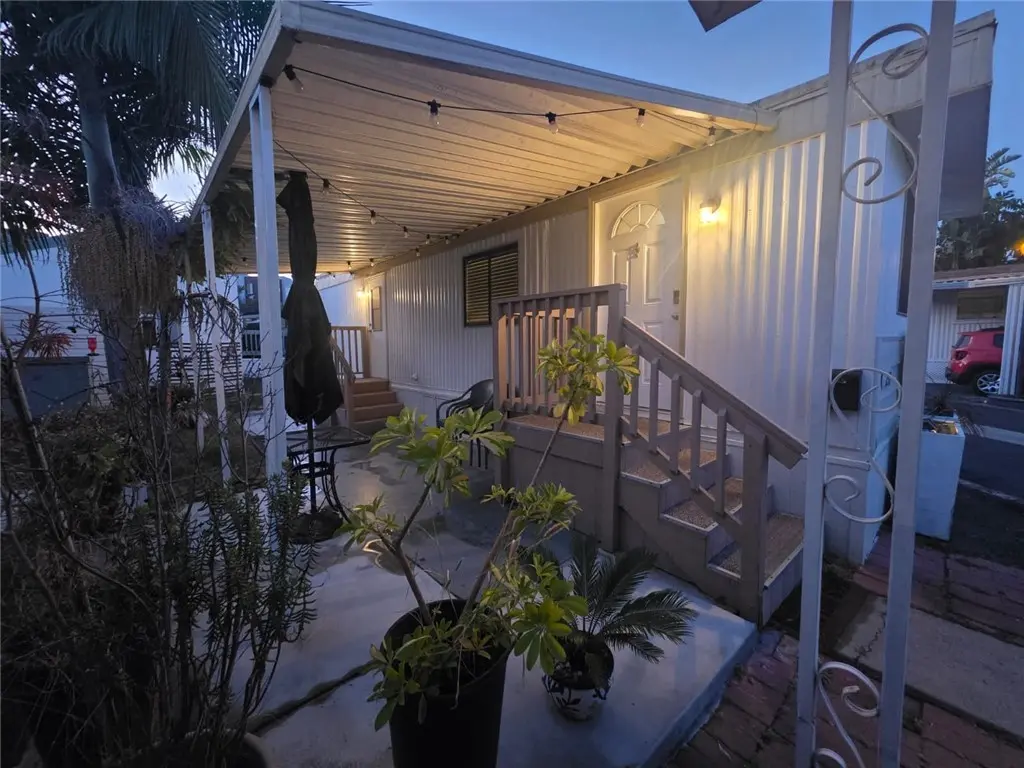
Located in Surf City Cottages! “Just ONE BLOCK from the beach, Pacific City, Huntington Beach Pier, shopping, dining, entertainment, and downtown Main Street. This beautifully updated, move-in-ready unit is clean, & well-maintained. The kitchen has been recently remodeled. Great outdoor patio space. Additional amenities include a covered parking space, a storage shed, and a freshly painted exterior. This is an all-age park with a community pool, laundry facilities, and a clubhouse. The unit must be owner-occupied; rentals and Airbnbs are not permitted. Buyers must be approved by the property manager and demonstrate a verified income of approximately 2 times the space rent. ” Call to view this cute property before it's too late!
Key facts
- Covered parking
- Remodeled kitchen
- Low land lease fee
Tags
Property features AI
Finance
- Other: Located in Surfside (SURF) park named SURF CITY BEACH COTTAGES; Access via paved city streets; a couple of blocks from the beach
- Financial info: Assessments: buyer to verify; Manager approval required for park residency; Pets allowed: contact manager
- HOA & community: Land lease community (seller-reported $2,350/month); Community features include street lighting, sidewalks, park and urban setting; Rent/includes: gas, association dues, trash, pool, water and sewer
Exterior
- Parking: Assigned covered paved private parking; Attached carport (1 space)
- Security: Smoke detectors; Carbon monoxide detectors
- Utilities: District/public water connected; Public sewer connected; Natural gas connected; Electricity connected (standard, on property); Cable available; Telephone in street
- Home design: Single-story mobile home (Skyline model); Entry at main level; Raised foundation; Has a view
- Construction: Wood construction with drywall interior walls; Composition roof; Steel skirting; One story; Year built per public records
- Exterior features: Front porch, terrace, open patio and deck with concrete surfaces; Exterior lighting; Close to clubhouse; One storage shed; In-ground community pool
Interior
- Kitchen: Refrigerator; Gas range; Corian countertops
- Bedrooms: Primary bedroom on main level; All bedrooms on main level
- Flooring: Laminate flooring
- Bathrooms: One full bathroom with tile counters and shower-in-tub
- Heating & cooling: Central furnace heating
- Interior features: Open floor plan; Recessed lighting; Corian counters; Storage space; Furnished; Blinds and window screens; Carbon monoxide and smoke detectors; In-ground community spa
- Laundry & utility: Inside laundry with stackable washer and dryer included
Neighborhood map
What this means for you Summary
Snapshot
- This is a 1-bed/1.0-bath manufactured listed at $90k.
Deal economics
- At list price, monthly cash flow is $1k ($16k/yr) — positive.
- The deal already cash-flows at list — no discount required.
- Meets the 1% rule at list price ($2k rent vs $90k).
- Recommended offer: $89k (1.5% below list) — sets the bar for market timing.
- Cap rate 24.3% vs local median 1.6% in Huntington Beach — top-decile yield for the area; either an underpriced asset or a hidden risk that comps aren't pricing in. Stress-test before assuming the spread holds.
Location & tenants
- Location reads 67/100 on livability (#306 in CA) — a middle-class / working-renter tenant base. Strengths: employment A+, commute A-; Watch: amenities C-, cost of living F, health & safety F.
- Huntington Beach Union High (suburban): math 65% / reading 82% proficiency, ranked #39 of 517 in CA (top 8%) — strong family-tenant draw, lease renewals of 3-5y typical.
- Zoned schools: John R. Peterson Elementary (489 students, 43% FRL); Ethel Dwyer Middle (995 students, 27% FRL); Huntington Beach High (math 72% / reading 87%, grade A-, #45 of 1,170 statewide, top 4%, 2,807 students, 32% FRL).
- Market conditions: Rents rising (+2.8%/yr); 137 active listings in the ZIP; high-income renter base; 6,974 units permitted in Orange County in 2024 (3,839 in 5+ unit buildings).
Forward outlook
- Local home prices are declining (-3.0%/yr); year-one equity from $622 of loan paydown is wiped out by about $3k of value loss. Plan a longer hold.
- Orange County population projected at +14% by 2050 — modest demand growth; plan on rents tracking national, not racing it.
- At projected returns (-3.0% appreciation + 2.8% rent growth), your $25k cash investment doubles in ~2 years — after that, you're playing with house money.
Negotiation context
- It's been on market 23 days — a 2% lower offer ($89k) is reasonable based on typical stale-listing flexibility.
- 9 sale attempts since 18y ago with the ask held roughly flat each time — persistent listings suggest the price (not the market) is what's stuck; bring a comps-based counter.
- Current owner paid $60k; 50% above their basis — modest negotiation headroom, anchor on the comps not their cost.
Questions for the listing agent
- Built in 1979 — when were the roof, HVAC, electrical panel, plumbing, and water heater last replaced?
- Is there a deadline driving the sale (1031 exchange, divorce, estate, relocation)? That informs how much negotiation room exists.
- Schools are B-rated — typically a magnet for longer-tenancy family renters. What's the average tenant stay here, and is there a school-zone premium baked into asking?
- What's the average days-on-market for RENTAL listings here right now (not sales)? A rising rental-DOM trend means longer vacancies and softer asking-rent achievability than the comps imply.
- What's the recent tenant-quality profile in this submarket — average credit score on applications, eviction rate, late-payment / NSF rate, and stable-employment percentage? A property-management company in the area should have these aggregated.
- How much new for-sale + rental construction is in the pipeline within 1–3 miles? Heavy new supply typically softens prices + rents 12–24 months out; constrained supply supports both.
Investment metrics
- 1% rule
- 2.77% ✓
- Cap rate
- 24.28%
- Cash-on-cash
- 64.24%
- DSCR
- 3.86
- GRM
- 3.0
CMA / ARV
- ARV (on-the-fly)
- $88,800
- Comps found
- 2
Show comp detail 2 sales within ~0.75 mi
| Address | Dist | Beds/Ba | Sqft | Sold | Price | $/sf | Match |
|---|---|---|---|---|---|---|---|
| 80 Huntington St #114 | 0.09mi | 1/1.0 | 432 (-10%) | 11mo | $49,000 | $113 | 70 |
| 80 Huntington St #361 | 0.02mi | 1/1.0 | 432 (-10%) | 24mo | $80,000 | $185 | 62 |
Match score weights: distance 35% · size 25% · config 20% · recency 20%. Top-matched comps best support the ARV.
Projected returns pro-forma
-3.0% appreciation · 2.78% rent growth · sell at horizon
- IRR
- 63.1%
- Equity multiple
- 3.81×
- Total profit
- $70,747
- Equity at exit
- $13,404
- IRR
- 67.5%
- Equity multiple
- 7.75×
- Total profit
- $170,026
- Equity at exit
- $7,773
Cash invested: $25,172 (down + closing). Projections, not guarantees.
Landlord ↔ Tenant lean methodology
- Overall (STATE)
- 18 Strongly Tenant-Friendly
- State California
- 18 Strongly Tenant-Friendly · D+13
- County
- — inherits STATE
- City
- — inherits STATE
ZIP-level market 92648
- Rents YoY
- 2.8%
- Active inventory
- 137
- Price-to-rent
- 3.0×
Monthly cashflow live
- Estimated rent
- $2,492 medium interval (Pro) →
- Mortgage (P&I)
- −$471
- Tax est. 1.5%
- −$112 /mo · $1,348/yr
- Insurance
- −$37
- HOA
- −$0
- Vacancy / Maint / Mgmt
- −$523
- Net cashflow
- $1,348
Break-even live
Sensitivity live
| Price | -10% $1,410 | -5% $1,379 | +0% $1,348 | +5% $1,317 | +10% $1,285 |
|---|---|---|---|---|---|
| Rent | -10% $1,151 | -5% $1,249 | +0% $1,348 | +5% $1,446 | +10% $1,544 |
| Rate | -1.0pp $1,393 | -0.5pp $1,370 | base $1,348 | +0.5pp $1,324 | +1.0pp $1,301 |
UW: 25.0% down · 7.5% · 30yr · 1.5% tax · 5.0% vac · 8.0% maint · 8.0% mgmt
Financing live
Cash to close
- Down payment
- $22,475
- Closing costs
- $2,697
- Reserves months
- —
- Total cash needed
- —
Loan-product check · same deal, 3 products live
Conventional
25% down · 7.5% · 30yr
- Down + closing
- —
- Monthly P&I
- —
- Monthly cashflow
- —
- DSCR
- —
- Eligible?
- —
Personal DTI + credit; lowest rate.
DSCR
20% down · 8.5% · 30yr
- Down + closing
- —
- Monthly P&I
- —
- Monthly cashflow
- —
- DSCR
- —
- Eligible?
- —
No personal income docs; deal must DSCR.
Hard money
10% down · 12.0% · 12mo
- Down + closing
- —
- Monthly P&I
- —
- Monthly cashflow
- —
- DSCR
- —
- Eligible?
- —
Short-term bridge; refi at stabilization.
Listing history 15 events
-
2026-06-21days on market $89,900 Active 23 DOM
-
2026-06-18days on market $89,900 Active 20 DOM
-
2026-06-17days on market $89,900 Active 19 DOM
-
2026-06-16days on market $89,900 Active 18 DOM
-
2026-06-15days on market $89,900 Active 17 DOM
-
2026-06-13days on market $89,900 Active 15 DOM
-
2026-06-13days on market $89,900 Active 14 DOM
-
2026-06-09days on market $89,900 Active 11 DOM
-
2026-06-08days on market $89,900 Active 10 DOM
-
2026-06-07days on market $89,900 Active 9 DOM
-
2026-06-04days on market $89,900 Active 6 DOM
-
2026-06-03days on market $89,900 Active 5 DOM
-
2026-06-02days on market $89,900 Active 4 DOM
-
2026-06-01days on market $89,900 Active 3 DOM
-
2026-05-31days on market $89,900 Active 2 DOM
ⓘ Source: listings_history table (triggers on properties + properties_extension) + one-shot
backfill from property_details.listing_events for pre-trigger history.
Nearby sold comps map
Loading sold comps map…
Walkable amenities ~0.75 mi
Loading nearby amenities…
Taxation est. · year 1
- Rental income
- $29,907
- − Mortgage interest
- −$5,036
- − Property taxes
- −$1,348
- − Insurance
- −$450
- − Repairs & maintenance
- −$2,393
- − Management
- −$2,393
- − Depreciation
- −$2,615
- Taxable income
- $15,673
- Est. tax owed @ 24.0%
- −$3,761
- After-tax cash flow
- $12,409/yr
For passive investors: Depreciation is non-cash, so a rental often shows a tax loss while cash-flowing — sheltering income. Rental losses are passive: they offset passive income freely, and up to $25,000/yr can offset ordinary (W-2) income if you actively participate and your MAGI is under $100k (phasing out to $0 by $150k); unused losses carry forward. On sale, claimed depreciation is recaptured at up to 25%, and gains may owe capital-gains tax (a 1031 exchange can defer both). Figures are a year-1 estimate at your 24.0% rate — not tax advice; consult a CPA.
Schools (NCES district)
- District
- Huntington Beach Union High
- NCES district ID
- 0618060
- Math proficiency
- 65% ▲ 17.00%
- Reading proficiency
- 82% ▲ 8.00%
- Median HH income
- $78,159
- Composite
- 64.9/100
- National rank
- #511
- State rank
- #39 of 517 in CA
Livability — Huntington Beach
- Score
- 67/100
- State rank
- #306
- US rank
- #10298
Category grades
Schools grade is shown separately in the Schools card above.
Census & demographics
- Census place
- Huntington Beach, CA
- County
- Orange County · 3,096,323 people
- City population
- 194,835
- Metro
- Los Angeles-Long Beach-Anaheim, CA
- Population (ZIP)
- 45,827
- Household income
- $130,164
- Rent vs Own
- Severe rent burden
- 2957.0
Population outlook (Orange County) Hauer SSP2
- Today (2025)
- 3,477,456 people
- By 2030
- 3,613,117 · +3.9%
- By 2040
- 3,835,945 · +10.3%
- By 2050
- 3,968,736 · +14.1%
- By 2075
- 4,097,053 · +17.8%
- By 2100
- 3,903,633 · +12.3%
Race, ethnicity, and origin ACS 2023
- Neighborhood character
- Diverse neighborhood (Simpson 0.56)
- Race & ethnicity
- White 63% Hispanic / Latino 16% Two or more races 14% Asian 11%
- Hispanic origin (detail)
- Mexican 11%
- Common ancestry
- Slovak 3% Italian 3% Scotch-Irish 3%
- Foreign-born
- 14% · Canada, Vietnam, China
- Languages at home
- 80% English-only · Spanish 7% Vietnamese 3% Other Indo-European 3%
Political lean MEDSL · Orange
- 2024 margin
- Toss-up / Even · D 49.7% · R 47.1% · Other 3.2%
- 2008→2024 swing
- +5.2pp toward D · 2008: -2.6pp · 2024: 2.6pp
- All cycles
- 2024: D+2.6 2020: D+9.0 2016: D+7.7 2012: R+8.3 2008: R+2.6
Not yet ingested
- Civics
- —
Market trends
- HPI YoY
- ▼ -797.90%
- Current HPI
- 381.1587
- Rent YoY
- ▲ 2.78%
- Metro
- Los Angeles-Long Beach-Anaheim, CA
- State GDP YoY
- ▲ 3.21%
- F500 in state
- 116
Industry mix (Fortune 500 HQ in CA)
| Industry | F500 HQs | Revenue |
|---|---|---|
| Technology | 27 | $1,492B |
|
||
| Financial Services | 3 | $174B |
|
||
| Retail | 3 | $44B |
|
||
| Insurance | 3 | $26B |
|
||
| Media / Entertainment | 2 | $115B |
|
||
| Pharmaceuticals / Biotech | 2 | $62B |
|
||
Price history
+221.1% since first listed24 events — show timeline
- 2026-05-29 Listed $89,900 CRMLS
- 2025-08-15 Sold (MLS) $60,000 CRMLS
- 2025-08-08 Pending — CRMLS
- 2025-06-30 Price Changed $64,500 CRMLS
- 2025-06-30 Listed $64,500 CRMLS
- 2025-06-10 Listing Removed — CRMLS
- 2025-05-31 Price Changed $68,900 CRMLS
- 2025-05-15 Price Changed $70,499 CRMLS
- 2025-03-27 Price Changed $72,500 CRMLS
- 2025-01-30 Listed $74,900 CRMLS
- 2021-07-19 Listing Removed — CRMLS
- 2021-06-27 Price Changed $29,000 CRMLS
- 2021-06-09 Price Changed $34,000 CRMLS
- 2021-04-27 Listed $38,000 CRMLS
- 2021-01-12 Listing Removed — CRMLS
- 2020-12-02 Listed $39,500 CRMLS
- 2020-10-12 Listed $45,000 CRMLS
- 2019-04-04 Listing Removed — CRMLS
- 2018-12-27 Listed $39,900 CRMLS
- 2018-10-31 Listing Removed — CRMLS
- 2018-06-20 Listed $39,900 CRMLS
- 2008-10-24 Sold (MLS) $22,000 CRMLS
- 2008-09-27 Listing Removed — CRMLS
- 2008-08-28 Listed $28,000 CRMLS
Property tax history
-0.8%/yrLatest (2016): $25 · -3.8% YoY. Source: county tax records.
Cash-flow waterfall
monthlySold comps — $/sqft
last 12 mo · ≤1 miLoading sold comps…