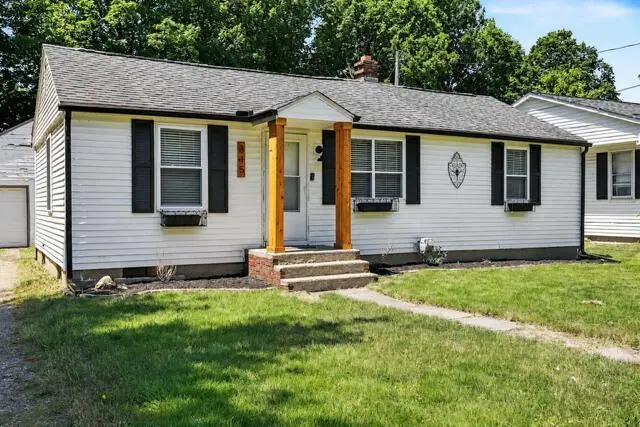
315 N Cedar St · Schoolcraft, MI
Flood risk 4/10 · Minor
- FEMA flood zone
- X (unshaded)
- Chance of flooding over 30 yrs
- 0.13%
- Est. flood insurance / yr
- $473 – $860
Fire risk 1/10 · Minimal
- Est. fire insurance / yr
- $784 – $1,456
Heat risk 2/10 · Minimal
- Hot days now (above 99°F)
- 7 days/yr
- Hot days in 30 yrs
- 16 days/yr
Wind risk 2/10 · Minimal
- Chance of severe wind over 30 yrs
- —
Air-quality risk 2/10 · Minimal
- Unhealthy air days now
- 1 days/yr
- Unhealthy air days in 30 yrs
- 2 days/yr
Risk factors via First Street. Map © Google.
Why this score? — see what drove the D+ grade
The composite is a weighted blend of 9 inputs, each scored 0–100. Each bar is that input's sub-score; the figure is the points it added to the 100-point composite (weight × sub-score).
- Cash flow +14.8/30.0
- ARV discount +9.4/15.0
- Schools +4.9/10.0
- DSCR +4.5/10.0
- Livability +4.0/5.0
- 1% rule +3.5/10.0
- Rent growth +2.5/5.0
- Condition / age +2.5/5.0
- Appreciation +0.0/10.0
$170,000
🖨 Deal sheet (PDF) 📄 Offer letter ✓ Due diligence
Listing remarks MLS
This is such a great, updated two-bedroom home in the Village of Schoolcraft. Updates include a new septic system, furnace and central air, flooring throughout the home, lighting, gutters on home, back door, replacement windows and more. As soon as you walk in, you'll notice the modern open layout with spacious living room and dining area, attractive luxury vinyl flooring, updated lighting and windows that bring lots of natural light into the home. The kitchen has ample cabinets and counter space and all stainless appliances stay with the home. The bedrooms are good-sized with nice closet space, newer ceiling fans, and pleasing paint colors. An updated full bath is large with newer vanity, sink, fixtures and ceramic tile floors. The basement includes laundry area with washer and dryer, freezer that stays with the home and plenty of space for storage, or workshop or gaming/play area. You'll love the expansive backyard and patio where you can entertain this summer or play in all seasons.
Key facts
- New furnace
- New septic system
- Updated flooring
Tags
Property features AI
Exterior
- Parking: Detached 2-car garage
- Utilities: Public water; Natural gas available and connected; Electricity available; Cable connected; High-speed internet available
- Home design: Ranch-style single family residence; Approximately 800 living area
- Construction: Built in 1945; Vinyl siding; Composition roof
- Exterior features: Shed(s); Paved road access
Interior
- Kitchen: Dishwasher; Range; Refrigerator
- Bedrooms: Primary bedroom; Second bedroom
- Bathrooms: 1 full bathroom
- Heating & cooling: Forced air heating; Has heating; Has cooling
- Interior features: Garage door opener; Replacement, insulated windows with window treatments; 5 total rooms; Partial basement
- Laundry & utility: Washer; Dryer; Laundry room
Neighborhood map
What this means for you Summary
Snapshot
- This is a 2-bed/1.0-bath single-family listed at $170k.
Deal economics
- At list price, monthly cash flow is $45 ($544/yr) — positive.
- The deal already cash-flows at list — no discount required.
- To meet the 1% rule (rent ≥ 1% of price), the offer needs to be $144k (15.3% below list).
- Recommended offer: $144k (15.3% below list) — sets the bar for 1% rule.
- Cap rate 6.6% vs local median 2.8% in Schoolcraft — top-decile yield for the area; either an underpriced asset or a hidden risk that comps aren't pricing in. Stress-test before assuming the spread holds.
Location & tenants
- Location reads 81/100 on livability (#61 in MI, #1,323 nationally) — a professional / high-income tenant draw. Strengths: cost of living A+, housing A+, health & safety A+; Watch: amenities F, commute F.
- Schoolcraft Community Schools (suburban): math 55% / reading 56% proficiency, ranked #61 of 540 in MI (top 11%) — acceptable for families but not a draw, mixed tenant base, ~2y average lease; only 18% free/reduced lunch — higher-income household profile.
- Zoned schools: Schoolcraft Elementary School (math 67% / reading 57%, grade B, #160 of 1,397 statewide, top 13%, 335 students, 27% FRL); Schoolcraft Middle School (math 52% / reading 54%, grade C+, #90 of 493 statewide, top 19%, 237 students, 27% FRL); Schoolcraft High School (math 44% / reading 64%, grade C-, #109 of 713 statewide, top 17%, 499 students, 30% FRL).
- Market conditions: 56 active listings in the ZIP; 339 units permitted in Kalamazoo County in 2024 (22 in 5+ unit buildings).
Forward outlook
- Local home prices are declining (-3.0%/yr); year-one equity from $1k of loan paydown is wiped out by about $5k of value loss. Plan a longer hold.
- Kalamazoo County population projected at +18% by 2050 — long-run rental-demand tailwind backs the buy-and-hold thesis.
Negotiation context
- Only 11 days on market — expect competitive offers; lowballing is unlikely to land.
- 10 sale attempts since 23y ago with the ask held roughly flat each time — persistent listings suggest the price (not the market) is what's stuck; bring a comps-based counter.
- Current owner paid $67k; list at $170k implies a 154% gain — meaningful room to come down on a strong offer.
Risks & watch-outs
- Watch-outs: built in 1945 — expect roof / HVAC / electrical / plumbing capex.
Questions for the listing agent
- Built in 1945 — when were the roof, HVAC, electrical panel, plumbing, and water heater last replaced?
- Is there a deadline driving the sale (1031 exchange, divorce, estate, relocation)? That informs how much negotiation room exists.
- Schools are A-rated — typically a magnet for longer-tenancy family renters. What's the average tenant stay here, and is there a school-zone premium baked into asking?
- The area grade is low — what's the realistic commute time and amenity access for the typical tenant pool here? Any planned neighborhood developments (good or bad) we should know about?
- What's the average days-on-market for RENTAL listings here right now (not sales)? A rising rental-DOM trend means longer vacancies and softer asking-rent achievability than the comps imply.
- What's the recent tenant-quality profile in this submarket — average credit score on applications, eviction rate, late-payment / NSF rate, and stable-employment percentage? A property-management company in the area should have these aggregated.
- How much new for-sale + rental construction is in the pipeline within 1–3 miles? Heavy new supply typically softens prices + rents 12–24 months out; constrained supply supports both.
Investment metrics
- 1% rule
- 0.85% ✗
- Cap rate
- 6.61%
- Cash-on-cash
- 1.14%
- DSCR
- 1.05
- GRM
- 9.8
CMA / ARV
- ARV (on-the-fly)
- $177,600
- Comps found
- 1
Show comp detail 1 sale within ~0.75 mi
| Address | Dist | Beds/Ba | Sqft | Sold | Price | $/sf | Match |
|---|---|---|---|---|---|---|---|
| 130 South St | 0.52mi | 2/1.0 | 844 (+6%) | 2mo | $187,000 | $222 | 65 |
Match score weights: distance 35% · size 25% · config 20% · recency 20%. Top-matched comps best support the ARV.
Projected returns pro-forma
-3.0% appreciation · 3.0% rent growth · sell at horizon
- IRR
- -14.5%
- Equity multiple
- 0.48×
- Total profit
- $-24,691
- Equity at exit
- $25,348
- IRR
- -5.8%
- Equity multiple
- 0.62×
- Total profit
- $-17,903
- Equity at exit
- $14,698
Cash invested: $47,600 (down + closing). Projections, not guarantees.
Landlord ↔ Tenant lean methodology
- Overall (STATE)
- 62 Landlord-Friendly
- State Michigan
- 62 Landlord-Friendly · EVEN
- County
- — inherits STATE
- City
- — inherits STATE
ZIP-level market 49087
- Home prices YoY
- -27.0%
- Active inventory
- 56
- Price-to-rent
- 9.8×
Monthly cashflow live
- Estimated rent
- $1,441 medium interval (Pro) →
- Mortgage (P&I)
- −$891
- Tax from tax record
- −$130 /mo · $1,565/yr
- Insurance
- −$71
- HOA
- −$0
- Vacancy / Maint / Mgmt
- −$303
- Net cashflow
- $45
Break-even live
Sensitivity live
| Price | -10% $142 | -5% $93 | +0% $45 | +5% $-3 | +10% $-51 |
|---|---|---|---|---|---|
| Rent | -10% $-69 | -5% $-12 | +0% $45 | +5% $102 | +10% $159 |
| Rate | -1.0pp $131 | -0.5pp $89 | base $45 | +0.5pp $1 | +1.0pp $-44 |
UW: 25.0% down · 7.5% · 30yr · 1.5% tax · 5.0% vac · 8.0% maint · 8.0% mgmt
Financing live
Cash to close
- Down payment
- $42,500
- Closing costs
- $5,100
- Reserves months
- —
- Total cash needed
- —
Loan-product check · same deal, 3 products live
Conventional
25% down · 7.5% · 30yr
- Down + closing
- —
- Monthly P&I
- —
- Monthly cashflow
- —
- DSCR
- —
- Eligible?
- —
Personal DTI + credit; lowest rate.
DSCR
20% down · 8.5% · 30yr
- Down + closing
- —
- Monthly P&I
- —
- Monthly cashflow
- —
- DSCR
- —
- Eligible?
- —
No personal income docs; deal must DSCR.
Hard money
10% down · 12.0% · 12mo
- Down + closing
- —
- Monthly P&I
- —
- Monthly cashflow
- —
- DSCR
- —
- Eligible?
- —
Short-term bridge; refi at stabilization.
Listing history 9 events
-
2026-06-21days on market $170,000 Active 11 DOM
-
2026-06-18days on market $170,000 Active 8 DOM
-
2026-06-18status $170,000 Active 7 DOM
-
2026-06-13statusdays on market $170,000 Pending 7 DOM
-
2026-06-10days on market $170,000 Active 6 DOM
-
2026-06-09days on market $170,000 Active 5 DOM
-
2026-06-08days on market $170,000 Active 4 DOM
-
2026-06-07remarks 699-char remark
-
2026-06-07$170,000 Active 3 DOM
ⓘ Source: listings_history table (triggers on properties + properties_extension) + one-shot
backfill from property_details.listing_events for pre-trigger history.
Tax reassessment forecast MI · Partial reset (capped growth)
- Current annual tax
- $1,565 · $130/mo
- Projected year-2 tax
- $2,092 · $174/mo
- Expected delta
- +$526/yr (+$44/mo · 33.6%)
ⓘ Screening estimate from a state-policy table — verify with the county assessor before closing.
Climate risk First Street
- Flood 4/10 Moderate FEMA zone X (unshaded) · 13% chance over 30 yrs
- Wildfire 1/10 Low
- Heat 2/10 Low 7 d/yr ≥99°F today · 16 d/yr by 30 yrs out
- Wind 2/10 Low
- Air quality 2/10 Low 1 unhealthy d/yr today · 2 by 30 yrs out
Nearby sold comps map
Loading sold comps map…
Walkable amenities ~0.75 mi
Loading nearby amenities…
Taxation est. · year 1
- Rental income
- $17,287
- − Mortgage interest
- −$9,523
- − Property taxes
- −$1,565
- − Insurance
- −$850
- − Repairs & maintenance
- −$1,383
- − Management
- −$1,383
- − Depreciation
- −$4,945
- Taxable loss
- −$2,362
- Est. tax savings @ 24.0%
- +$567
- After-tax cash flow
- $1,110/yr
For passive investors: Depreciation is non-cash, so a rental often shows a tax loss while cash-flowing — sheltering income. Rental losses are passive: they offset passive income freely, and up to $25,000/yr can offset ordinary (W-2) income if you actively participate and your MAGI is under $100k (phasing out to $0 by $150k); unused losses carry forward. On sale, claimed depreciation is recaptured at up to 25%, and gains may owe capital-gains tax (a 1031 exchange can defer both). Figures are a year-1 estimate at your 24.0% rate — not tax advice; consult a CPA.
Schools (NCES district)
- District
- Schoolcraft Community Schools
- NCES district ID
- 2631020
- Math proficiency
- 55% ▼ -4.00%
- Reading proficiency
- 56% ▼ -10.00%
- Median HH income
- $66,019
- Composite
- 48.88/100
- National rank
- #2082
- State rank
- #61 of 540 in MI
Livability — Schoolcraft
- Score
- 81/100
- State rank
- #61
- US rank
- #1323
Category grades
Schools grade is shown separately in the Schools card above.
Census & demographics
- Census place
- Schoolcraft, MI
- Population (ZIP)
- 6,074
Population outlook (Kalamazoo County) Hauer SSP2
- Today (2025)
- 280,982 people
- By 2030
- 292,068 · +3.9%
- By 2040
- 312,191 · +11.1%
- By 2050
- 331,196 · +17.9%
- By 2075
- 379,021 · +34.9%
- By 2100
- 396,579 · +41.1%
Race, ethnicity, and origin ACS 2023
- Neighborhood character
- Predominantly White (94%)
- Race & ethnicity
- White 94% Two or more races 4% Hispanic / Latino 1% Asian 1%
- Common ancestry
- Iranian 10% Italian 3% Lithuanian 3%
- Foreign-born
- 2% · Canada, Vietnam
- Languages at home
- 96% English-only · Other Indo-European 2% Russian/Polish/Slavic 1% Spanish 1%
Political lean MEDSL · Kalamazoo
- 2024 margin
- D (+17.7) · D 58.0% · R 40.3% · Other 1.7%
- 2008→2024 swing
- -1.8pp toward R · 2008: 19.5pp · 2024: 17.7pp
- All cycles
- 2024: D+17.7 2020: D+18.7 2016: D+12.8 2012: D+13.3 2008: D+19.5
Not yet ingested
- Civics
- —
Market trends
- HPI YoY
- ▼ -86.53%
- Current HPI
- 234.1049
- Rent YoY
- —
- Metro
- —
- State GDP YoY
- ▲ 1.37%
- F500 in state
- 28
Industry mix (Fortune 500 HQ in MI)
| Industry | F500 HQs | Revenue |
|---|---|---|
| Automotive Parts | 3 | $48B |
|
||
| Automotive | 2 | $372B |
|
||
| Chemicals | 1 | $45B |
|
||
| Automotive Retail | 1 | $29B |
|
||
| Healthcare / Medical Devices | 1 | $23B |
|
||
| Automotive Technology | 1 | $20B |
|
||
Price history
+240.7% since first listed21 events — show timeline
- 2026-06-04 Listed $170,000 REALCOMP
- 2026-06-04 Listed $170,000 MiRealSource-MiMLS
- 2026-06-04 Listed $170,000 SW Michigan MLS
- 2016-07-19 Sold (Public Records) $66,900 Public Records
- 2016-07-08 Listing Removed — SW Michigan MLS
- 2016-07-07 Sold (MLS) $66,900 SW Michigan MLS
- 2016-07-07 Sold (MLS) $66,900 REALCOMP
- 2016-05-11 Pending — SW Michigan MLS
- 2016-05-03 Relisted — SW Michigan MLS
- 2016-04-14 Pending — SW Michigan MLS
- 2016-04-08 Listed $69,900 SW Michigan MLS
- 2016-04-08 Listed $69,900 REALCOMP
- 2009-06-12 Sold (Public Records) $55,000 Public Records
- 2009-06-04 Sold (MLS) $55,000 REALCOMP
- 2009-06-04 Sold (MLS) $55,000 SW Michigan MLS
- 2009-04-13 Listed $59,900 REALCOMP
- 2009-04-13 Listed $59,900 SW Michigan MLS
- 2003-12-11 Sold (MLS) $49,900 REALCOMP
- 2003-12-11 Sold (MLS) $49,900 SW Michigan MLS
- 2003-11-11 Listed $49,900 REALCOMP
- 2003-11-11 Listed $49,900 SW Michigan MLS
Property tax history
+9.6%/yrLatest (2025): $1,565 · +2.9% YoY. Source: county tax records.
Cash-flow waterfall
monthlySold comps — $/sqft
last 12 mo · ≤1 miLoading sold comps…