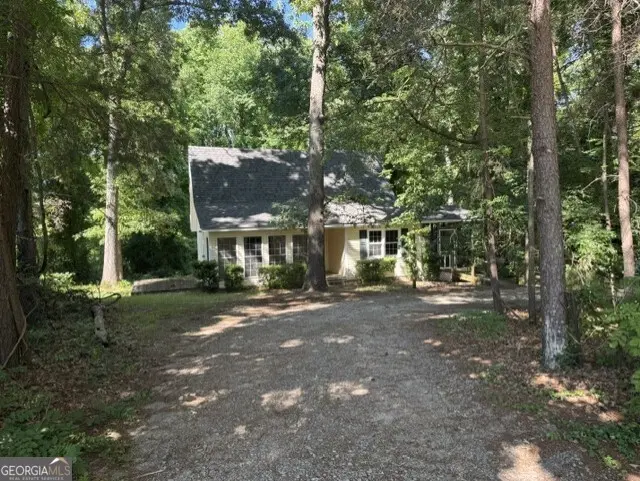
182 Arthur St · Hartwell, GA
Flood risk 6/10 · Moderate
- FEMA flood zone
- X (unshaded)
- Chance of flooding over 30 yrs
- 0.69%
- Est. flood insurance / yr
- $507 – $1,088
Fire risk 2/10 · Minimal
- Est. fire insurance / yr
- $963 – $1,789
Heat risk 5/10 · Moderate
- Hot days now (above 104°F)
- 7 days/yr
- Hot days in 30 yrs
- 17 days/yr
Wind risk 4/10 · Minor
- Chance of severe wind over 30 yrs
- 10.0%
Air-quality risk 3/10 · Minor
- Unhealthy air days now
- 2 days/yr
- Unhealthy air days in 30 yrs
- 4 days/yr
Risk factors via First Street. Map © Google.
Why this score? — see what drove the D grade
The composite is a weighted blend of 9 inputs, each scored 0–100. Each bar is that input's sub-score; the figure is the points it added to the 100-point composite (weight × sub-score).
- Cash flow +17.9/30.0
- DSCR +5.6/10.0
- ARV discount +4.3/15.0
- 1% rule +3.7/10.0
- Livability +3.1/5.0
- Schools +2.7/10.0
- Rent growth +2.5/5.0
- Condition / age +2.5/5.0
- Appreciation +0.0/10.0
$165,000
🖨 Deal sheet (PDF) 📄 Offer letter ✓ Due diligence
Listing remarks
Check out this fantastic opportunity. Great cottage in an awesome location. Like a doll house. GOT TO SEE IT. Estate owned and priced to sell. Local church owns the property to the right and behind the house. Sold As Is.
Key facts
- 0.5 acre lot
- 3 parking spots
- Built 1981
Property features AI
Finance
- Other: Estate-owned listing
- HOA & community: No HOA
Exterior
- Parking: Off-street parking for 3 vehicles
- Utilities: Public water; Public sewer; 220 volt electric; Cable available, high-speed internet available, phone available, sewer connected, water available, electricity available
- Home design: Single-family house; Two levels; Designed as residential single family residence; Property listed as fixer
- Construction: Built in 1981; Vinyl siding; Composition roof; Block foundation
- Exterior features: Deck with screened porch; Grassed yard; City lot, sloped
Interior
- Kitchen: Breakfast area; Refrigerator
- Bedrooms: 2 bedrooms total, 1 bedroom on the main level
- Flooring: Laminate; Stone; Tile
- Bathrooms: 1 full bathroom (main level)
- Heating & cooling: Central heating (electric, forced air, heat pump); Central air with ceiling fans (electric, heat pump)
- Interior features: Beamed ceilings; High ceilings; Tile bath; Accessible approach with ramp, accessible doors and entrance, accessible full bath and kitchen
- Laundry & utility: Washer and dryer; Electric water heater; Laundry room
Neighborhood map
What this means for you Summary
Snapshot
- This is a 2-bed/1.0-bath single-family listed at $165k.
Deal economics
- At list price, monthly cash flow is $140 ($2k/yr) — positive.
- The deal already cash-flows at list — no discount required.
- To meet the 1% rule (rent ≥ 1% of price), the offer needs to be $143k (13.5% below list).
- Recommended offer: $143k (13.5% below list) — sets the bar for 1% rule.
- Cap rate 7.3% vs local median 3.4% in Hartwell — top-decile yield for the area; either an underpriced asset or a hidden risk that comps aren't pricing in. Stress-test before assuming the spread holds.
Location & tenants
- Location reads 61/100 on livability (#342 in GA) — a middle-class / working-renter tenant base. Strengths: cost of living A+; Watch: housing C-, health & safety C-, crime D.
- Hart County (town): math 32% / reading 33% proficiency, ranked #82 of 174 in GA (top 47%) — families likely to look elsewhere, expect single-tenant / working-renter base with shorter leases.
- Zoned schools: Hartwell Elementary School (math 26% / reading 29%, grade F, #682 of 1,228 statewide, top 56%, 559 students, 70% FRL); Hart County Middle School (math 34% / reading 37%, grade F, #185 of 470 statewide, top 40%, 816 students, 60% FRL); Hart County High School (math 18% / reading 17%, grade F, #264 of 424 statewide, top 63%, 1,077 students, 49% FRL).
- Market conditions: 281 active listings in the ZIP; 11 comparable units currently listed for rent nearby; rentals leasing fast (median 14d on market — plan ~1-2 weeks tenant-placement turnaround); 170 units permitted in Hart County in 2024 (8 in 5+ unit buildings).
Forward outlook
- Local home prices are declining (-3.0%/yr); year-one equity from $1k of loan paydown is wiped out by about $5k of value loss. Plan a longer hold.
- Hart County population projected to shrink 4% by 2050 — rents likely to lag national; underwrite the cash flow, not the appreciation.
Negotiation context
- Only 5 days on market — expect competitive offers; lowballing is unlikely to land.
- 2 sale attempts with the ask held roughly flat each time — persistent listings suggest the price (not the market) is what's stuck; bring a comps-based counter.
Risks & watch-outs
- Climate carrying-cost: major flood risk; extreme-heat days projected 7→17/yr by 2055 (HVAC capex compounding) — expect insurance premiums to compound above CPI over the hold.
Questions for the listing agent
- Is there a deadline driving the sale (1031 exchange, divorce, estate, relocation)? That informs how much negotiation room exists.
- Schools are D-rated, which usually means shorter tenancies and higher turnover. Who's the typical renter profile here, and what's been the actual vacancy rate?
- Crime grade is D in this area — have there been break-ins, vandalism, or insurance claims at this property in the last 3 years? What carrier currently insures it and at what premium?
- The area grade is low — what's the realistic commute time and amenity access for the typical tenant pool here? Any planned neighborhood developments (good or bad) we should know about?
- What's the average days-on-market for RENTAL listings here right now (not sales)? A rising rental-DOM trend means longer vacancies and softer asking-rent achievability than the comps imply.
- What's the recent tenant-quality profile in this submarket — average credit score on applications, eviction rate, late-payment / NSF rate, and stable-employment percentage? A property-management company in the area should have these aggregated.
- How much new for-sale + rental construction is in the pipeline within 1–3 miles? Heavy new supply typically softens prices + rents 12–24 months out; constrained supply supports both.
Investment metrics
- 1% rule
- 0.87% ✗
- Cap rate
- 7.31%
- Cash-on-cash
- 3.62%
- DSCR
- 1.16
- GRM
- 9.6
CMA / ARV
- ARV (median comp)
- $154,069
- List price
- $165,000
- Delta
- 7.09%
- Verdict
- FAIR
- Comps
- 20 within 1.0 mi
Show comp detail 12 sales within ~0.75 mi
| Address | Dist | Beds/Ba | Sqft | Sold | Price | $/sf | Match |
|---|---|---|---|---|---|---|---|
| 182 Arthur St | 0.00mi | 2/1.0 | 1,190 (0%) | 0mo | $173,000 | $145 | 100 |
| 180 Liberty Cir | 0.06mi | 2/1.0 | 1,170 (-2%) | 1mo | $160,000 | $137 | 94 |
| 225 S Webb St | 0.15mi | 2/2.0 | 1,072 (-10%) | 1mo | $125,000 | $117 | 72 |
| 510 S Jackson St | 0.22mi | 3/1.0 (+1) | 1,276 (+7%) | 2mo | $145,000 | $114 | 71 |
| 252 Arthur St | 0.07mi | 2/2.0 | 1,311 (+10%) | 11mo | $285,000 | $217 | 66 |
| 90 David St | 0.38mi | 3/1.5 (+1) | 1,254 (+5%) | 1mo | $100,980 | $81 | 65 |
| 150 Dogwood St | 0.47mi | 3/2.0 (+1) | 1,176 (-1%) | 13mo | $200,000 | $170 | 56 |
| 325 S Jackson St | 0.13mi | 3/2.0 (+1) | 1,364 (+15%) | 10mo | $129,000 | $95 | 53 |
| 552 Opal Street Ext | 0.52mi | 3/2.0 (+1) | 1,315 (+10%) | 0mo | $207,500 | $158 | 49 |
| 62 Opal St | 0.69mi | 3/1.0 (+1) | 1,262 (+6%) | 7mo | $215,000 | $170 | 47 |
| 44 Kelsey Dr | 0.73mi | 3/1.0 (+1) | 1,112 (-7%) | 10mo | $184,900 | $166 | 41 |
| 88 Thornton Dr | 0.68mi | 3/1.5 (+1) | 1,056 (-11%) | 5mo | $95,000 | $90 | 39 |
Match score weights: distance 35% · size 25% · config 20% · recency 20%. Top-matched comps best support the ARV.
Projected returns pro-forma
-3.0% appreciation · 3.0% rent growth · sell at horizon
- IRR
- -10.7%
- Equity multiple
- 0.61×
- Total profit
- $-17,922
- Equity at exit
- $24,602
- IRR
- -1.4%
- Equity multiple
- 0.90×
- Total profit
- $-4,454
- Equity at exit
- $14,266
Cash invested: $46,200 (down + closing). Projections, not guarantees.
Landlord ↔ Tenant lean methodology
- Overall (STATE)
- 90 Strongly Landlord-Friendly
- State Georgia
- 90 Strongly Landlord-Friendly · R+3
- County
- — inherits STATE
- City
- — inherits STATE
ZIP-level market 30643
- Home prices YoY
- -16.7%
- Active inventory
- 281
- Price-to-rent
- 9.6×
Monthly cashflow live
- Estimated rent
- $1,428 high interval (Pro) →
- Mortgage (P&I)
- −$865
- Tax from tax record
- −$54 /mo · $652/yr
- Insurance
- −$69
- HOA
- −$0
- Vacancy / Maint / Mgmt
- −$300
- Net cashflow
- $140
Break-even live
Sensitivity live
| Price | -10% $233 | -5% $186 | +0% $140 | +5% $93 | +10% $46 |
|---|---|---|---|---|---|
| Rent | -10% $27 | -5% $83 | +0% $140 | +5% $196 | +10% $252 |
| Rate | -1.0pp $223 | -0.5pp $182 | base $140 | +0.5pp $97 | +1.0pp $53 |
UW: 25.0% down · 7.5% · 30yr · 1.5% tax · 5.0% vac · 8.0% maint · 8.0% mgmt
Financing live
Cash to close
- Down payment
- $41,250
- Closing costs
- $4,950
- Reserves months
- —
- Total cash needed
- —
Loan-product check · same deal, 3 products live
Conventional
25% down · 7.5% · 30yr
- Down + closing
- —
- Monthly P&I
- —
- Monthly cashflow
- —
- DSCR
- —
- Eligible?
- —
Personal DTI + credit; lowest rate.
DSCR
20% down · 8.5% · 30yr
- Down + closing
- —
- Monthly P&I
- —
- Monthly cashflow
- —
- DSCR
- —
- Eligible?
- —
No personal income docs; deal must DSCR.
Hard money
10% down · 12.0% · 12mo
- Down + closing
- —
- Monthly P&I
- —
- Monthly cashflow
- —
- DSCR
- —
- Eligible?
- —
Short-term bridge; refi at stabilization.
Rent comps 11 comps
| Address | Beds | Baths | Sqft | Rent | $/sqft | DOM | Units | Dist |
|---|---|---|---|---|---|---|---|---|
| 34 Depot St Unit 11 Hartwell, GA | 1.0 | 1.0 | 832 | $1,500 | $1.80 | 13d | 1 | 0.41mi |
| 34 Depot St Unit 11 Hartwell, GA | 1.0 | 1.0 | 870 | $1,500 | $1.72 | 23d | 1 | 0.41mi |
| 186 Maret St Hartwell, GA | 3.0 | 2.0 | 1200 | $1,500 | $1.25 | 45d | 1 | 0.42mi |
| 291 W Johnson St Unit 401 Hartwell, GA | 2.0 | 1.5 | 900 | $1,200 | $1.33 | 23d | 1 | 0.45mi |
| 249 N Carter St Hartwell, GA | 2.0 | 1.0 | 829 | $1,400 | $1.69 | 5d | 1 | 0.68mi |
| 250 N Forest Ave Hartwell, GA | 2.0 | 2.0 | 1092 | $1,450 | $1.33 | 13d | 1 | 0.69mi |
| 249 N Carter St Unit C Hartwell, GA | 2.0 | 1.0 | 829 | $1,400 | $1.69 | 13d | 1 | 0.70mi |
| 125 Cayuga St Unit A Hartwell, GA | 2.0 | 2.0 | 900 | $1,350 | $1.50 | 13d | 1 | 0.88mi |
| 188 Vickery St Unit B Hartwell, GA | 2.0 | 2.0 | 900 | $1,350 | $1.50 | 5d | 1 | 0.89mi |
| 135 Fairview Ave Hartwell, GA | 2.0 | 1.0 | 996 | $1,200 | $1.20 | 13d | 1 | 1.17mi |
| 234 Bowers Estates Rd Hartwell, GA | 3.0 | 3.0 | 1500 | $1,850 | $1.23 | 45d | 1 | 1.20mi |
Listing history 2 events
-
2026-05-18status Under Contract 220-char remark
-
2026-05-11$165,000 New 220-char remark
ⓘ Source: listings_history table (triggers on properties + properties_extension) + one-shot
backfill from property_details.listing_events for pre-trigger history.
Tax reassessment forecast GA · Resets to sale price
- Current annual tax
- $652 · $54/mo
- Projected year-2 tax
- $1,518 · $126/mo
- Expected delta
- +$866/yr (+$72/mo · 132.9%)
ⓘ Screening estimate from a state-policy table — verify with the county assessor before closing.
Climate risk First Street
- Flood 6/10 Major FEMA zone X (unshaded) · 69% chance over 30 yrs
- Wildfire 2/10 Low
- Heat 5/10 Major 7 d/yr ≥104°F today · 17 d/yr by 30 yrs out
- Wind 4/10 Moderate 10% chance of damaging wind over 30 yrs
- Air quality 3/10 Moderate 2 unhealthy d/yr today · 4 by 30 yrs out
Nearby sold comps map
Loading sold comps map…
Walkable amenities ~0.75 mi
Loading nearby amenities…
Taxation est. · year 1
- Rental income
- $17,133
- − Mortgage interest
- −$9,243
- − Property taxes
- −$652
- − Insurance
- −$825
- − Repairs & maintenance
- −$1,371
- − Management
- −$1,371
- − Depreciation
- −$4,800
- Taxable loss
- −$1,128
- Est. tax savings @ 24.0%
- +$271
- After-tax cash flow
- $1,945/yr
For passive investors: Depreciation is non-cash, so a rental often shows a tax loss while cash-flowing — sheltering income. Rental losses are passive: they offset passive income freely, and up to $25,000/yr can offset ordinary (W-2) income if you actively participate and your MAGI is under $100k (phasing out to $0 by $150k); unused losses carry forward. On sale, claimed depreciation is recaptured at up to 25%, and gains may owe capital-gains tax (a 1031 exchange can defer both). Figures are a year-1 estimate at your 24.0% rate — not tax advice; consult a CPA.
Schools (NCES district)
- District
- Hart County
- NCES district ID
- 1302730
- Math proficiency
- 32% ▼ -6.00%
- Reading proficiency
- 33% ▼ -6.00%
- Median HH income
- $37,494
- Composite
- 27.08/100
- National rank
- #7047
- State rank
- #82 of 174 in GA
Livability — Hartwell
- Score
- 61/100
- State rank
- #342
- US rank
- #17731
Category grades
Schools grade is shown separately in the Schools card above.
Census & demographics
- Census place
- Hartwell, GA
- Population (ZIP)
- 16,520
Population outlook (Hart County) Hauer SSP2
- Today (2025)
- 25,855 people
- By 2030
- 25,887 · +0.1%
- By 2040
- 25,627 · -0.9%
- By 2050
- 24,939 · -3.5%
- By 2075
- 23,150 · -10.5%
- By 2100
- 19,492 · -24.6%
Race, ethnicity, and origin ACS 2023
- Neighborhood character
- Predominantly White (71%)
- Race & ethnicity
- White 71% Black 22% Two or more races 6% Hispanic / Latino 1%
- Common ancestry
- Slovak 2% Lithuanian 2% Romanian 2%
- Foreign-born
- 1% · Canada
- Languages at home
- 98% English-only · Spanish 1%
Political lean MEDSL · Hart
- 2024 margin
- Solid R (+54.8) · D 22.4% · R 77.2%
- 2008→2024 swing
- -23.1pp toward R · 2008: -31.7pp · 2024: -54.8pp
- All cycles
- 2024: R+54.8 2020: R+49.6 2016: R+46.7 2012: R+38.4 2008: R+31.7
Not yet ingested
- Civics
- —
Market trends
- HPI YoY
- ▼ -59.98%
- Current HPI
- 299.7363
- Rent YoY
- —
- Metro
- —
- State GDP YoY
- ▲ 2.66%
- F500 in state
- 28
Industry mix (Fortune 500 HQ in GA)
| Industry | F500 HQs | Revenue |
|---|---|---|
| Paper / Packaging | 2 | $29B |
|
||
| Retail | 1 | $160B |
|
||
| Transportation / Logistics | 1 | $91B |
|
||
| Airlines | 1 | $62B |
|
||
| Consumer Goods | 1 | $47B |
|
||
| Utilities | 1 | $25B |
|
||
Price history
4 events — show timeline
- 2026-05-19 Pending — GAMLS
- 2026-05-19 Relisted — GAMLS
- 2026-05-18 Pending — GAMLS
- 2026-05-11 Listed $165,000 GAMLS
Property tax history
+0.2%/yrLatest (2025): $652 · -3.9% YoY. Source: county tax records.
Cash-flow waterfall
monthlySold comps — $/sqft
last 12 mo · ≤1 miLoading sold comps…