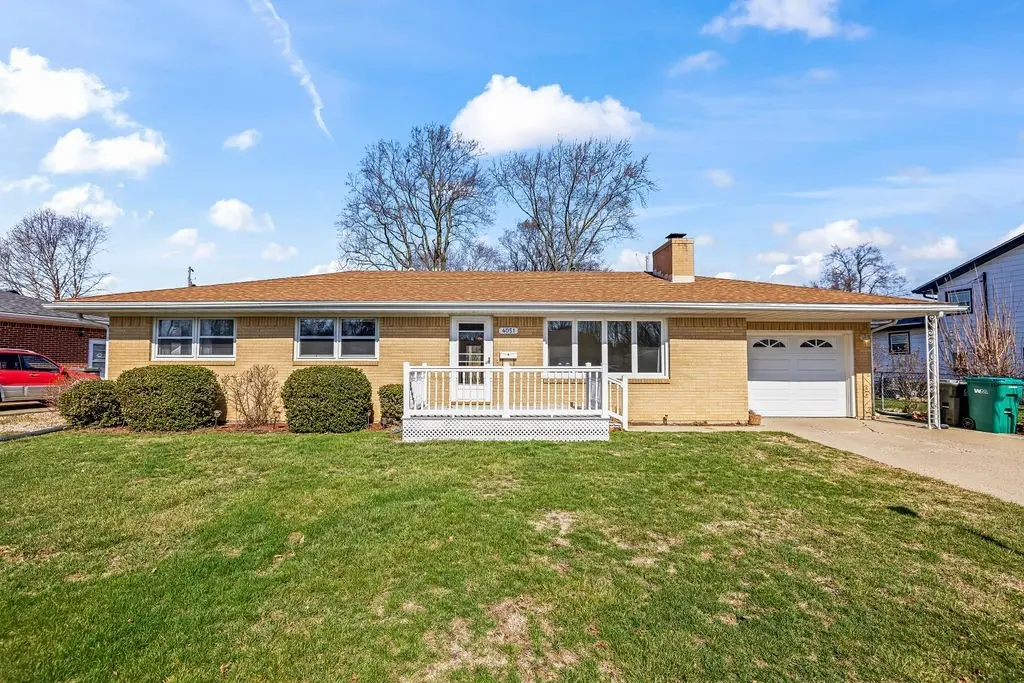
4051 Sheffield Dr · Decatur, IL
Flood risk 1/10 · Minimal
- FEMA flood zone
- X (unshaded)
- Chance of flooding over 30 yrs
- 0.0%
- Est. flood insurance / yr
- $473 – $860
Fire risk 1/10 · Minimal
- Est. fire insurance / yr
- $804 – $1,492
Heat risk 3/10 · Minor
- Hot days now (above 105°F)
- 7 days/yr
- Hot days in 30 yrs
- 19 days/yr
Wind risk 2/10 · Minimal
- Chance of severe wind over 30 yrs
- 1.0%
Air-quality risk 2/10 · Minimal
- Unhealthy air days now
- 1 days/yr
- Unhealthy air days in 30 yrs
- 1 days/yr
Risk factors via First Street. Map © Google.
Why this score? — see what drove the C- grade
The composite is a weighted blend of 9 inputs, each scored 0–100. Each bar is that input's sub-score; the figure is the points it added to the 100-point composite (weight × sub-score).
- Cash flow +16.6/30.0
- ARV discount +14.3/15.0
- DSCR +5.1/10.0
- 1% rule +4.5/10.0
- Appreciation +3.9/10.0
- Livability +3.0/5.0
- Rent growth +2.5/5.0
- Condition / age +2.5/5.0
- Schools +0.4/10.0
$140,000
🖨 Deal sheet (PDF) 📄 Offer letter ✓ Due diligence
Listing remarks MLS
Move right in to this well maintained all brick ranch located on Decatur’s desirable north end! As you step inside, you’ll immediately notice the living room filled with natural light, creating a bright and welcoming space to relax or entertain. The kitchen offers plenty of cabinet storage along with laminate countertops and an updated backsplash, providing both functionality and style. Off the kitchen is the dining room space with french doors that lead to the fenced in backyard. The main level features three comfortable bedrooms, all with hardwood flooring, along with a full bathroom that was fully remodeled. Downstairs, the basement offers a spacious family room ready for your finishing touches, plus an additional full bathroom that, with a little TLC, has great potential to be a fantastic extra space. This solid north end home offers space, updates, and great potential!
Key facts
- Hardwood flooring
- All brick ranch
- Fenced in backyard
Tags
Neighborhood map
What this means for you Summary
Snapshot
- This is a 3-bed/2.0-bath single-family listed at $140k.
Deal economics
- At list price, monthly cash flow is $84 ($1k/yr) — positive.
- The deal already cash-flows at list — no discount required.
- To meet the 1% rule (rent ≥ 1% of price), the offer needs to be $133k (5.3% below list).
- Recommended offer: $127k (9.0% below list) — sets the bar for market timing.
Location & tenants
- Location reads 59/100 on livability (#1,076 in IL) — a working-class tenant base; expect higher turnover. Strengths: cost of living A+, housing A+; Watch: schools F, crime F, amenities F.
- Decatur SD 61 (urban): math 3% / reading 6% proficiency, ranked #605 of 620 in IL (top 98%) — low school quality limits family demand, transient renter base, plan for 1-2y turnover; 73% free/reduced lunch — lower-income household profile, screen leases tightly.
- Market conditions: 135 active listings in the ZIP; 63 units permitted in Macon County in 2024 (0 in 5+ unit buildings).
- This rent runs 32% of the median local income ($49k/yr) — at the standard rent-burdened threshold; future hikes will face affordability resistance.
Forward outlook
- Local home prices are declining (-2.2%/yr); year-one equity from $968 of loan paydown is wiped out by about $3k of value loss. Plan a longer hold.
- Macon County population projected at -24% by 2050 — secular population decline; favor cash flow + early exit over multi-decade hold.
Negotiation context
- It's been on market 94 days — a 9% lower offer ($127k) is reasonable based on typical stale-listing flexibility.
- Current owner paid $92k; list at $140k implies a 52% gain — meaningful room to come down on a strong offer.
Questions for the listing agent
- It's been on market 94 days. Have you received any prior offers? Is the seller open to a 9% concession, seller financing, or rate buy-down credit?
- Built in 1964 — when were the roof, HVAC, electrical panel, plumbing, and water heater last replaced?
- Why hasn't it sold? Are there any deal-killer items the seller is aware of (foundation, flood, title, zoning, code violations)?
- Is there a deadline driving the sale (1031 exchange, divorce, estate, relocation)? That informs how much negotiation room exists.
- Schools are F-rated, which usually means shorter tenancies and higher turnover. Who's the typical renter profile here, and what's been the actual vacancy rate?
- Crime grade is F in this area — have there been break-ins, vandalism, or insurance claims at this property in the last 3 years? What carrier currently insures it and at what premium?
- What's the average days-on-market for RENTAL listings here right now (not sales)? A rising rental-DOM trend means longer vacancies and softer asking-rent achievability than the comps imply.
- What's the recent tenant-quality profile in this submarket — average credit score on applications, eviction rate, late-payment / NSF rate, and stable-employment percentage? A property-management company in the area should have these aggregated.
- How much new for-sale + rental construction is in the pipeline within 1–3 miles? Heavy new supply typically softens prices + rents 12–24 months out; constrained supply supports both.
Investment metrics
- 1% rule
- 0.95% ✗
- Cap rate
- 7.01%
- Cash-on-cash
- 2.58%
- DSCR
- 1.11
- GRM
- 8.8
CMA / ARV
- ARV (median comp)
- $165,091
- List price
- $140,000
- Delta
- -15.20%
- Verdict
- UNDERPRICED
- Comps
- 20 within 1.0 mi
Show comp detail 12 sales within ~0.75 mi
| Address | Dist | Beds/Ba | Sqft | Sold | Price | $/sf | Match |
|---|---|---|---|---|---|---|---|
| 3931 Newcastle Dr | 0.35mi | 3/2.0 | 1,325 (-1%) | 2mo | $137,500 | $104 | 80 |
| 580 W Mound Rd | 0.35mi | 3/1.0 | 1,426 (+6%) | 3mo | $111,500 | $78 | 67 |
| 4022 N Newcastle Dr | 0.29mi | 3/1.0 | 1,280 (-5%) | 10mo | $130,000 | $102 | 66 |
| 4487 Hale Dr | 0.49mi | 3/2.5 | 1,440 (+7%) | 2mo | $153,000 | $106 | 62 |
| 3829 Macarthur Rd | 0.33mi | 3/1.0 | 1,232 (-8%) | 10mo | $82,000 | $67 | 59 |
| 109 Canterbury Dr | 0.40mi | 3/1.5 | 1,432 (+6%) | 12mo | $156,000 | $109 | 58 |
| 426 Fairmont Dr | 0.53mi | 3/1.5 | 1,444 (+7%) | 5mo | $96,450 | $67 | 57 |
| 204 Newcastle Dr | 0.26mi | 2/1.5 (-1) | 1,184 (-12%) | 6mo | $125,000 | $106 | 56 |
| 933 W Frank Dr | 0.39mi | 3/2.0 | 1,536 (+14%) | 6mo | $239,000 | $156 | 53 |
| 4594 Hale Dr | 0.58mi | 3/2.0 | 1,465 (+9%) | 9mo | $169,900 | $116 | 51 |
| 4624 Redbud Ct | 0.60mi | 3/2.0 | 1,460 (+9%) | 10mo | $175,000 | $120 | 49 |
| 4505 Shadow Dr | 0.54mi | 3/2.0 | 1,525 (+14%) | 4mo | $220,000 | $144 | 49 |
Match score weights: distance 35% · size 25% · config 20% · recency 20%. Top-matched comps best support the ARV.
Projected returns pro-forma
-2.21% appreciation · 3.0% rent growth · sell at horizon
- IRR
- -8.2%
- Equity multiple
- 0.68×
- Total profit
- $-12,656
- Equity at exit
- $25,826
- IRR
- 0.0%
- Equity multiple
- 1.00×
- Total profit
- $55
- Equity at exit
- $20,784
Cash invested: $39,200 (down + closing). Projections, not guarantees.
Landlord ↔ Tenant lean methodology
- Overall (STATE)
- 43 Moderately Tenant-Leaning
- State Illinois
- 43 Moderately Tenant-Leaning · D+7
- County
- — inherits STATE
- City
- — inherits STATE
ZIP-level market 62526
- Home prices YoY
- -1.2%
- Active inventory
- 135
- Price-to-rent
- 8.8×
Monthly cashflow live
- Estimated rent
- $1,326 medium interval (Pro) →
- Mortgage (P&I)
- −$734
- Tax from tax record
- −$171 /mo · $2,050/yr
- Insurance
- −$58
- HOA
- −$0
- Vacancy / Maint / Mgmt
- −$278
- Net cashflow
- $84
Break-even live
Sensitivity live
| Price | -10% $163 | -5% $124 | +0% $84 | +5% $44 | +10% $5 |
|---|---|---|---|---|---|
| Rent | -10% $-21 | -5% $32 | +0% $84 | +5% $136 | +10% $189 |
| Rate | -1.0pp $155 | -0.5pp $120 | base $84 | +0.5pp $48 | +1.0pp $11 |
UW: 25.0% down · 7.5% · 30yr · 1.5% tax · 5.0% vac · 8.0% maint · 8.0% mgmt
Financing live
Cash to close
- Down payment
- $35,000
- Closing costs
- $4,200
- Reserves months
- —
- Total cash needed
- —
Loan-product check · same deal, 3 products live
Conventional
25% down · 7.5% · 30yr
- Down + closing
- —
- Monthly P&I
- —
- Monthly cashflow
- —
- DSCR
- —
- Eligible?
- —
Personal DTI + credit; lowest rate.
DSCR
20% down · 8.5% · 30yr
- Down + closing
- —
- Monthly P&I
- —
- Monthly cashflow
- —
- DSCR
- —
- Eligible?
- —
No personal income docs; deal must DSCR.
Hard money
10% down · 12.0% · 12mo
- Down + closing
- —
- Monthly P&I
- —
- Monthly cashflow
- —
- DSCR
- —
- Eligible?
- —
Short-term bridge; refi at stabilization.
Listing history 14 events
-
2026-06-13statusdays on market $140,000 Pending 94 DOM
-
2026-06-10days on market $140,000 Active Under Contract 92 DOM
-
2026-06-09days on market $140,000 Active Under Contract 91 DOM
-
2026-06-08days on market $140,000 Active Under Contract 90 DOM
-
2026-06-07days on market $140,000 Active Under Contract 89 DOM
-
2026-06-05days on market $140,000 Active Under Contract 86 DOM
-
2026-06-02days on market $140,000 Active Under Contract 84 DOM
-
2026-06-01days on market $140,000 Active Under Contract 83 DOM
-
2026-05-31days on market $140,000 Active Under Contract 82 DOM
-
2026-05-30days on market $140,000 Active Under Contract 81 DOM
-
2026-04-10price $140,000 898-char remark
Show marketing remark (898 chars)
Move right in to this well maintained all brick ranch located on Decatur’s desirable north end! As you step inside, you’ll immediately notice the living room filled with natural light, creating a bright and welcoming space to relax or entertain. The kitchen offers plenty of cabinet storage along with laminate countertops and an updated backsplash, providing both functionality and style. Off the kitchen is the dining room space with french doors that lead to the fenced in backyard. The main level features three comfortable bedrooms, all with hardwood flooring, along with a full bathroom that was fully remodeled. Downstairs, the basement offers a spacious family room ready for your finishing touches, plus an additional full bathroom that, with a little TLC, has great potential to be a fantastic extra space. This solid north end home offers space, updates, and great potential!
-
2026-03-23price $149,900 898-char remark
Show marketing remark (898 chars)
Move right in to this well maintained all brick ranch located on Decatur’s desirable north end! As you step inside, you’ll immediately notice the living room filled with natural light, creating a bright and welcoming space to relax or entertain. The kitchen offers plenty of cabinet storage along with laminate countertops and an updated backsplash, providing both functionality and style. Off the kitchen is the dining room space with french doors that lead to the fenced in backyard. The main level features three comfortable bedrooms, all with hardwood flooring, along with a full bathroom that was fully remodeled. Downstairs, the basement offers a spacious family room ready for your finishing touches, plus an additional full bathroom that, with a little TLC, has great potential to be a fantastic extra space. This solid north end home offers space, updates, and great potential!
-
2026-03-10$154,900 Active 898-char remark
Show marketing remark (898 chars)
Move right in to this well maintained all brick ranch located on Decatur’s desirable north end! As you step inside, you’ll immediately notice the living room filled with natural light, creating a bright and welcoming space to relax or entertain. The kitchen offers plenty of cabinet storage along with laminate countertops and an updated backsplash, providing both functionality and style. Off the kitchen is the dining room space with french doors that lead to the fenced in backyard. The main level features three comfortable bedrooms, all with hardwood flooring, along with a full bathroom that was fully remodeled. Downstairs, the basement offers a spacious family room ready for your finishing touches, plus an additional full bathroom that, with a little TLC, has great potential to be a fantastic extra space. This solid north end home offers space, updates, and great potential!
-
2006-09-27soldstatus $92,000
ⓘ Source: listings_history table (triggers on properties + properties_extension) + one-shot
backfill from property_details.listing_events for pre-trigger history.
Tax reassessment forecast IL · Partial reset (capped growth)
- Current annual tax
- $2,050 · $171/mo
- Projected year-2 tax
- $2,614 · $218/mo
- Expected delta
- +$564/yr (+$47/mo · 27.5%)
ⓘ Screening estimate from a state-policy table — verify with the county assessor before closing.
Climate risk First Street
- Flood 1/10 Low FEMA zone X (unshaded) · 0% chance over 30 yrs
- Wildfire 1/10 Low
- Heat 3/10 Moderate 7 d/yr ≥105°F today · 19 d/yr by 30 yrs out
- Wind 2/10 Low 100% chance of damaging wind over 30 yrs
- Air quality 2/10 Low 1 unhealthy d/yr today · 1 by 30 yrs out
Nearby sold comps map
Loading sold comps map…
Walkable amenities ~0.75 mi
Loading nearby amenities…
Taxation est. · year 1
- Rental income
- $15,910
- − Mortgage interest
- −$7,842
- − Property taxes
- −$2,050
- − Insurance
- −$700
- − Repairs & maintenance
- −$1,273
- − Management
- −$1,273
- − Depreciation
- −$4,073
- Taxable loss
- −$1,300
- Est. tax savings @ 24.0%
- +$312
- After-tax cash flow
- $1,321/yr
For passive investors: Depreciation is non-cash, so a rental often shows a tax loss while cash-flowing — sheltering income. Rental losses are passive: they offset passive income freely, and up to $25,000/yr can offset ordinary (W-2) income if you actively participate and your MAGI is under $100k (phasing out to $0 by $150k); unused losses carry forward. On sale, claimed depreciation is recaptured at up to 25%, and gains may owe capital-gains tax (a 1031 exchange can defer both). Figures are a year-1 estimate at your 24.0% rate — not tax advice; consult a CPA.
Schools (NCES district)
- District
- Decatur SD 61
- NCES district ID
- 1711850
- Math proficiency
- 3% ▼ -4.00%
- Reading proficiency
- 6% ▼ -6.00%
- Median HH income
- $38,864
- Composite
- 3.99/100
- National rank
- #10059
- State rank
- #605 of 620 in IL
Livability — Decatur
- Score
- 59/100
- State rank
- #1076
- US rank
- #20533
Category grades
Schools grade is shown separately in the Schools card above.
Census & demographics
- Census place
- Decatur, IL
- County
- Macon County · 78,333 people
- City population
- 78,333
- Metro
- Decatur, IL
- Population (ZIP)
- 30,483
- Household income
- $49,062
- Rent vs Own
- Severe rent burden
- 1041.0
Population outlook (Macon County) Hauer SSP2
- Today (2025)
- 99,568 people
- By 2030
- 94,973 · -4.6%
- By 2040
- 85,250 · -14.4%
- By 2050
- 75,920 · -23.8%
- By 2075
- 55,962 · -43.8%
- By 2100
- 36,468 · -63.4%
Race, ethnicity, and origin ACS 2023
- Neighborhood character
- Predominantly White (68%)
- Race & ethnicity
- White 68% Black 22% Two or more races 6% Hispanic / Latino 3% Asian 2%
- Common ancestry
- Lithuanian 2% Italian 2% Slovak 2%
- Foreign-born
- 4% · Canada
- Languages at home
- 95% English-only · Spanish 2% Other Indo-European 1%
Political lean MEDSL · Macon
- 2024 margin
- R (+18.9) · D 39.8% · R 58.7% · Other 1.4%
- 2008→2024 swing
- -20.0pp toward R · 2008: 1.1pp · 2024: -18.9pp
- All cycles
- 2024: R+18.9 2020: R+17.7 2016: R+18.1 2012: R+5.2 2008: D+1.1
Not yet ingested
- Civics
- —
Market trends
- HPI YoY
- ▼ -2.21%
- Current HPI
- 182.871
- Rent YoY
- —
- Metro
- Decatur, IL
- State GDP YoY
- ▲ 1.59%
- F500 in state
- 60
Industry mix (Fortune 500 HQ in IL)
| Industry | F500 HQs | Revenue |
|---|---|---|
| Insurance | 4 | $201B |
|
||
| Consumer Goods | 4 | $87B |
|
||
| Industrial Machinery | 3 | $64B |
|
||
| Healthcare | 2 | $55B |
|
||
| Retail / Pharmacy | 1 | $148B |
|
||
| Agriculture / Food | 1 | $86B |
|
||
Price history
+52.2% since first listed4 events — show timeline
- 2026-04-10 Price Changed $140,000 CIBR
- 2026-03-23 Price Changed $149,900 CIBR
- 2026-03-10 Listed $154,900 CIBR
- 2006-09-27 Sold (Public Records) $92,000 Public Records
Property tax history
-1.5%/yrLatest (2024): $2,050 · -2.0% YoY. Source: county tax records.
Cash-flow waterfall
monthlySold comps — $/sqft
last 12 mo · ≤1 miLoading sold comps…