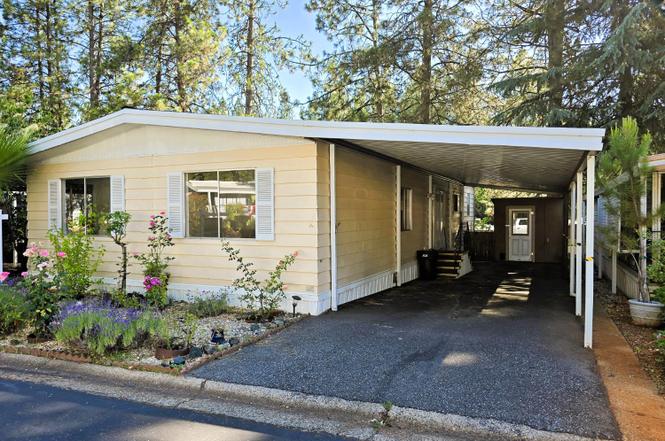
30 Candy Ln · Grass Valley, CA
Flood risk 1/10 · Minimal
- FEMA flood zone
- X (unshaded)
- Chance of flooding over 30 yrs
- 0.0%
- Est. flood insurance / yr
- $507 – $1,088
Fire risk 9/10 · Severe
- Est. fire insurance / yr
- $659 – $1,223
Heat risk 5/10 · Moderate
- Hot days now (above 95°F)
- 6 days/yr
- Hot days in 30 yrs
- 14 days/yr
Wind risk 1/10 · Minimal
- Chance of severe wind over 30 yrs
- —
Air-quality risk 10/10 · Severe
- Unhealthy air days now
- 33 days/yr
- Unhealthy air days in 30 yrs
- 40 days/yr
Risk factors via First Street. Map © Google.
Why this score? — see what drove the B grade
The composite is a weighted blend of 9 inputs, each scored 0–100. Each bar is that input's sub-score; the figure is the points it added to the 100-point composite (weight × sub-score).
- Cash flow +30.0/30.0
- 1% rule +10.0/10.0
- DSCR +10.0/10.0
- ARV discount +7.5/15.0
- Schools +3.8/10.0
- Livability +3.7/5.0
- Rent growth +2.6/5.0
- Condition / age +2.5/5.0
- Appreciation +0.0/10.0
$67,999
🖨 Deal sheet 📄 Offer letter ✓ Due diligence
Listing remarks
* * Freshly Updated in a Desirable 55+ Grass Valley Community! * * Nestled among beautiful pine trees at 30 Candy Ln, this charming home has received a wonderful makeover, featuring * * new flooring, fresh interior paint, and a NEW ROOF installed on 3/29/2026 * * . The property is enhanced by lovely landscaping, colorful plants, and a producing apricot tree, creating a welcoming outdoor setting. Inside, the open floor plan offers comfortable living and plenty of potential to make it your own. The spacious kitchen features a large island, breakfast bar, and abundant workspace, making it ideal for everyday living and entertaining. The living room showcases a stunning built-in wood hutch
Key facts
- Large kitchen island
- Open floor plan
- Laundry room
Tags
Property features AI
Finance
- Other: Land lease amount required
- Financial info: Monthly land lease amount applies
- HOA & community: No homeowners association; Located in a land-lease community (land lease applies)
Exterior
- Parking: Space for 3 vehicles total; Attached covered parking and off-street parking (no traditional garage)
- Utilities: Individual electric meter and individual gas meter; Natural gas connected; Internet available; Private water and private sewer
- Home design: Manufactured home (double wide) located in a park; Built in 1975; Property described as fixer and also updated/remodeled; Senior community
- Construction: Aluminum skirting; Composition roof; Manufactured construction (Golden West)
- Exterior features: Backyard with fence and garden; Carport awning and porch awning; Covered deck/porch (deck attached to living room); Storage shed(s)
Interior
- Kitchen: Built-in electric oven; Gas cook top; Dishwasher; Garbage disposal; Pantry closet; Kitchen island; Plumbed for ice maker
- Bedrooms: 2 bedrooms including master bedroom
- Flooring: Simulated wood, laminate and wood flooring
- Bathrooms: 2 full bathrooms; Tub with shower over
- Heating & cooling: Central heating; Central air conditioning and ceiling fans
- Interior features: Built-in electric oven, gas cook top, dishwasher and garbage disposal; Plumbed for ice maker; Pantry closet and kitchen island; Dining bar and combined dining/living area; Covered deck/porch with railings and porch steps; Storage area; Pets allowed (cats and dogs permitted)
- Laundry & utility: Indoor laundry room with hookups (220 volts in laundry)
Neighborhood map
What this means for you Summary
Snapshot
- This is a 2-bed/2.0-bath manufactured listed at $68k.
Deal economics
- At list price, monthly cash flow is $1k ($12k/yr) — positive.
- The deal already cash-flows at list — no discount required.
- Meets the 1% rule at list price ($2k rent vs $68k).
- Recommended offer: $64k (6.0% below list) — sets the bar for market timing.
- Cap rate 24.7% vs local median 2.0% in Grass Valley — top-decile yield for the area; either an underpriced asset or a hidden risk that comps aren't pricing in. Stress-test before assuming the spread holds.
Location & tenants
- Location reads 74/100 on livability (#134 in CA, #4,710 nationally) — a middle-class / working-renter tenant base. Strengths: amenities A+, commute A+, health & safety A+; Watch: employment D+, crime F, cost of living F.
- Nevada Joint Union High (town): math 25% / reading 61% proficiency, ranked #201 of 517 in CA (top 39%) — families likely to look elsewhere, expect single-tenant / working-renter base with shorter leases.
- Market conditions: Rents flat; 197 active listings in the ZIP; 215 units permitted in Nevada County in 2024 (0 in 5+ unit buildings).
- This rent runs 35% of the median local income ($66k/yr) — at the standard rent-burdened threshold; future hikes will face affordability resistance.
Forward outlook
- Local home prices are declining (-3.0%/yr); year-one equity from $470 of loan paydown is wiped out by about $2k of value loss. Plan a longer hold.
- Nevada County population projected at -14% by 2050 — secular population decline; favor cash flow + early exit over multi-decade hold.
- At projected returns (-3.0% appreciation + 0.4% rent growth), your $19k cash investment doubles in ~2 years — after that, you're playing with house money.
Negotiation context
- It's been on market 88 days — a 6% lower offer ($64k) is reasonable based on typical stale-listing flexibility.
Risks & watch-outs
- Climate carrying-cost: severe wildfire risk; extreme-heat days projected 6→14/yr by 2055 (HVAC capex compounding) — expect insurance premiums to compound above CPI over the hold.
Questions for the listing agent
- It's been on market 88 days. Have you received any prior offers? Is the seller open to a 6% concession, seller financing, or rate buy-down credit?
- Built in 1975 — when were the roof, HVAC, electrical panel, plumbing, and water heater last replaced?
- Why hasn't it sold? Are there any deal-killer items the seller is aware of (foundation, flood, title, zoning, code violations)?
- Is there a deadline driving the sale (1031 exchange, divorce, estate, relocation)? That informs how much negotiation room exists.
- Crime grade is F in this area — have there been break-ins, vandalism, or insurance claims at this property in the last 3 years? What carrier currently insures it and at what premium?
- What's the average days-on-market for RENTAL listings here right now (not sales)? A rising rental-DOM trend means longer vacancies and softer asking-rent achievability than the comps imply.
- What's the recent tenant-quality profile in this submarket — average credit score on applications, eviction rate, late-payment / NSF rate, and stable-employment percentage? A property-management company in the area should have these aggregated.
- How much new for-sale + rental construction is in the pipeline within 1–3 miles? Heavy new supply typically softens prices + rents 12–24 months out; constrained supply supports both.
Investment metrics
- 1% rule
- 2.81% ✓
- Cap rate
- 24.67%
- Cash-on-cash
- 65.62%
- DSCR
- 3.92
- GRM
- 3.0
CMA / ARV
- ARV (on-the-fly)
- $139,776
- Comps found
- 12
Show comp detail 12 sales within ~0.75 mi
| Address | Dist | Beds/Ba | Sqft | Sold | Price | $/sf | Match |
|---|---|---|---|---|---|---|---|
| 41 Candy Ln | 0.07mi | 2/2.0 | 1,440 (+7%) | 5mo | $65,000 | $45 | 81 |
| 31 Candy Ln | 0.03mi | 2/2.0 | 1,392 (+4%) | 18mo | $110,000 | $79 | 78 |
| 44 Primrose Ln | 0.08mi | 2/2.0 | 1,326 (-1%) | 22mo | $147,000 | $111 | 76 |
| 18 Juan Way | 0.10mi | 2/2.0 | 1,296 (-4%) | 18mo | $89,500 | $69 | 74 |
| 28 Primrose Ln | 0.04mi | 3/2.0 (+1) | 1,200 (-11%) | 4mo | $125,000 | $104 | 72 |
| 28 Wendy Cir | 0.20mi | 2/2.0 | 1,440 (+7%) | 11mo | $95,000 | $66 | 70 |
| 11195 Alpine Ln | 0.35mi | 3/2.0 (+1) | 1,255 (-7%) | 3mo | $399,000 | $318 | 65 |
| 14 Wendy Cir | 0.24mi | 2/2.0 | 1,248 (-7%) | 19mo | $117,000 | $94 | 61 |
| 73 Wendy Cir | 0.28mi | 3/2.0 (+1) | 1,264 (-6%) | 13mo | $172,500 | $136 | 61 |
| 10 Wendy Cir #10 | 0.26mi | 3/2.0 (+1) | 1,220 (-9%) | 13mo | $140,000 | $115 | 57 |
| 17 Wendy Cir | 0.23mi | 2/2.0 | 1,200 (-11%) | 19mo | $115,000 | $96 | 56 |
| 502 Granite Hill Ct | 0.66mi | 3/2.0 (+1) | 1,452 (+8%) | 7mo | $227,000 | $156 | 45 |
Match score weights: distance 35% · size 25% · config 20% · recency 20%. Top-matched comps best support the ARV.
Projected returns pro-forma
-3.0% appreciation · 0.38% rent growth · sell at horizon
- IRR
- 61.8%
- Equity multiple
- 3.65×
- Total profit
- $50,412
- Equity at exit
- $10,139
- IRR
- 65.5%
- Equity multiple
- 6.79×
- Total profit
- $110,274
- Equity at exit
- $5,879
Cash invested: $19,040 (down + closing). Projections, not guarantees.
Landlord ↔ Tenant lean methodology
- Overall (STATE)
- 18 Strongly Tenant-Friendly
- State California
- 18 Strongly Tenant-Friendly · D+13
- County
- — inherits STATE
- City
- — inherits STATE
ZIP-level market 95945
- Rents YoY
- 0.4%
- Active inventory
- 197
- Price-to-rent
- 3.0×
Monthly cashflow live
- Estimated rent
- $1,913 medium interval (Pro) →
- Mortgage (P&I)
- −$357
- Tax est. 1.5%
- −$85 /mo · $1,020/yr
- Insurance
- −$28
- HOA
- −$0
- Vacancy / Maint / Mgmt
- −$402
- Net cashflow
- $1,041
Break-even live
UW: 25.0% down · 7.5% · 30yr · 1.5% tax · 5.0% vac · 8.0% maint · 8.0% mgmt
Financing live
Cash to close
- Down payment
- $17,000
- Closing costs
- $2,040
- Reserves months
- —
- Total cash needed
- —
Loan-product check · same deal, 3 products live
Conventional
25% down · 7.5% · 30yr
- Down + closing
- —
- Monthly P&I
- —
- Monthly cashflow
- —
- DSCR
- —
- Eligible?
- —
Personal DTI + credit; lowest rate.
DSCR
20% down · 8.5% · 30yr
- Down + closing
- —
- Monthly P&I
- —
- Monthly cashflow
- —
- DSCR
- —
- Eligible?
- —
No personal income docs; deal must DSCR.
Hard money
10% down · 12.0% · 12mo
- Down + closing
- —
- Monthly P&I
- —
- Monthly cashflow
- —
- DSCR
- —
- Eligible?
- —
Short-term bridge; refi at stabilization.
Listing history 5 events
-
2026-06-19days on market $67,999 Active 88 DOM
-
2026-06-18days on market $67,999 Active 87 DOM
-
2026-06-17days on market $67,999 Active 86 DOM
-
2026-06-17remarks 699-char remark
-
2026-06-17$67,999 Active 85 DOM
ⓘ Source: listings_history table (triggers on properties + properties_extension) + one-shot
backfill from property_details.listing_events for pre-trigger history.
Climate risk First Street
- Flood 1/10 Low FEMA zone X (unshaded) · 0% chance over 30 yrs
- Wildfire 9/10 Extreme
- Heat 5/10 Major 6 d/yr ≥95°F today · 14 d/yr by 30 yrs out
- Wind 1/10 Low
- Air quality 10/10 Extreme 33 unhealthy d/yr today · 40 by 30 yrs out
Nearby sold comps map
Loading sold comps map…
Walkable amenities ~0.75 mi
Loading nearby amenities…
Taxation est. · year 1
- Rental income
- $22,954
- − Mortgage interest
- −$3,809
- − Property taxes
- −$1,020
- − Insurance
- −$340
- − Repairs & maintenance
- −$1,836
- − Management
- −$1,836
- − Depreciation
- −$1,978
- Taxable income
- $12,134
- Est. tax owed @ 24.0%
- −$2,912
- After-tax cash flow
- $9,582/yr
For passive investors: Depreciation is non-cash, so a rental often shows a tax loss while cash-flowing — sheltering income. Rental losses are passive: they offset passive income freely, and up to $25,000/yr can offset ordinary (W-2) income if you actively participate and your MAGI is under $100k (phasing out to $0 by $150k); unused losses carry forward. On sale, claimed depreciation is recaptured at up to 25%, and gains may owe capital-gains tax (a 1031 exchange can defer both). Figures are a year-1 estimate at your 24.0% rate — not tax advice; consult a CPA.
Schools (NCES district)
- District
- Nevada Joint Union High
- NCES district ID
- 0626880
- Math proficiency
- 25% ▼ -14.00%
- Reading proficiency
- 61% ▼ -7.00%
- Median HH income
- $57,336
- Composite
- 37.53/100
- National rank
- #4393
- State rank
- #201 of 517 in CA
Livability — Grass Valley
- Score
- 74/100
- State rank
- #134
- US rank
- #4710
Category grades
Schools grade is shown separately in the Schools card above.
Census & demographics
- Census place
- Grass Valley, CA
- County
- Nevada County · 85,339 people
- City population
- 48,022
- Metro
- Truckee-Grass Valley, CA
- Population (ZIP)
- 27,470
- Household income
- $65,989
- Rent vs Own
- Severe rent burden
- 1624.0
Population outlook (Nevada County) Hauer SSP2
- Today (2025)
- 98,490 people
- By 2030
- 97,295 · -1.2%
- By 2040
- 92,041 · -6.5%
- By 2050
- 85,164 · -13.5%
- By 2075
- 68,436 · -30.5%
- By 2100
- 49,536 · -49.7%
Race, ethnicity, and origin ACS 2023
- Neighborhood character
- Predominantly White (81%)
- Race & ethnicity
- White 81% Hispanic / Latino 11% Two or more races 9%
- Hispanic origin (detail)
- Mexican 9%
- Common ancestry
- Italian 4% Lithuanian 3% Portuguese 2%
- Foreign-born
- 7% · Canada
- Languages at home
- 89% English-only · Spanish 7% Arabic 1% Other Asian/Pacific 1%
Political lean MEDSL · Nevada
- 2024 margin
- D (+12.2) · D 54.4% · R 42.1% · Other 3.5%
- 2008→2024 swing
- +6.9pp toward D · 2008: 5.3pp · 2024: 12.2pp
- All cycles
- 2024: D+12.2 2020: D+14.8 2016: D+4.5 2012: R+4.7 2008: D+5.3
Not yet ingested
- Civics
- —
Market trends
- HPI YoY
- ▼ -191.74%
- Current HPI
- 253.8946
- Rent YoY
- ▲ 0.38%
- Metro
- Truckee-Grass Valley, CA
- State GDP YoY
- ▲ 3.21%
- F500 in state
- 116
Industry mix (Fortune 500 HQ in CA)
| Industry | F500 HQs | Revenue |
|---|---|---|
| Technology | 27 | $1,492B |
|
||
| Financial Services | 3 | $174B |
|
||
| Retail | 3 | $44B |
|
||
| Insurance | 3 | $26B |
|
||
| Media / Entertainment | 2 | $115B |
|
||
| Pharmaceuticals / Biotech | 2 | $62B |
|
||
Cash-flow waterfall
monthlySold comps — $/sqft
last 12 mo · ≤1 miLoading sold comps…