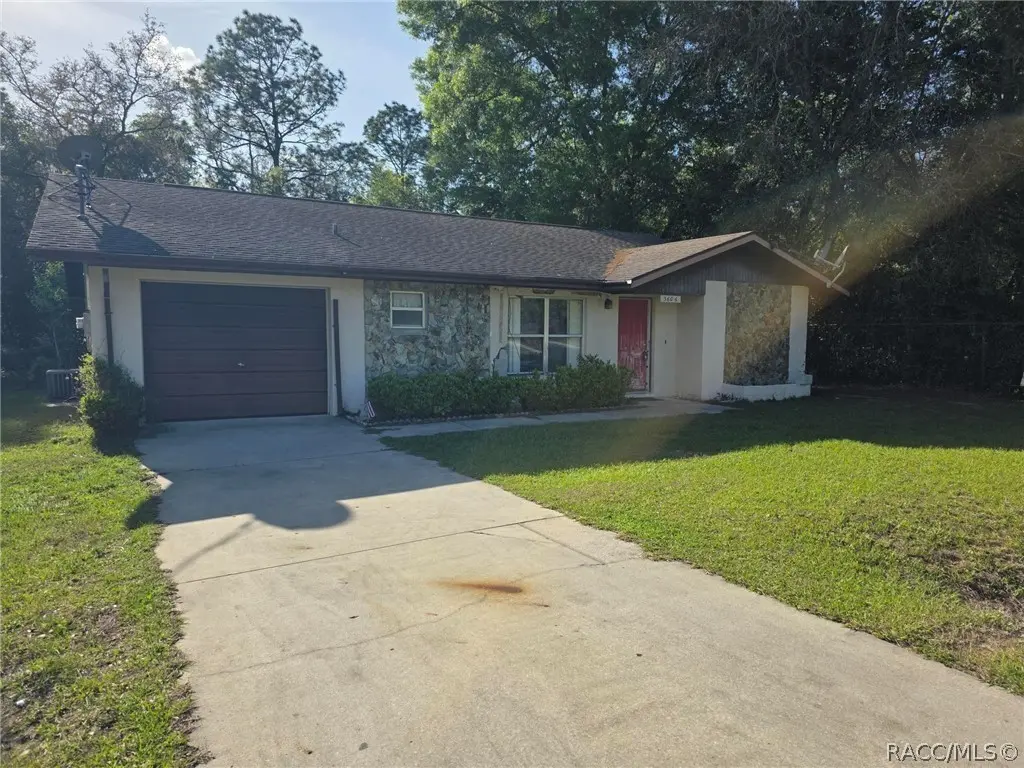
3606 SW Sunnydale St · Rainbow Lakes Estates, FL
Flood risk 7/10 · Major
- FEMA flood zone
- X (unshaded)
- Chance of flooding over 30 yrs
- 0.76%
- Est. flood insurance / yr
- $507 – $1,088
Fire risk 4/10 · Minor
- Est. fire insurance / yr
- $947 – $1,759
Heat risk 8/10 · Major
- Hot days now (above 107°F)
- 3 days/yr
- Hot days in 30 yrs
- 11 days/yr
Wind risk 9/10 · Severe
- Chance of severe wind over 30 yrs
- 99.0%
Air-quality risk 2/10 · Minimal
- Unhealthy air days now
- 0 days/yr
- Unhealthy air days in 30 yrs
- 1 days/yr
Risk factors via First Street. Map © Google.
Why this score? — see what drove the C- grade
The composite is a weighted blend of 9 inputs, each scored 0–100. Each bar is that input's sub-score; the figure is the points it added to the 100-point composite (weight × sub-score).
- Cash flow +16.1/30.0
- ARV discount +15.0/15.0
- DSCR +5.0/10.0
- 1% rule +4.9/10.0
- Schools +3.6/10.0
- Rent growth +2.5/5.0
- Livability +2.5/5.0
- Condition / age +2.5/5.0
- Appreciation +0.0/10.0
$179,000
🖨 Deal sheet 📄 Offer letter ✓ Due diligence
Listing remarks MLS
Dunnellon is between Crystal River and Ocala. It is famous for the Rainbow Springs State Park! The crystal clear waters of the 1st magnitude spring headwaters to the Rainbow River attract visitors from all over the world. It is one of the most beautiful rivers Florida has to offer! Swim at the springs, kayak or tube the river to enjoy the amazing views! Get the most out of your housing dollars and live the rural lifestyle when you are at home in Rainbow Lakes Estates. This home has larger square footage than many in the neighborhood and a contemporary floorplan with kitchen open to main living space with sliding glass doors to the lanai. Use the second guest bedroom as home office. The inside laundry is conveniently off the kitchen. The potential is there, it just needs your vision for thoughtful improvements. Public water and NO HOA!
Key facts
- Rainbow river
- Crystal clear waters
- Sliding glass doors
Tags
Neighborhood map
What this means for you Summary
Snapshot
- This is a 3-bed/2.0-bath single-family listed at $179k.
Deal economics
- At list price, monthly cash flow is $26 ($308/yr) — positive.
- The deal already cash-flows at list — no discount required.
- To meet the 1% rule (rent ≥ 1% of price), the offer needs to be $177k (1.4% below list).
- Recommended offer: $168k (6.0% below list) — sets the bar for market timing.
- Cap rate 6.9% vs local median 4.5% in Rainbow Lakes Estates — top-decile yield for the area; either an underpriced asset or a hidden risk that comps aren't pricing in. Stress-test before assuming the spread holds.
Location & tenants
- Location reads: area grade C — affects rentability + tenant quality, not the cash-flow math above.
- Marion (rural): math 42% / reading 43% proficiency, ranked #61 of 73 in FL (top 84%) — families likely to look elsewhere, expect single-tenant / working-renter base with shorter leases; 61% free/reduced lunch — lower-income household profile, screen leases tightly.
- Market conditions: 553 active listings in the ZIP; 3 comparable units currently listed for rent nearby; rentals leasing fast (median 13d on market — plan ~1-2 weeks tenant-placement turnaround); 7,071 units permitted in Marion County in 2024 (534 in 5+ unit buildings).
- This rent runs 37% of the median local income ($57k/yr) — at the standard rent-burdened threshold; future hikes will face affordability resistance.
Forward outlook
- Local home prices are declining (-3.0%/yr); year-one equity from $1k of loan paydown is wiped out by about $5k of value loss. Plan a longer hold.
- Marion County population projected at +13% by 2050 — modest demand growth; plan on rents tracking national, not racing it.
Negotiation context
- It's been on market 73 days — a 6% lower offer ($168k) is reasonable based on typical stale-listing flexibility.
- 2 sale attempts since 11y ago with the ask held roughly flat each time — persistent listings suggest the price (not the market) is what's stuck; bring a comps-based counter.
- Current owner paid $73k; list at $179k implies a 145% gain — meaningful room to come down on a strong offer.
Risks & watch-outs
- Watch-outs: flood insurance adds $66/mo.
- Climate carrying-cost: major flood risk; severe wind risk, 99% chance of damaging wind over 30y; extreme-heat days projected 3→11/yr by 2055 (HVAC capex compounding) — expect insurance premiums to compound above CPI over the hold.
Questions for the listing agent
- It's been on market 73 days. Have you received any prior offers? Is the seller open to a 6% concession, seller financing, or rate buy-down credit?
- What's the actual annual flood-insurance premium (NFIP or private), and is the property in a SFHA with mandatory coverage?
- Why hasn't it sold? Are there any deal-killer items the seller is aware of (foundation, flood, title, zoning, code violations)?
- Is there a deadline driving the sale (1031 exchange, divorce, estate, relocation)? That informs how much negotiation room exists.
- What's the average days-on-market for RENTAL listings here right now (not sales)? A rising rental-DOM trend means longer vacancies and softer asking-rent achievability than the comps imply.
- What's the recent tenant-quality profile in this submarket — average credit score on applications, eviction rate, late-payment / NSF rate, and stable-employment percentage? A property-management company in the area should have these aggregated.
- How much new for-sale + rental construction is in the pipeline within 1–3 miles? Heavy new supply typically softens prices + rents 12–24 months out; constrained supply supports both.
Investment metrics
- 1% rule
- 0.99% ✗
- Cap rate
- 6.91%
- Cash-on-cash
- 2.21%
- DSCR
- 1.10
- GRM
- 8.4
CMA / ARV
- ARV (median comp)
- $229,981
- List price
- $179,000
- Delta
- -22.17%
- Verdict
- UNDERPRICED
- Comps
- 20 within 1.0 mi
Show comp detail 12 sales within ~0.75 mi
| Address | Dist | Beds/Ba | Sqft | Sold | Price | $/sf | Match |
|---|---|---|---|---|---|---|---|
| 21474 SW Peach Blossom St | 0.29mi | 3/2.0 | 1,411 (-3%) | 2mo | $275,000 | $195 | 80 |
| 21428 SW Raintree St | 0.32mi | 3/2.0 | 1,461 (+1%) | 9mo | $199,000 | $136 | 76 |
| 22285 SW Anchor Blvd | 0.36mi | 3/2.0 | 1,380 (-5%) | 6mo | $248,900 | $180 | 70 |
| 21641 SW Marine Blvd | 0.21mi | 3/2.0 | 1,576 (+9%) | 7mo | $259,900 | $165 | 70 |
| 22334 SW Edgewater Blvd | 0.11mi | 3/2.0 | 1,331 (-8%) | 15mo | $239,900 | $180 | 69 |
| 21110 SW Plantation St | 0.62mi | 3/2.0 | 1,470 (+1%) | 4mo | $199,000 | $135 | 65 |
| 21988 SW Mango Ln | 0.46mi | 3/2.0 | 1,331 (-8%) | 1mo | $249,900 | $188 | 64 |
| 4430 SW Floral Ct | 0.61mi | 3/2.0 | 1,380 (-5%) | 5mo | $248,900 | $180 | 60 |
| 4281 SW Gardenia Ct | 0.73mi | 3/2.0 | 1,380 (-5%) | 4mo | $248,900 | $180 | 55 |
| 22340 SW Anchor Blvd | 0.72mi | 3/2.0 | 1,380 (-5%) | 10mo | $261,000 | $189 | 51 |
| 4152 SW Begonia Ct | 0.65mi | 3/2.0 | 1,600 (+10%) | 4mo | $315,000 | $197 | 49 |
| 4181 SW Gardenia Ct | 0.72mi | 3/2.0 | 1,232 (-15%) | 21mo | $229,000 | $186 | 24 |
Match score weights: distance 35% · size 25% · config 20% · recency 20%. Top-matched comps best support the ARV.
Projected returns pro-forma
-3.0% appreciation · 3.0% rent growth · sell at horizon
- IRR
- -15.2%
- Equity multiple
- 0.46×
- Total profit
- $-27,261
- Equity at exit
- $26,689
- IRR
- -6.6%
- Equity multiple
- 0.58×
- Total profit
- $-21,192
- Equity at exit
- $15,477
Cash invested: $50,120 (down + closing). Projections, not guarantees.
Landlord ↔ Tenant lean methodology
- Overall (STATE)
- 87 Strongly Landlord-Friendly
- State Florida
- 87 Strongly Landlord-Friendly · R+3
- County
- — inherits STATE
- City
- — inherits STATE
ZIP-level market 34431
- Home prices YoY
- -3.2%
- Active inventory
- 553
- Price-to-rent
- 8.4×
Monthly cashflow live
- Estimated rent
- $1,765 medium interval (Pro) →
- Mortgage (P&I)
- −$939
- Tax from tax record
- −$289 /mo · $3,470/yr
- Insurance
- −$75
- Flood insurance flood zone
- −$66 /mo · $798/yr
- HOA
- −$0
- Vacancy / Maint / Mgmt
- −$371
- Net cashflow
- $26
Break-even live
UW: 25.0% down · 7.5% · 30yr · 1.5% tax · 5.0% vac · 8.0% maint · 8.0% mgmt
Financing live
Cash to close
- Down payment
- $44,750
- Closing costs
- $5,370
- Reserves months
- —
- Total cash needed
- —
Loan-product check · same deal, 3 products live
Conventional
25% down · 7.5% · 30yr
- Down + closing
- —
- Monthly P&I
- —
- Monthly cashflow
- —
- DSCR
- —
- Eligible?
- —
Personal DTI + credit; lowest rate.
DSCR
20% down · 8.5% · 30yr
- Down + closing
- —
- Monthly P&I
- —
- Monthly cashflow
- —
- DSCR
- —
- Eligible?
- —
No personal income docs; deal must DSCR.
Hard money
10% down · 12.0% · 12mo
- Down + closing
- —
- Monthly P&I
- —
- Monthly cashflow
- —
- DSCR
- —
- Eligible?
- —
Short-term bridge; refi at stabilization.
Rent comps 3 comps
| Address | Beds | Baths | Sqft | Rent | $/sqft | DOM | Units | Dist |
|---|---|---|---|---|---|---|---|---|
| 21425 SW Plantation St Dunnellon, FL | 3.0 | 2.0 | 1456 | $1,800 | $1.24 | 13d | 1 | 0.34mi |
| 21423 SW Beach Blvd Dunnellon, FL | 3.0 | 2.0 | 1066 | $1,400 | $1.31 | 13d | 1 | 0.45mi |
| 22222 SW Marine Blvd Dunnellon, FL | 3.0 | 2.0 | 1473 | $1,799 | $1.22 | 13d | 1 | 0.51mi |
Listing history 20 events
-
2026-06-18days on market $179,000 Active 73 DOM
-
2026-06-17days on market $179,000 Active 72 DOM
-
2026-06-16days on market $179,000 Active 71 DOM
-
2026-06-15days on market $179,000 Active 70 DOM
-
2026-06-14days on market $179,000 Active 68 DOM
-
2026-06-13days on market $179,000 Active 67 DOM
-
2026-06-10days on market $179,000 Active 65 DOM
-
2026-06-09days on market $179,000 Active 64 DOM
-
2026-06-08days on market $179,000 Active 63 DOM
-
2026-06-07days on market $179,000 Active 62 DOM
-
2026-06-03days on market $179,000 Active 58 DOM
-
2026-06-02days on market $179,000 Active 57 DOM
-
2026-06-01days on market $179,000 Active 56 DOM
-
2026-05-31days on market $179,000 Active 55 DOM
-
2026-05-30days on market $179,000 Active 54 DOM
-
2026-04-07$179,000 Active 846-char remark
Show marketing remark (846 chars)
Dunnellon is between Crystal River and Ocala. It is famous for the Rainbow Springs State Park! The crystal clear waters of the 1st magnitude spring headwaters to the Rainbow River attract visitors from all over the world. It is one of the most beautiful rivers Florida has to offer! Swim at the springs, kayak or tube the river to enjoy the amazing views! Get the most out of your housing dollars and live the rural lifestyle when you are at home in Rainbow Lakes Estates. This home has larger square footage than many in the neighborhood and a contemporary floorplan with kitchen open to main living space with sliding glass doors to the lanai. Use the second guest bedroom as home office. The inside laundry is conveniently off the kitchen. The potential is there, it just needs your vision for thoughtful improvements. Public water and NO HOA!
-
2015-06-04soldstatus $73,000
-
2015-06-03soldstatus $73,000 379-char remark
Show marketing remark (379 chars)
Show & Sell, tranquil country setting, fenced, no neighbors on side or rear. Fire Station behind house 1 block. .good for insurance. Custom build home one owner. . New roof cost $7K, new septic and leach field cost $2K. Main areas has laminate flooring an ceramic tile in kitchen & baths. Huge patio screened, one open. . Needs some cosmetic work but a very good buy.
-
2015-04-17$73,900 379-char remark
Show marketing remark (379 chars)
Show & Sell, tranquil country setting, fenced, no neighbors on side or rear. Fire Station behind house 1 block. .good for insurance. Custom build home one owner. . New roof cost $7K, new septic and leach field cost $2K. Main areas has laminate flooring an ceramic tile in kitchen & baths. Huge patio screened, one open. . Needs some cosmetic work but a very good buy.
-
1990-02-01soldstatus $67,500
ⓘ Source: listings_history table (triggers on properties + properties_extension) + one-shot
backfill from property_details.listing_events for pre-trigger history.
Tax reassessment forecast FL · Resets to sale price
- Current annual tax
- $3,470 · $289/mo
- Projected year-2 tax
- $3,470 · $289/mo
- Expected delta
- $0/yr ($0/mo · 0.0%)
ⓘ Screening estimate from a state-policy table — verify with the county assessor before closing.
Climate risk First Street
- Flood 7/10 Severe FEMA zone X (unshaded) · 76% chance over 30 yrs
- Wildfire 4/10 Moderate
- Heat 8/10 Severe 3 d/yr ≥107°F today · 11 d/yr by 30 yrs out
- Wind 9/10 Extreme 99% chance of damaging wind over 30 yrs
- Air quality 2/10 Low 0 unhealthy d/yr today · 1 by 30 yrs out
Nearby sold comps map
Loading sold comps map…
Walkable amenities ~0.75 mi
Loading nearby amenities…
Taxation est. · year 1
- Rental income
- $21,184
- − Mortgage interest
- −$10,027
- − Property taxes
- −$3,470
- − Insurance
- −$1,692
- − Repairs & maintenance
- −$1,695
- − Management
- −$1,695
- − Depreciation
- −$5,207
- Taxable loss
- −$2,602
- Est. tax savings @ 24.0%
- +$624
- After-tax cash flow
- $933/yr
For passive investors: Depreciation is non-cash, so a rental often shows a tax loss while cash-flowing — sheltering income. Rental losses are passive: they offset passive income freely, and up to $25,000/yr can offset ordinary (W-2) income if you actively participate and your MAGI is under $100k (phasing out to $0 by $150k); unused losses carry forward. On sale, claimed depreciation is recaptured at up to 25%, and gains may owe capital-gains tax (a 1031 exchange can defer both). Figures are a year-1 estimate at your 24.0% rate — not tax advice; consult a CPA.
Schools (NCES district)
- District
- Marion
- NCES district ID
- 1201260
- Math proficiency
- 42% ▼ -7.00%
- Reading proficiency
- 43% ▼ -4.00%
- Median HH income
- $40,015
- Composite
- 35.61/100
- National rank
- #4890
- State rank
- #61 of 73 in FL
Livability — Rainbow Lakes Estates
No livability data for this city. (Only ~50 U.S. cities are tracked.)
Census & demographics
- Census place
- Rainbow Lakes Estates, FL
- County
- Marion County · 315,796 people
- Metro
- Ocala, FL
- Population (ZIP)
- 9,785
- Household income
- $56,534
- Rent vs Own
- Severe rent burden
- 72.0
Population outlook (Marion County) Hauer SSP2
- Today (2025)
- 365,905 people
- By 2030
- 376,768 · +3.0%
- By 2040
- 396,555 · +8.4%
- By 2050
- 412,723 · +12.8%
- By 2075
- 446,090 · +21.9%
- By 2100
- 436,193 · +19.2%
Race, ethnicity, and origin ACS 2023
- Neighborhood character
- Predominantly White (87%)
- Race & ethnicity
- White 87% Hispanic / Latino 7% Two or more races 5% Black 3% Asian 1%
- Hispanic origin (detail)
- Mexican 2% Puerto Rican 4% Cuban 1%
- Common ancestry
- Lithuanian 4% Slovak 3% Portuguese 2%
- Foreign-born
- 4% · Canada, Vietnam
- Languages at home
- 96% English-only · Spanish 2% German/W. Germanic 1% Vietnamese 1%
Political lean MEDSL · Marion
- 2024 margin
- Solid R (+31.6) · D 33.8% · R 65.5%
- 2008→2024 swing
- -20.0pp toward R · 2008: -11.6pp · 2024: -31.6pp
- All cycles
- 2024: R+31.6 2020: R+25.9 2016: R+26.2 2012: R+16.2 2008: R+11.6
Not yet ingested
- Civics
- —
Market trends
- HPI YoY
- ▼ -11.42%
- Current HPI
- 343.1464
- Rent YoY
- —
- Metro
- Ocala, FL
- State GDP YoY
- ▲ 3.28%
- F500 in state
- 36
Industry mix (Fortune 500 HQ in FL)
| Industry | F500 HQs | Revenue |
|---|---|---|
| Industrial Technology | 2 | $29B |
|
||
| Insurance | 2 | $17B |
|
||
| Retail | 1 | $60B |
|
||
| Technology Distribution | 1 | $58B |
|
||
| Homebuilding | 1 | $35B |
|
||
| Technology Manufacturing | 1 | $35B |
|
||
Price history
+165.2% since first listed5 events — show timeline
- 2026-04-07 Listed $179,000 RACC
- 2015-06-04 Sold (Public Records) $73,000 Public Records
- 2015-06-03 Sold (MLS) $73,000 Stellar MLS as Distributed by MLS Grid
- 2015-04-17 Listed $73,900 Stellar MLS as Distributed by MLS Grid
- 1990-02-01 Sold (Public Records) $67,500 Public Records
Property tax history
+9.5%/yrLatest (2025): $3,470 · +14.1% YoY. Source: county tax records.
Cash-flow waterfall
monthlySold comps — $/sqft
last 12 mo · ≤1 miLoading sold comps…