 🏢 Co-op
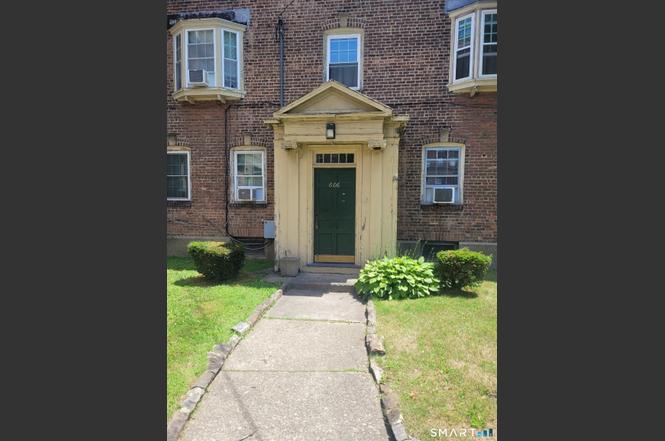
606 Wilmot Ave #4 · Bridgeport, CT
Flood risk No data
- FEMA flood zone
- —
- Chance of flooding over 30 yrs
- —
- Est. flood insurance / yr
- —
Fire risk No data
- Est. fire insurance / yr
- —
Heat risk No data
- Hot days now (above threshold)
- —
- Hot days in 30 yrs
- —
Wind risk No data
- Chance of severe wind over 30 yrs
- —
Air-quality risk No data
- Unhealthy air days now
- —
- Unhealthy air days in 30 yrs
- —
Risk factors via First Street. Map © Google.
Why this score? — see what drove the B+ grade
The composite is a weighted blend of 9 inputs, each scored 0–100. Each bar is that input's sub-score; the figure is the points it added to the 100-point composite (weight × sub-score).
- Cash flow +30.0/30.0
- 1% rule +10.0/10.0
- DSCR +10.0/10.0
- Appreciation +10.0/10.0
- ARV discount +7.5/15.0
- Livability +4.0/5.0
- Rent growth +2.5/5.0
- Condition / age +2.5/5.0
- Schools +1.2/10.0
$65,000
🖨 Deal sheet 📄 Offer letter ✓ Due diligence
Listing remarks MLS
Updated 2 bedroom unit located in a co-op community. There is a washer & dryer in the unit. Very convenient commuter location close to 95 located near the Steel Point Development Project.
Key facts
- $590 HOA
- Built 1948
- Listed 5 days
Property features AI
Finance
- Other: No pets allowed; Nearby amenities include basketball court, public transportation, and proximity to bus lines; Located in Fairfield County, Connecticut
- HOA & community: Monthly association fee ($590) covering grounds maintenance, water, sewer, property management, and taxes; Has homeowners association
Exterior
- Utilities: Public water connected; Public sewer connected
- Home design: Co-op condo; Part of a 48-unit complex (Bridgeport Wilmot Apt-Coop); End unit
- Construction: Brick construction
- Exterior features: Brick exterior; Level lot
Interior
- Kitchen: Oven/Range; Microwave; Refrigerator
- Bedrooms: 2 bedrooms; 3 levels in unit
- Bathrooms: 1 full bathroom
- Heating & cooling: Radiator heat; Natural gas heating
- Interior features: Full, unfinished shared basement with storage and concrete floor; Apartment-style unit
- Laundry & utility: Washer and dryer included; Domestic hot water
Neighborhood map
What this means for you Summary
Snapshot
- This is a 2-bed/1.0-bath condo listed at $65k.
Deal economics
- At list price, monthly cash flow is $374 ($4k/yr) — positive.
- The deal already cash-flows at list — no discount required.
- Meets the 1% rule at list price ($2k rent vs $65k).
- Cap rate 13.2% vs local median 5.0% in Bridgeport — top-decile yield for the area; either an underpriced asset or a hidden risk that comps aren't pricing in. Stress-test before assuming the spread holds.
Location & tenants
- Location reads 81/100 on livability (#15 in CT, #1,374 nationally) — a professional / high-income tenant draw. Strengths: amenities A+, commute A+, health & safety A+; Watch: crime C-, employment D+, schools D-.
- Bridgeport School District (urban): math 9% / reading 19% proficiency, ranked #151 of 153 in CT (top 99%) — low school quality limits family demand, transient renter base, plan for 1-2y turnover; 97% free/reduced lunch — lower-income household profile, screen leases tightly.
- Market conditions: 33 active listings in the ZIP; 29 comparable units currently listed for rent nearby; rentals at typical pace (median 14d on market — plan ~3-4 weeks tenant-placement turnaround); 852 units permitted in Greater Bridgeport Planning Region in 2024 (698 in 5+ unit buildings).
- This rent runs 43% of the median local income ($50k/yr) — at the standard rent-burdened threshold; future hikes will face affordability resistance.
Forward outlook
- In year one you build about $7k of equity ($449 loan paydown + $6k appreciation (10.0% local appreciation)).
- At projected returns (10.0% appreciation + 3.0% rent growth), your $18k cash investment doubles in ~2 years — after that, you're playing with house money.
- By year 5, paydown + projected appreciation supports a ~$32k cash-out refi (75% LTV) — recoverable capital for the next deal without selling this one.
Negotiation context
- Only 5 days on market — expect competitive offers; lowballing is unlikely to land.
- 4 sale attempts since 21y ago with the ask held roughly flat each time — persistent listings suggest the price (not the market) is what's stuck; bring a comps-based counter.
- Current owner paid $18k; list at $65k implies a 261% gain — meaningful room to come down on a strong offer.
Risks & watch-outs
- Watch-outs: HOA is 33% of rent; built in 1948 — expect roof / HVAC / electrical / plumbing capex.
Questions for the listing agent
- Built in 1948 — when were the roof, HVAC, electrical panel, plumbing, and water heater last replaced?
- What does the HOA fee cover, when was the last increase, and are there any pending special assessments or reserve-fund shortfalls?
- Any open or pending special assessments — roof, HVAC, plumbing, elevator, façade? What's the per-unit balance and payoff schedule, and is the seller paying it off at close or rolling it to the buyer?
- Is there a deadline driving the sale (1031 exchange, divorce, estate, relocation)? That informs how much negotiation room exists.
- Schools are D-rated, which usually means shorter tenancies and higher turnover. Who's the typical renter profile here, and what's been the actual vacancy rate?
- What's the average days-on-market for RENTAL listings here right now (not sales)? A rising rental-DOM trend means longer vacancies and softer asking-rent achievability than the comps imply.
- What's the recent tenant-quality profile in this submarket — average credit score on applications, eviction rate, late-payment / NSF rate, and stable-employment percentage? A property-management company in the area should have these aggregated.
- How much new apartment / multifamily construction is in the pipeline within 1–3 miles? Heavy new supply (>2% of stock underway) typically softens rents 12–24 months out; light construction supports rent growth.
Investment metrics
- 1% rule
- 2.75% ✓
- Cap rate
- 13.19%
- Cash-on-cash
- 24.63%
- DSCR
- 2.10
- GRM
- 3.0
CMA / ARV
No comps found within radius.
Projected returns pro-forma
10.0% appreciation · 3.0% rent growth · sell at horizon
- IRR
- 43.0%
- Equity multiple
- 4.27×
- Total profit
- $59,583
- Equity at exit
- $58,557
- IRR
- 37.3%
- Equity multiple
- 9.66×
- Total profit
- $157,526
- Equity at exit
- $126,281
Cash invested: $18,200 (down + closing). Projections, not guarantees.
Landlord ↔ Tenant lean methodology
- Overall (STATE)
- 27 Tenant-Leaning
- State Connecticut
- 27 Tenant-Leaning · D+7
- County
- — inherits STATE
- City
- — inherits STATE
ZIP-level market 06607
- Home prices YoY
- 4.7%
- Active inventory
- 33
- Price-to-rent
- 3.0×
Monthly cashflow live
- Estimated rent
- $1,788 high interval (Pro) →
- Mortgage (P&I)
- −$341
- Tax est. 1.5%
- −$81 /mo · $975/yr
- Insurance
- −$27
- HOA
- −$590
- Vacancy / Maint / Mgmt
- −$376
- Net cashflow
- $374
Break-even live
UW: 25.0% down · 7.5% · 30yr · 1.5% tax · 5.0% vac · 8.0% maint · 8.0% mgmt
Financing live
Cash to close
- Down payment
- $16,250
- Closing costs
- $1,950
- Reserves months
- —
- Total cash needed
- —
Loan-product check · same deal, 3 products live
Conventional
25% down · 7.5% · 30yr
- Down + closing
- —
- Monthly P&I
- —
- Monthly cashflow
- —
- DSCR
- —
- Eligible?
- —
Personal DTI + credit; lowest rate.
DSCR
20% down · 8.5% · 30yr
- Down + closing
- —
- Monthly P&I
- —
- Monthly cashflow
- —
- DSCR
- —
- Eligible?
- —
No personal income docs; deal must DSCR.
Hard money
10% down · 12.0% · 12mo
- Down + closing
- —
- Monthly P&I
- —
- Monthly cashflow
- —
- DSCR
- —
- Eligible?
- —
Short-term bridge; refi at stabilization.
Rent comps 29 comps
| Address | Beds | Baths | Sqft | Rent | $/sqft | DOM | Units | Dist |
|---|---|---|---|---|---|---|---|---|
| 647 Union Ave Unit 2 Bridgeport, CT | 2.0 | 1.0 | 750 | $1,675 | $2.23 | 3d | 1 | 0.14mi |
| 145 Cowles St Unit B7 Bridgeport, CT | 1.0 | 1.0 | 600 | $1,325 | $2.21 | 3d | 1 | 0.31mi |
| 1525 Central Ave Bridgeport, CT | 1.0 | 1.0 | 625 | $1,550 | $2.48 | 43d | 3 | 0.48mi |
| 222 Beardsley St Unit 3rd floor Bridgeport, CT | 2.0 | 1.0 | 732 | $2,000 | $2.73 | 43d | 1 | 0.49mi |
| 1150 Ogden Street Ext Unit 102 Bridgeport, CT | 1.0 | 1.0 | 700 | $1,425 | $2.04 | 14d | 1 | 0.67mi |
| 556 Hollister St Stratford, CT | 1.0–2.0 | 1.0 | 725 | $2,295 | $3.17 | 11d | 4 | 0.69mi |
| 192 Peace St Unit 1st floor Stratford, CT | 2.0 | 1.0 | 712 | $2,000 | $2.81 | 43d | 1 | 0.82mi |
| 588-612 E Main St Unit 598 Bridgeport, CT | 2.0 | 1.0 | 750 | $1,975 | $2.63 | 10d | 1 | 0.92mi |
| 588-612 E Main St Unit D Bridgeport, CT | 2.0 | 1.0 | 750 | $2,125 | $2.83 | 43d | 1 | 0.92mi |
| 86 Birdsey St Unit 3R Bridgeport, CT | 1.0 | 1.0 | 650 | $1,350 | $2.08 | 43d | 1 | 0.95mi |
| 1254 Pembroke St Unit 1st Floor Bridgeport, CT | 2.0 | 1.0 | 738 | $1,850 | $2.51 | 14d | 1 | 0.97mi |
| 855 Main St Bridgeport, CT | 1.0 | 1.0 | 490 | $2,380 | $4.86 | 3d | 10 | 0.99mi |
| 855 Main St Bridgeport, CT | 1.0 | 1.0 | 490 | $2,380 | $4.86 | 19d | 10 | 0.99mi |
| 250 N Bishop Ave Bridgeport, CT | 1.0 | 1.0 | 611 | $1,425 | $2.33 | 23d | 2 | 1.04mi |
| 250 N Bishop Ave #19 Bridgeport, CT | 1.0 | 1.0 | 638 | $1,650 | $2.59 | 43d | 1 | 1.04mi |
| 250 N Bishop Ave #1 Bridgeport, CT | 1.0 | 1.0 | 583 | $1,650 | $2.83 | 11d | 1 | 1.04mi |
| 55 E Main St Bridgeport, CT | 3.0 | 1.0–3.0 | 1115 | $6,712 | $6.02 | 3d | 189 | 1.06mi |
| 1333 E Main St Apt 1 Bridgeport, CT | 2.0 | 1.0 | 700 | $1,700 | $2.43 | 3d | 1 | 1.19mi |
| 1333 E Main St #5 Bridgeport, CT | 2.0 | 1.0 | 700 | $1,650 | $2.36 | 3d | 1 | 1.19mi |
| 105 William St Unit A Bridgeport, CT | 1.0 | 1.0 | 582 | $1,350 | $2.32 | 43d | 1 | 1.27mi |
| 116 Knowlton St Unit 2C Bridgeport, CT | 3.0 | 1.0 | 750 | $1,200 | $1.60 | 19d | 1 | 1.28mi |
| 235 Henry Ave Unit 12E Stratford, CT | 1.0 | 1.0 | 692 | $1,695 | $2.45 | 10d | 1 | 1.38mi |
| 116 Ogden St Unit 120 Bridgeport, CT | 2.0 | 1.0 | 688 | $2,375 | $3.45 | 3d | 1 | 1.41mi |
| 144 Golden Hill St Bridgeport, CT | 1.0 | 1.0 | 592 | $1,675 | $2.83 | 14d | 1 | 1.42mi |
| 600 Bond St Unit 112 Bridgeport, CT | 1.0 | 1.0 | 545 | $2,250 | $4.13 | 43d | 1 | 1.45mi |
| 231 Goddard Ave Unit 3RD Bridgeport, CT | 2.0 | 1.0 | 618 | $1,700 | $2.75 | 3d | 1 | 1.46mi |
| 432 Main St Unit 438 Bridgeport, CT | 3.0 | 1.0 | 565 | $1,950 | $3.45 | 43d | 1 | 1.47mi |
| 213 Golden Hill St Unit 4D Bridgeport, CT | 2.0 | 1.0 | 750 | $1,800 | $2.40 | 43d | 1 | 1.49mi |
| 225 Golden Hill St Apt 4D Bridgeport, CT | 2.0 | 1.0 | 750 | $1,800 | $2.40 | 43d | 1 | 1.49mi |
HOA detail condo
- Monthly dues
- $590 · $7,080/yr
- Assessments
- None detected in remarks — confirm with the listing agent.
Listing history 5 events
-
2026-06-18days on market $65,000 Active 5 DOM
-
2026-06-17days on market $65,000 Active 4 DOM
-
2026-06-16days on market $65,000 Active 3 DOM
-
2026-06-15remarks 293-char remark
-
2026-06-15$65,000 Active 2 DOM
ⓘ Source: listings_history table (triggers on properties + properties_extension) + one-shot
backfill from property_details.listing_events for pre-trigger history.
Nearby sold comps map
Loading sold comps map…
Walkable amenities ~0.75 mi
Loading nearby amenities…
Taxation est. · year 1
- Rental income
- $21,460
- − Mortgage interest
- −$3,641
- − Property taxes
- −$975
- − Insurance
- −$325
- − Repairs & maintenance
- −$1,717
- − Management
- −$1,717
- − HOA
- −$7,080
- − Depreciation
- −$1,891
- Taxable income
- $4,114
- Est. tax owed @ 24.0%
- −$987
- After-tax cash flow
- $3,495/yr
For passive investors: Depreciation is non-cash, so a rental often shows a tax loss while cash-flowing — sheltering income. Rental losses are passive: they offset passive income freely, and up to $25,000/yr can offset ordinary (W-2) income if you actively participate and your MAGI is under $100k (phasing out to $0 by $150k); unused losses carry forward. On sale, claimed depreciation is recaptured at up to 25%, and gains may owe capital-gains tax (a 1031 exchange can defer both). Figures are a year-1 estimate at your 24.0% rate — not tax advice; consult a CPA.
Schools (NCES district)
- District
- Bridgeport School District
- NCES district ID
- 0900450
- Math proficiency
- 9% ▼ -7.00%
- Reading proficiency
- 19% ▼ -10.00%
- Median HH income
- $41,507
- Composite
- 12.09/100
- National rank
- #9656
- State rank
- #151 of 153 in CT
Livability — Bridgeport
- Score
- 81/100
- State rank
- #15
- US rank
- #1374
Category grades
Schools grade is shown separately in the Schools card above.
Census & demographics
- Census place
- Bridgeport, CT
- County
- Fairfield County · 765,532 people
- City population
- 149,153
- Metro
- Bridgeport-Stamford-Norwalk, CT
- Population (ZIP)
- 7,979
- Household income
- $50,000
- Rent vs Own
- Severe rent burden
- 534.0
Population outlook (Greater Bridgeport County) Hauer SSP2
- By 2040
- 365,581
Race, ethnicity, and origin ACS 2023
- Neighborhood character
- Diverse neighborhood (Simpson 0.58)
- Race & ethnicity
- Hispanic / Latino 57% Black 31% Two or more races 19% Asian 6% White 3%
- Hispanic origin (detail)
- Mexican 2% Puerto Rican 32% Cuban 4% Dominican 4%
- Common ancestry
- Estonian 1% Russian 1%
- Foreign-born
- 25% · Canada, Vietnam, Jamaica
- Languages at home
- 52% English-only · Spanish 42% Other Asian/Pacific 2% Other Indo-European 2%
Political lean MEDSL · Greater Bridgeport
- 2024 margin
- Strong D (+23.3) · D 60.9% · R 37.6% · Other 1.5%
- All cycles
- 2024: D+23.3
Not yet ingested
- Civics
- —
Market trends
- HPI YoY
- ▲ 26.05%
- Current HPI
- 584.8108
- Rent YoY
- —
- Metro
- Bridgeport-Stamford-Norwalk, CT
- State GDP YoY
- ▲ 1.06%
- F500 in state
- 38
Industry mix (Fortune 500 HQ in CT)
| Industry | F500 HQs | Revenue |
|---|---|---|
| Industrial Machinery | 4 | $38B |
|
||
| Insurance | 3 | $71B |
|
||
| Financial Services | 2 | $25B |
|
||
| Transportation / Logistics | 2 | $18B |
|
||
| Healthcare | 1 | $247B |
|
||
| Telecommunications | 1 | $55B |
|
||
Price history
+12.1% since first listed8 events — show timeline
- 2026-06-13 Listed $65,000 Smart MLS
- 2020-02-04 Sold (MLS) $18,000 Smart MLS
- 2019-12-02 Pending — Smart MLS
- 2019-11-22 Listed $22,000 Smart MLS
- 2006-12-27 Listing Removed — Smart MLS
- 2006-06-27 Listed $58,000 Smart MLS
- 2005-07-17 Listing Removed — Smart MLS
- 2005-04-19 Listed $58,000 Smart MLS
Cash-flow waterfall
monthlySold comps — $/sqft
last 12 mo · ≤1 miLoading sold comps…