74711 Dillon Rd Spc 749 · Sky Valley, CA
Flood risk 1/10 · Minimal
- FEMA flood zone
- D
- Chance of flooding over 30 yrs
- 0.0%
- Est. flood insurance / yr
- $544 – $1,084
Fire risk 3/10 · Minor
- Est. fire insurance / yr
- $659 – $1,223
Heat risk 8/10 · Major
- Hot days now (above 111°F)
- 7 days/yr
- Hot days in 30 yrs
- 20 days/yr
Wind risk 1/10 · Minimal
- Chance of severe wind over 30 yrs
- —
Air-quality risk 5/10 · Moderate
- Unhealthy air days now
- 6 days/yr
- Unhealthy air days in 30 yrs
- 8 days/yr
Risk factors via First Street. Map © Google.
Why this score? — see what drove the C+ grade
The composite is a weighted blend of 9 inputs, each scored 0–100. Each bar is that input's sub-score; the figure is the points it added to the 100-point composite (weight × sub-score).
- Cash flow +30.0/30.0
- 1% rule +10.0/10.0
- DSCR +10.0/10.0
- Condition / age +4.0/5.0
- Schools +2.7/10.0
- Livability +2.6/5.0
- Rent growth +2.5/5.0
- ARV discount +0.0/15.0
- Appreciation +0.0/10.0
$65,000
🖨 Deal sheet (PDF) 📄 Offer letter ✓ Due diligence
Listing remarks
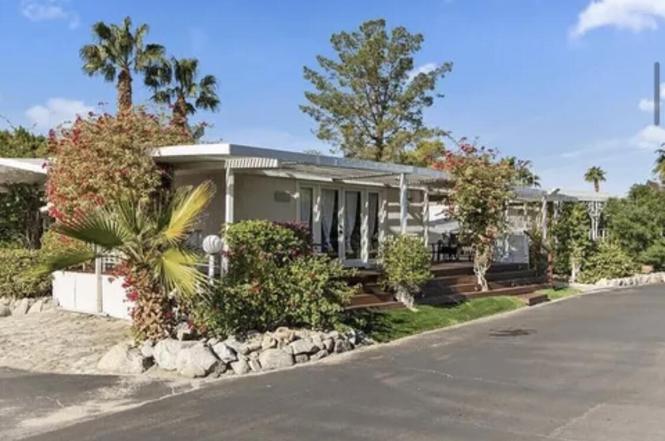
Gated ALL AGED family park called Sky Valley Resort located 12 miles from WalMart, Costco and Home Depot in Rancho Mirage. RARE 2 bedroom home with 3 french doors accessing the long deck featuring a lovely view of the entertaining duck filled pond. Close to the clubhouse, fitness center and mineral pools and spas. Peaceful and serene with colorful bougainvillea. Space rent is $975 with up to 3 people allowed on the lease. Total household income must be at least $2925 and fico score of 630 or higher. Sky Valley Resort is an active community with lots of amenities and activities. 13 sparkling hot spring mineral pools and spas, pickleball, tennis, walking trails and ponds, library, in season c
Key facts
- 2,000 sq ft lot
- Garage
- Community pool
Property features AI
Finance
- Other: PUD: No; Short-term rentals not allowed; Will not consider lease
- Financial info: Land is lease type; Rental restrictions apply; Listing terms: Cash or cash to new loan
- HOA & community: Monthly association fees listed as $0.00; Gated community
Exterior
- Parking: Driveway parking (1 uncovered/assigned space, total 1 parking space)
- Security: Card/Code access; Gated community
- Utilities: Septic tank
- Home design: Detached property; One-story
- Construction: Year built: other
- Exterior features: Gated, card/code access in a community setting; Street lights; Views of hills, pond and park/green belt; Community pool and spa (in-ground, heated, fenced) with exercise pool
Interior
- Flooring: Laminate flooring
- Bathrooms: One 3/4 bathroom
- Heating & cooling: Forced air heating; Air conditioning; Ceiling fan(s)
- Interior features: Furnished; Living room
Neighborhood map
What this means for you Summary
Snapshot
- This is a 2-bed/1.0-bath manufactured listed at $65k. Condition is rated good.
Deal economics
- At list price, monthly cash flow is $771 ($9k/yr) — positive.
- The deal already cash-flows at list — no discount required.
- Meets the 1% rule at list price ($2k rent vs $65k).
- Cap rate 20.5% vs local median 9.6% in Sky Valley — top-decile yield for the area; either an underpriced asset or a hidden risk that comps aren't pricing in. Stress-test before assuming the spread holds.
Location & tenants
- Location reads 52/100 on livability (#1,041 in CA) — a working-class tenant base; expect higher turnover. Strengths: housing A; Watch: amenities F, commute F, employment F.
- Palm Springs Unified (suburban): math 21% / reading 42% proficiency, ranked #328 of 517 in CA (top 63%) — families likely to look elsewhere, expect single-tenant / working-renter base with shorter leases; 73% free/reduced lunch — lower-income household profile, screen leases tightly.
- Zoned schools: Della S. Lindley Elementary (584 students, 96% FRL); Desert Springs Middle (803 students, 99% FRL); Desert Hot Springs High (math 27% / reading 52%, grade F, #532 of 1,170 statewide, top 48%, 1,742 students, 98% FRL) — zoned schools average 98% FRL vs 73% district-wide (24 pts higher); higher-poverty schools than district average — tighter screening recommended.
- Market conditions: 218 active listings in the ZIP; 9,195 units permitted in Riverside County in 2024 (1,512 in 5+ unit buildings).
Forward outlook
- Local home prices are declining (-3.0%/yr); year-one equity from $449 of loan paydown is wiped out by about $2k of value loss. Plan a longer hold.
- Riverside County population projected at +22% by 2050 — long-run rental-demand tailwind backs the buy-and-hold thesis.
- At projected returns (-3.0% appreciation + 3.0% rent growth), your $18k cash investment doubles in ~3 years — after that, you're playing with house money.
Negotiation context
- Only 1 days on market — expect competitive offers; lowballing is unlikely to land.
- 7 sale attempts since 3y ago with the ask held roughly flat each time — persistent listings suggest the price (not the market) is what's stuck; bring a comps-based counter.
Risks & watch-outs
- Climate carrying-cost: extreme-heat days projected 7→20/yr by 2055 (HVAC capex compounding) — expect insurance premiums to compound above CPI over the hold.
Questions for the listing agent
- Is there a deadline driving the sale (1031 exchange, divorce, estate, relocation)? That informs how much negotiation room exists.
- Schools are F-rated, which usually means shorter tenancies and higher turnover. Who's the typical renter profile here, and what's been the actual vacancy rate?
- What's the average days-on-market for RENTAL listings here right now (not sales)? A rising rental-DOM trend means longer vacancies and softer asking-rent achievability than the comps imply.
- What's the recent tenant-quality profile in this submarket — average credit score on applications, eviction rate, late-payment / NSF rate, and stable-employment percentage? A property-management company in the area should have these aggregated.
- How much new for-sale + rental construction is in the pipeline within 1–3 miles? Heavy new supply typically softens prices + rents 12–24 months out; constrained supply supports both.
Investment metrics
- 1% rule
- 2.38% ✓
- Cap rate
- 20.53%
- Cash-on-cash
- 50.86%
- DSCR
- 3.26
- GRM
- 3.5
CMA / ARV
- ARV (median comp)
- $44,400
- List price
- $65,000
- Delta
- 62.16%
- Verdict
- OVERPRICED
- Comps
- 5 within 1.0 mi
Show comp detail 12 sales within ~0.75 mi
| Address | Dist | Beds/Ba | Sqft | Sold | Price | $/sf | Match |
|---|---|---|---|---|---|---|---|
| 74711 Dillon Rd #960 | 0.00mi | 2/1.0 | 650 (0%) | 12mo | $74,000 | $114 | 90 |
| 74711 Dillon Rd #974 | 0.00mi | 2/1.0 | 683 (+5%) | 14mo | $85,000 | $124 | 80 |
| 74711 Dillon Rd Spc 881 | 0.00mi | 1/1.0 (-1) | 600 (-8%) | 4mo | $63,000 | $105 | 79 |
| 74711 Dillon Rd #800 | 0.00mi | 2/1.0 | 600 (-8%) | 11mo | $31,000 | $52 | 78 |
| 74711 Dillon Rd #869 | 0.00mi | 2/1.0 | 700 (+8%) | 11mo | $77,500 | $111 | 78 |
| 74711 Dillon Rd #1011 | 0.00mi | 2/1.0 | 700 (+8%) | 16mo | $57,000 | $81 | 74 |
| 74711 Dillon Rd #842 | 0.00mi | 2/1.0 | 610 (-6%) | 19mo | $92,000 | $151 | 74 |
| 74711 Dillon Rd Spc 89 | 0.16mi | 1/1.0 (-1) | 650 (0%) | 17mo | $88,000 | $135 | 73 |
| 74711 Dillon Rd #706 | 0.00mi | 2/1.0 | 700 (+8%) | 18mo | $82,000 | $117 | 72 |
| 74711 Dillon Rd #736 | 0.00mi | 1/1.5 (-1) | 600 (-8%) | 12mo | $80,000 | $133 | 70 |
| 74711 Dillon Rd Spc 218 | 0.00mi | 1/1.0 (-1) | 600 (-8%) | 16mo | $40,000 | $67 | 69 |
| 74711 Dillon Rd #714 | 0.02mi | 2/2.0 | 700 (+8%) | 18mo | $64,500 | $92 | 68 |
Match score weights: distance 35% · size 25% · config 20% · recency 20%. Top-matched comps best support the ARV.
Projected returns pro-forma
-3.0% appreciation · 3.0% rent growth · sell at horizon
- IRR
- 48.7%
- Equity multiple
- 3.12×
- Total profit
- $38,619
- Equity at exit
- $9,692
- IRR
- 54.3%
- Equity multiple
- 6.33×
- Total profit
- $96,984
- Equity at exit
- $5,620
Cash invested: $18,200 (down + closing). Projections, not guarantees.
Landlord ↔ Tenant lean methodology
- Overall (STATE)
- 18 Strongly Tenant-Friendly
- State California
- 18 Strongly Tenant-Friendly · D+13
- County
- — inherits STATE
- City
- — inherits STATE
ZIP-level market 92241
- Home prices YoY
- -22.8%
- Active inventory
- 218
- Price-to-rent
- 3.5×
Monthly cashflow live
- Estimated rent
- $1,545 medium interval (Pro) →
- Mortgage (P&I)
- −$341
- Tax est. 1.5%
- −$81 /mo · $975/yr
- Insurance
- −$27
- HOA
- −$0
- Vacancy / Maint / Mgmt
- −$324
- Net cashflow
- $771
Break-even live
Sensitivity live
| Price | -10% $816 | -5% $794 | +0% $771 | +5% $749 | +10% $726 |
|---|---|---|---|---|---|
| Rent | -10% $649 | -5% $710 | +0% $771 | +5% $832 | +10% $893 |
| Rate | -1.0pp $804 | -0.5pp $788 | base $771 | +0.5pp $755 | +1.0pp $737 |
UW: 25.0% down · 7.5% · 30yr · 1.5% tax · 5.0% vac · 8.0% maint · 8.0% mgmt
Financing live
Cash to close
- Down payment
- $16,250
- Closing costs
- $1,950
- Reserves months
- —
- Total cash needed
- —
Loan-product check · same deal, 3 products live
Conventional
25% down · 7.5% · 30yr
- Down + closing
- —
- Monthly P&I
- —
- Monthly cashflow
- —
- DSCR
- —
- Eligible?
- —
Personal DTI + credit; lowest rate.
DSCR
20% down · 8.5% · 30yr
- Down + closing
- —
- Monthly P&I
- —
- Monthly cashflow
- —
- DSCR
- —
- Eligible?
- —
No personal income docs; deal must DSCR.
Hard money
10% down · 12.0% · 12mo
- Down + closing
- —
- Monthly P&I
- —
- Monthly cashflow
- —
- DSCR
- —
- Eligible?
- —
Short-term bridge; refi at stabilization.
Listing history 32 events
-
2026-06-22remarks 699-char remark
-
2026-06-22pricedays on market $65,000 Active 1 DOM
-
2026-06-13days on market $72,000 Active 345 DOM
-
2026-06-09days on market $72,000 Active 342 DOM
-
2026-06-08days on market $72,000 Active 341 DOM
-
2026-06-07days on market $72,000 Active 340 DOM
-
2026-06-04days on market $72,000 Active 337 DOM
-
2026-06-03days on market $72,000 Active 336 DOM
-
2026-06-02days on market $72,000 Active 335 DOM
-
2026-06-01days on market $72,000 Active 334 DOM
-
2026-05-31days on market $72,000 Active 333 DOM
-
2026-04-10price $72,000 643-char remark
-
2025-12-22price $77,000 643-char remark
-
2025-10-30price $81,000 643-char remark
-
2025-09-05status Active 643-char remark
-
2025-08-23status Pending 643-char remark
-
2025-08-16status Active 643-char remark
-
2025-08-12status Pending 643-char remark
-
2025-07-28price $86,200 643-char remark
-
2025-06-13$83,000 Active 643-char remark
-
2025-05-28price $83,000
-
2025-05-07price $89,000
-
2025-02-08price $92,900
-
2025-01-29price $97,900
-
2025-01-13$98,000 Active
-
2025-01-01historical
-
2024-12-03price $98,000
-
2024-10-02price $115,000
-
2024-06-24price $125,000
-
2024-04-25$135,000 Active
-
2024-01-05historical
-
2023-10-07$145,000 Active
ⓘ Source: listings_history table (triggers on properties + properties_extension) + one-shot
backfill from property_details.listing_events for pre-trigger history.
Climate risk First Street
- Flood 1/10 Low FEMA zone D · 0% chance over 30 yrs
- Wildfire 3/10 Moderate
- Heat 8/10 Severe 7 d/yr ≥111°F today · 20 d/yr by 30 yrs out
- Wind 1/10 Low
- Air quality 5/10 Major 6 unhealthy d/yr today · 8 by 30 yrs out
Nearby sold comps map
Loading sold comps map…
Walkable amenities ~0.75 mi
Loading nearby amenities…
Taxation est. · year 1
- Rental income
- $18,540
- − Mortgage interest
- −$3,641
- − Property taxes
- −$975
- − Insurance
- −$325
- − Repairs & maintenance
- −$1,483
- − Management
- −$1,483
- − Depreciation
- −$1,891
- Taxable income
- $8,742
- Est. tax owed @ 24.0%
- −$2,098
- After-tax cash flow
- $7,158/yr
For passive investors: Depreciation is non-cash, so a rental often shows a tax loss while cash-flowing — sheltering income. Rental losses are passive: they offset passive income freely, and up to $25,000/yr can offset ordinary (W-2) income if you actively participate and your MAGI is under $100k (phasing out to $0 by $150k); unused losses carry forward. On sale, claimed depreciation is recaptured at up to 25%, and gains may owe capital-gains tax (a 1031 exchange can defer both). Figures are a year-1 estimate at your 24.0% rate — not tax advice; consult a CPA.
Condition & rehab AI · 12 photos
This manufactured home is in good condition with a good condition score of 80. It has a good kitchen, good bathroom, good roof, good exterior, good flooring, good interior walls/paint, and good systems. The home is move-in ready with minor cosmetic repairs and maintenance needed. The highest-ROI updates that would raise its resale or rental value are painting the exterior siding and trimming and pruning the landscaping.
Value-add opportunities
- Both Paint exterior siding — Enhances curb appeal and value
- Both Trim and prune landscaping — Improves curb appeal and enhances property value
Renovation cost estimate screening
Value-add ROI direction
- Both Paint exterior siding — Enhances curb appeal and value ↑
- Both Trim and prune landscaping — Improves curb appeal and enhances property value ↑
ⓘ Cost ranges are severity-bucket heuristics (US national rule-of-thumb). Get contractor quotes + a written scope before underwriting a rehab budget.
Schools (NCES district)
- District
- Palm Springs Unified
- NCES district ID
- 0629550
- Math proficiency
- 21% ▼ -7.00%
- Reading proficiency
- 42% ▬ 0.00%
- Median HH income
- $43,638
- Composite
- 26.76/100
- National rank
- #7131
- State rank
- #328 of 517 in CA
Livability — Sky Valley
- Score
- 52/100
- State rank
- #1041
- US rank
- #25108
Category grades
Schools grade is shown separately in the Schools card above.
Census & demographics
- Census place
- Sky Valley, CA
- Population (ZIP)
- 8,624
Population outlook (Riverside County) Hauer SSP2
- Today (2025)
- 2,664,475 people
- By 2030
- 2,802,692 · +5.2%
- By 2040
- 3,050,904 · +14.5%
- By 2050
- 3,256,783 · +22.2%
- By 2075
- 3,655,058 · +37.2%
- By 2100
- 3,766,594 · +41.4%
Race, ethnicity, and origin ACS 2023
- Race & ethnicity
- White 50% Hispanic / Latino 46% Two or more races 16% Asian 2% Native American 1%
- Hispanic origin (detail)
- Mexican 36%
- Common ancestry
- Lithuanian 3% Slovak 2% Portuguese 2%
- Foreign-born
- 28% · Canada, South Korea
- Languages at home
- 57% English-only · Spanish 38% Chinese 1% Russian/Polish/Slavic 1%
Political lean MEDSL · Riverside
- 2024 margin
- Toss-up / Even · D 48.0% · R 49.3% · Other 2.6%
- 2008→2024 swing
- -3.6pp toward R · 2008: 2.3pp · 2024: -1.3pp
- All cycles
- 2024: R+1.3 2020: D+8.0 2016: D+4.3 2012: R+0.4 2008: D+2.3
Not yet ingested
- Civics
- —
Market trends
- HPI YoY
- ▼ -118.23%
- Current HPI
- 400.5663
- Rent YoY
- —
- Metro
- —
- State GDP YoY
- ▲ 3.21%
- F500 in state
- 116
Industry mix (Fortune 500 HQ in CA)
| Industry | F500 HQs | Revenue |
|---|---|---|
| Technology | 27 | $1,492B |
|
||
| Financial Services | 3 | $174B |
|
||
| Retail | 3 | $44B |
|
||
| Insurance | 3 | $26B |
|
||
| Media / Entertainment | 2 | $115B |
|
||
| Pharmaceuticals / Biotech | 2 | $62B |
|
||
Price history
-55.2% since first listed23 events — show timeline
- 2026-06-13 Listing Removed — GPSMLS
- 2026-06-13 Listed $65,000 GPSMLS
- 2026-04-10 Price Changed $72,000 GPSMLS
- 2025-12-22 Price Changed $77,000 GPSMLS
- 2025-10-30 Price Changed $81,000 GPSMLS
- 2025-09-05 Relisted — GPSMLS
- 2025-08-23 Pending — GPSMLS
- 2025-08-16 Relisted — GPSMLS
- 2025-08-12 Pending — GPSMLS
- 2025-07-28 Price Changed $86,200 GPSMLS
- 2025-06-13 Listed $83,000 GPSMLS
- 2025-05-28 Price Changed $83,000 GPSMLS
- 2025-05-07 Price Changed $89,000 GPSMLS
- 2025-02-08 Price Changed $92,900 GPSMLS
- 2025-01-29 Price Changed $97,900 GPSMLS
- 2025-01-13 Listed $98,000 GPSMLS
- 2025-01-01 Listing Removed — GPSMLS
- 2024-12-03 Price Changed $98,000 GPSMLS
- 2024-10-02 Price Changed $115,000 GPSMLS
- 2024-06-24 Price Changed $125,000 GPSMLS
- 2024-04-25 Listed $135,000 GPSMLS
- 2024-01-05 Listing Removed — GPSMLS
- 2023-10-07 Listed $145,000 GPSMLS
Cash-flow waterfall
monthlySold comps — $/sqft
last 12 mo · ≤1 miLoading sold comps…