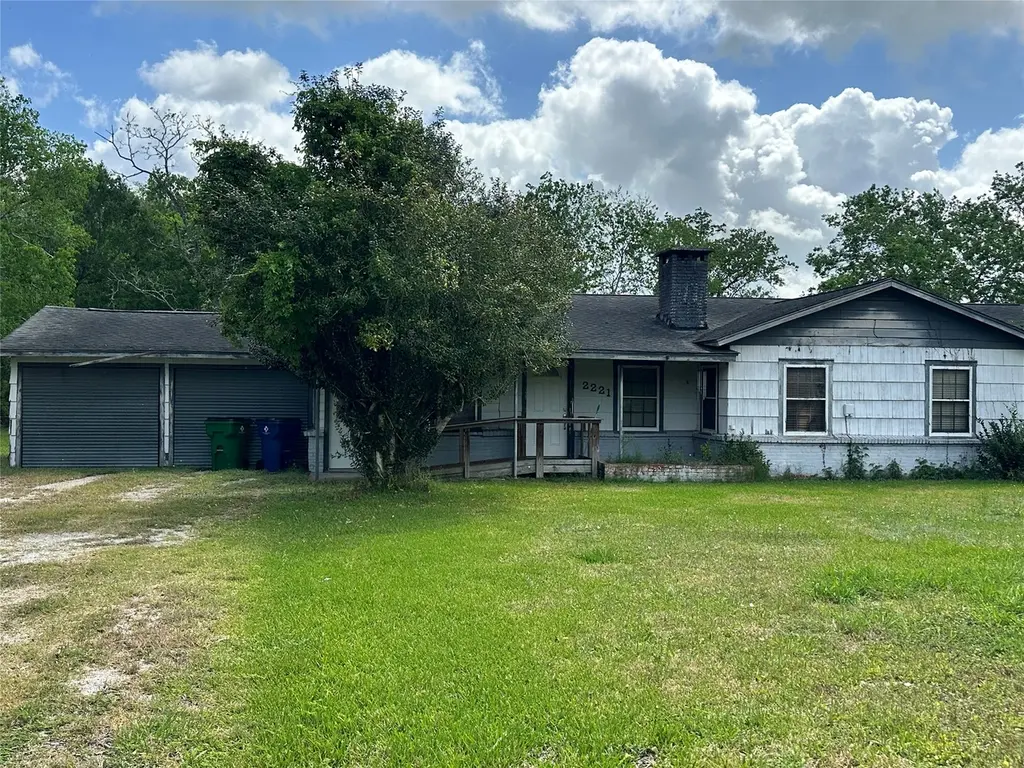
2221 S Front St · Angleton, TX
Flood risk 1/10 · Minimal
- FEMA flood zone
- X (unshaded)
- Chance of flooding over 30 yrs
- 0.0%
- Est. flood insurance / yr
- $507 – $1,088
Fire risk 6/10 · Moderate
- Est. fire insurance / yr
- $1,222 – $2,270
Heat risk 10/10 · Severe
- Hot days now (above 111°F)
- 7 days/yr
- Hot days in 30 yrs
- 25 days/yr
Wind risk 9/10 · Severe
- Chance of severe wind over 30 yrs
- 99.0%
Air-quality risk 2/10 · Minimal
- Unhealthy air days now
- 1 days/yr
- Unhealthy air days in 30 yrs
- 2 days/yr
Risk factors via First Street. Map © Google.
Why this score? — see what drove the C+ grade
The composite is a weighted blend of 9 inputs, each scored 0–100. Each bar is that input's sub-score; the figure is the points it added to the 100-point composite (weight × sub-score).
- Cash flow +22.6/30.0
- ARV discount +15.0/15.0
- 1% rule +7.5/10.0
- DSCR +7.3/10.0
- Livability +3.7/5.0
- Schools +3.5/10.0
- Rent growth +2.5/5.0
- Condition / age +2.5/5.0
- Appreciation +0.0/10.0
$149,900
🖨 Deal sheet (PDF) 📄 Offer letter ✓ Due diligence
Listing remarks MLS
Opportunity awaits with this spacious 4-bedroom, 2-bath home situated on nearly an acre just outside of town! Featuring a converted 2-car garage and a generous layout, this property offers the perfect canvas for those looking to add their personal touch and create their dream home. Nestled in a peaceful setting with plenty of room to roam, garden, or expand, you’ll enjoy the best of country-style living while still being conveniently close to town amenities. With a little vision and TLC, this fixer-upper has incredible potential—whether you’re an investor or a buyer ready to make it your own. Don’t miss out on this chance to turn potential into reality!
Key facts
- Garden
- Country-style living
- Nearly an acre
Tags
Neighborhood map
What this means for you Summary
Snapshot
- This is a 4-bed/1.0-bath single-family listed at $150k.
Deal economics
- At list price, monthly cash flow is $256 ($3k/yr) — positive.
- The deal already cash-flows at list — no discount required.
- Meets the 1% rule at list price ($2k rent vs $150k).
- Recommended offer: $141k (6.0% below list) — sets the bar for market timing.
- Cap rate 8.3% vs local median 4.0% in Angleton — top-decile yield for the area; either an underpriced asset or a hidden risk that comps aren't pricing in. Stress-test before assuming the spread holds.
Location & tenants
- Location reads 74/100 on livability (#171 in TX, #4,520 nationally) — a middle-class / working-renter tenant base. Strengths: cost of living A+, housing A+, employment A-; Watch: amenities F, commute F.
- Angleton ISD (suburban): math 36% / reading 44% proficiency, ranked #375 of 826 in TX (top 45%) — families likely to look elsewhere, expect single-tenant / working-renter base with shorter leases.
- Zoned schools: Westside El (math 52% / reading 44%, grade D, #971 of 4,322 statewide, top 23%, 1,010 students, 78% FRL); Angleton J H School (math 26% / reading 41%, grade F, #911 of 1,662 statewide, top 56%, 1,561 students, 68% FRL); Angleton H S (math 22% / reading 45%, grade F, #1,011 of 1,632 statewide, top 63%, 2,066 students, 67% FRL) — zoned schools average 71% FRL vs 54% district-wide (17 pts higher); higher-poverty schools than district average — tighter screening recommended.
- Market conditions: 932 active listings in the ZIP; solid renter incomes; 3,960 units permitted in Brazoria County in 2024 (593 in 5+ unit buildings).
Forward outlook
- Local home prices are declining (-3.0%/yr); year-one equity from $1k of loan paydown is wiped out by about $4k of value loss. Plan a longer hold.
- Brazoria County population projected at +44% by 2050 — long-run rental-demand tailwind backs the buy-and-hold thesis.
Negotiation context
- It's been on market 67 days — a 6% lower offer ($141k) is reasonable based on typical stale-listing flexibility.
Risks & watch-outs
- Watch-outs: property tax is 3.0% of price; built in 1956 — expect roof / HVAC / electrical / plumbing capex.
- Climate carrying-cost: severe wind risk, 99% chance of damaging wind over 30y; major wildfire risk; extreme-heat days projected 7→25/yr by 2055 (HVAC capex compounding) — expect insurance premiums to compound above CPI over the hold.
Questions for the listing agent
- It's been on market 67 days. Have you received any prior offers? Is the seller open to a 6% concession, seller financing, or rate buy-down credit?
- Built in 1956 — when were the roof, HVAC, electrical panel, plumbing, and water heater last replaced?
- Property tax is high relative to price — has the assessment been appealed recently, and will the sale trigger a re-assessment?
- Why hasn't it sold? Are there any deal-killer items the seller is aware of (foundation, flood, title, zoning, code violations)?
- Is there a deadline driving the sale (1031 exchange, divorce, estate, relocation)? That informs how much negotiation room exists.
- Schools are D-rated, which usually means shorter tenancies and higher turnover. Who's the typical renter profile here, and what's been the actual vacancy rate?
- What's the average days-on-market for RENTAL listings here right now (not sales)? A rising rental-DOM trend means longer vacancies and softer asking-rent achievability than the comps imply.
- What's the recent tenant-quality profile in this submarket — average credit score on applications, eviction rate, late-payment / NSF rate, and stable-employment percentage? A property-management company in the area should have these aggregated.
- How much new for-sale + rental construction is in the pipeline within 1–3 miles? Heavy new supply typically softens prices + rents 12–24 months out; constrained supply supports both.
Investment metrics
- 1% rule
- 1.25% ✓
- Cap rate
- 8.35%
- Cash-on-cash
- 7.33%
- DSCR
- 1.33
- GRM
- 6.7
CMA / ARV
- ARV (median comp)
- $272,528
- List price
- $149,900
- Delta
- -45.00%
- Verdict
- UNDERPRICED
- Comps
- 20 within 1.0 mi
Show comp detail 6 sales within ~0.75 mi
| Address | Dist | Beds/Ba | Sqft | Sold | Price | $/sf | Match |
|---|---|---|---|---|---|---|---|
| 112 Walnut St | 0.06mi | 4/3.0 | 1,686 (-10%) | 4mo | $309,000 | $183 | 69 |
| 130 E Phillips Rd | 0.40mi | 3/2.0 (-1) | 1,786 (-5%) | 4mo | $130,000 | $73 | 61 |
| 113 Lostrocco St | 0.16mi | 4/2.0 | 1,988 (+6%) | 24mo | $285,000 | $143 | 58 |
| 227 E Phillips Rd E | 0.58mi | 4/2.0 | 1,950 (+4%) | 19mo | $330,000 | $169 | 46 |
| 2424 County Road 288 | 0.25mi | 3/3.0 (-1) | 2,152 (+15%) | 15mo | $325,000 | $151 | 38 |
| 230 E Phillips Rd | 0.50mi | 3/2.0 (-1) | 2,132 (+14%) | 16mo | $275,000 | $129 | 31 |
Match score weights: distance 35% · size 25% · config 20% · recency 20%. Top-matched comps best support the ARV.
Projected returns pro-forma
-3.0% appreciation · 3.0% rent growth · sell at horizon
- IRR
- -5.0%
- Equity multiple
- 0.81×
- Total profit
- $-7,815
- Equity at exit
- $22,351
- IRR
- 4.8%
- Equity multiple
- 1.35×
- Total profit
- $14,806
- Equity at exit
- $12,961
Cash invested: $41,972 (down + closing). Projections, not guarantees.
Landlord ↔ Tenant lean methodology
- Overall (STATE)
- 87 Strongly Landlord-Friendly
- State Texas
- 87 Strongly Landlord-Friendly · R+5
- County
- — inherits STATE
- City
- — inherits STATE
ZIP-level market 77515
- Home prices YoY
- -5.1%
- Active inventory
- 932
- Price-to-rent
- 6.7×
Monthly cashflow live
- Estimated rent
- $1,872 medium interval (Pro) →
- Mortgage (P&I)
- −$786
- Tax from tax record
- −$374 /mo · $4,485/yr
- Insurance
- −$62
- HOA
- −$0
- Vacancy / Maint / Mgmt
- −$393
- Net cashflow
- $256
Break-even live
Sensitivity live
| Price | -10% $341 | -5% $299 | +0% $256 | +5% $214 | +10% $172 |
|---|---|---|---|---|---|
| Rent | -10% $109 | -5% $182 | +0% $256 | +5% $330 | +10% $404 |
| Rate | -1.0pp $332 | -0.5pp $295 | base $256 | +0.5pp $218 | +1.0pp $178 |
UW: 25.0% down · 7.5% · 30yr · 1.5% tax · 5.0% vac · 8.0% maint · 8.0% mgmt
Financing live
Cash to close
- Down payment
- $37,475
- Closing costs
- $4,497
- Reserves months
- —
- Total cash needed
- —
Loan-product check · same deal, 3 products live
Conventional
25% down · 7.5% · 30yr
- Down + closing
- —
- Monthly P&I
- —
- Monthly cashflow
- —
- DSCR
- —
- Eligible?
- —
Personal DTI + credit; lowest rate.
DSCR
20% down · 8.5% · 30yr
- Down + closing
- —
- Monthly P&I
- —
- Monthly cashflow
- —
- DSCR
- —
- Eligible?
- —
No personal income docs; deal must DSCR.
Hard money
10% down · 12.0% · 12mo
- Down + closing
- —
- Monthly P&I
- —
- Monthly cashflow
- —
- DSCR
- —
- Eligible?
- —
Short-term bridge; refi at stabilization.
Listing history 15 events
-
2026-06-21days on market $149,900 Active 67 DOM
-
2026-06-18days on market $149,900 Active 64 DOM
-
2026-06-17days on market $149,900 Active 63 DOM
-
2026-06-16days on market $149,900 Active 62 DOM
-
2026-06-15days on market $149,900 Active 61 DOM
-
2026-06-13days on market $149,900 Active 59 DOM
-
2026-06-09days on market $149,900 Active 55 DOM
-
2026-06-08days on market $149,900 Active 54 DOM
-
2026-06-07days on market $149,900 Active 53 DOM
-
2026-06-04days on market $149,900 Active 50 DOM
-
2026-06-03days on market $149,900 Active 49 DOM
-
2026-06-02days on market $149,900 Active 48 DOM
-
2026-06-01days on market $149,900 Active 47 DOM
-
2026-05-31days on market $149,900 Active 46 DOM
-
2026-04-15$149,900 Active 685-char remark
Show marketing remark (685 chars)
Opportunity awaits with this spacious 4-bedroom, 2-bath home situated on nearly an acre just outside of town! Featuring a converted 2-car garage and a generous layout, this property offers the perfect canvas for those looking to add their personal touch and create their dream home. Nestled in a peaceful setting with plenty of room to roam, garden, or expand, you’ll enjoy the best of country-style living while still being conveniently close to town amenities. With a little vision and TLC, this fixer-upper has incredible potential—whether you’re an investor or a buyer ready to make it your own. Don’t miss out on this chance to turn potential into reality!
ⓘ Source: listings_history table (triggers on properties + properties_extension) + one-shot
backfill from property_details.listing_events for pre-trigger history.
Tax reassessment forecast TX · Resets to sale price
- Current annual tax
- $4,485 · $374/mo
- Projected year-2 tax
- $4,485 · $374/mo
- Expected delta
- $0/yr ($0/mo · 0.0%)
ⓘ Screening estimate from a state-policy table — verify with the county assessor before closing.
Climate risk First Street
- Flood 1/10 Low FEMA zone X (unshaded) · 0% chance over 30 yrs
- Wildfire 6/10 Major
- Heat 10/10 Extreme 7 d/yr ≥111°F today · 25 d/yr by 30 yrs out
- Wind 9/10 Extreme 99% chance of damaging wind over 30 yrs
- Air quality 2/10 Low 1 unhealthy d/yr today · 2 by 30 yrs out
Nearby sold comps map
Loading sold comps map…
Walkable amenities ~0.75 mi
Loading nearby amenities…
Taxation est. · year 1
- Rental income
- $22,462
- − Mortgage interest
- −$8,397
- − Property taxes
- −$4,485
- − Insurance
- −$750
- − Repairs & maintenance
- −$1,797
- − Management
- −$1,797
- − Depreciation
- −$4,361
- Taxable income
- $876
- Est. tax owed @ 24.0%
- −$210
- After-tax cash flow
- $2,867/yr
For passive investors: Depreciation is non-cash, so a rental often shows a tax loss while cash-flowing — sheltering income. Rental losses are passive: they offset passive income freely, and up to $25,000/yr can offset ordinary (W-2) income if you actively participate and your MAGI is under $100k (phasing out to $0 by $150k); unused losses carry forward. On sale, claimed depreciation is recaptured at up to 25%, and gains may owe capital-gains tax (a 1031 exchange can defer both). Figures are a year-1 estimate at your 24.0% rate — not tax advice; consult a CPA.
Schools (NCES district)
- District
- Angleton ISD
- NCES district ID
- 4808310
- Math proficiency
- 36% ▼ -8.00%
- Reading proficiency
- 44% ▲ 1.00%
- Median HH income
- $55,670
- Composite
- 35.01/100
- National rank
- #5046
- State rank
- #375 of 826 in TX
Livability — Angleton
- Score
- 74/100
- State rank
- #171
- US rank
- #4520
Category grades
Schools grade is shown separately in the Schools card above.
Census & demographics
- Census place
- Angleton, TX
- County
- Brazoria County · 374,982 people
- City population
- 34,088
- Metro
- Houston-The Woodlands-Sugar Land, TX
- Population (ZIP)
- 34,088
- Household income
- $88,787
- Rent vs Own
- Severe rent burden
- 785.0
Population outlook (Brazoria County) Hauer SSP2
- Today (2025)
- 420,414 people
- By 2030
- 457,585 · +8.8%
- By 2040
- 532,232 · +26.6%
- By 2050
- 605,399 · +44.0%
- By 2075
- 779,358 · +85.4%
- By 2100
- 883,759 · +110.2%
Race, ethnicity, and origin ACS 2023
- Neighborhood character
- Diverse neighborhood (Simpson 0.58)
- Race & ethnicity
- White 55% Hispanic / Latino 33% Two or more races 18% Black 8% Asian 2%
- Hispanic origin (detail)
- Mexican 28%
- Common ancestry
- Lithuanian 3% Romanian 2% Slovak 1%
- Foreign-born
- 8% · Canada, Vietnam
- Languages at home
- 78% English-only · Spanish 20% Other Asian/Pacific 1%
Political lean MEDSL · Brazoria
- 2024 margin
- R (+19.7) · D 39.5% · R 59.2% · Other 1.3%
- 2008→2024 swing
- +9.9pp toward D · 2008: -29.6pp · 2024: -19.7pp
- All cycles
- 2024: R+19.7 2020: R+18.2 2016: R+24.6 2012: R+34.2 2008: R+29.6
Not yet ingested
- Civics
- —
Market trends
- HPI YoY
- ▼ -15.59%
- Current HPI
- 288.7286
- Rent YoY
- —
- Metro
- Houston-The Woodlands-Sugar Land, TX
- State GDP YoY
- ▲ 3.95%
- F500 in state
- 110
Industry mix (Fortune 500 HQ in TX)
| Industry | F500 HQs | Revenue |
|---|---|---|
| Energy | 16 | $1,198B |
|
||
| Technology | 5 | $198B |
|
||
| Engineering / Construction | 4 | $72B |
|
||
| Energy Services | 3 | $60B |
|
||
| Utilities | 3 | $41B |
|
||
| Healthcare | 2 | $330B |
|
||
Price history
1 event — show timeline
- 2026-04-15 Listed $149,900 HARMLS
Property tax history
+5.0%/yrLatest (2025): $4,485 · -3.8% YoY. Source: county tax records.
Cash-flow waterfall
monthlySold comps — $/sqft
last 12 mo · ≤1 miLoading sold comps…