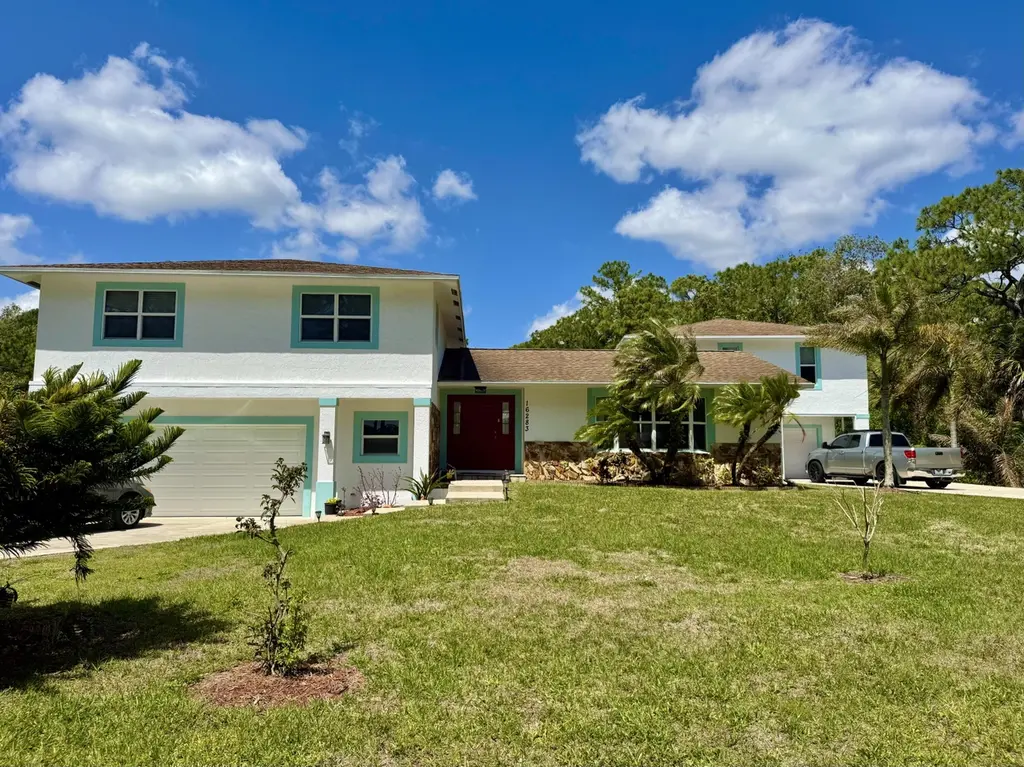
16283 Alexander Run · Jupiter Farms, FL
Flood risk 1/10 · Minimal
- FEMA flood zone
- X (unshaded)
- Chance of flooding over 30 yrs
- 0.0%
- Est. flood insurance / yr
- $507 – $1,088
Fire risk 3/10 · Minor
- Est. fire insurance / yr
- $947 – $1,759
Heat risk 9/10 · Severe
- Hot days now (above 106°F)
- 7 days/yr
- Hot days in 30 yrs
- 22 days/yr
Wind risk 10/10 · Severe
- Chance of severe wind over 30 yrs
- 99.0%
Air-quality risk 1/10 · Minimal
- Unhealthy air days now
- 0 days/yr
- Unhealthy air days in 30 yrs
- 0 days/yr
Risk factors via First Street. Map © Google.
Why this score? — see what drove the F grade
The composite is a weighted blend of 9 inputs, each scored 0–100. Each bar is that input's sub-score; the figure is the points it added to the 100-point composite (weight × sub-score).
- ARV discount +7.5/15.0
- Cash flow +6.4/30.0
- Schools +4.3/10.0
- Livability +3.3/5.0
- Rent growth +2.5/5.0
- Condition / age +2.5/5.0
- DSCR +0.7/10.0
- 1% rule +0.6/10.0
- Appreciation +0.0/10.0
$995,000
🖨 Deal sheet 📄 Offer letter ✓ Due diligence
Listing remarks
TWO HOMES for the Price of One! Well built & impeccably maintained Concrete Block home with Guest house located on over an acre in Jupiter Farms. The Main home offers an updated Kitchen with new appliances, 4 large bedrooms, 2 1/2 Bathrooms, Office, Garage, Impact glass Windows on upper floor and bay window, & screened patio. The detached CBS Guest house offers vaulted ceilings, Large Living Room with Full Kitchen, separate bedroom, full bathroom, laundry room, Gym, 1 Car Garage, private screened patio, ADA Stair/Chair Lift. This high & dry lot located on a paved road also has a regulation size Tennis Court, a detached 2 car garage workshop behind the tennis court & s
Key facts
- 1.09 acre lot
- 2 garage spots
- Built 1976
Property features AI
Finance
- Financial info: Pets allowed with no restrictions
Exterior
- Parking: Attached garage with 2 garage spaces; Two covered parking spaces; Concrete driveway
- Utilities: Well water; Septic tank; Electricity connected; Sewer connected; Water connected
- Home design: Single-family residence; Resale property; Faces east; Two-story
- Construction: Block/Concrete/CBS construction; Shingle roof; Built with CBS/block materials
- Exterior features: Screened porch; Open porch; Back yard fencing; Chain-link fence; Room for a pool; Paved public road access; Not waterfront
Interior
- Kitchen: Dishwasher; Electric range; Microwave; Refrigerator; Water purifier (owned); Water softener (owned)
- Bedrooms: Five main-level bedrooms
- Flooring: Carpet; Tile
- Bathrooms: Three full bathrooms; One half bathroom
- Heating & cooling: Central heating; Central air conditioning
- Interior features: Entrance foyer; Split bedroom layout; Wood-burning fireplace
- Laundry & utility: Electric water heater (owned)
Neighborhood map
What this means for you Summary
Snapshot
- This is a 4-bed/3.0-bath single-family listed at $995k.
Deal economics
- At list price, monthly cash flow is $-2k ($-21k/yr) — negative.
- To cash-flow at today's rent, offer at most $687k (31.0% below list).
- To meet the 1% rule (rent ≥ 1% of price), the offer needs to be $560k (43.7% below list).
- Recommended offer: $560k (43.7% below list) — sets the bar for 1% rule.
Location & tenants
- Location reads 66/100 on livability (#617 in FL) — a middle-class / working-renter tenant base. Strengths: crime A+, employment A+, housing A+; Watch: amenities F, commute F, cost of living F.
- Palm Beach (suburban): math 46% / reading 53% proficiency, ranked #34 of 73 in FL (top 47%) — families likely to look elsewhere, expect single-tenant / working-renter base with shorter leases.
- Zoned schools: Jupiter Farms Elementary School (math 83% / reading 82%, grade A+, #70 of 2,144 statewide, top 4%, 624 students, 21% FRL); Watson B. Duncan Middle School (math 54% / reading 59%, grade B, #171 of 571 statewide, top 30%, 1,157 students, 41% FRL); Jupiter High School (math 56% / reading 64%, grade C+, #106 of 667 statewide, top 16%, 3,087 students, 28% FRL) — zoned schools average 30% FRL vs 52% district-wide (22 pts lower); this property's tenant base skews higher-income than the district average.
- Zoned-school proficiency averages 66% at this address vs 50% district-wide (+17 pts) — the actual schools serving this property are materially stronger than the Palm Beach average implies; a family-tenant draw the district grade alone would hide.
- Market conditions: 126 active listings in the ZIP; 6 comparable units currently listed for rent nearby; rentals at typical pace (median 24d on market — plan ~3-4 weeks tenant-placement turnaround); 3,974 units permitted in Palm Beach County in 2024 (1,012 in 5+ unit buildings).
Forward outlook
- Local home prices are declining (-3.0%/yr); year-one equity from $7k of loan paydown is wiped out by about $30k of value loss. Plan a longer hold.
- Palm Beach County population projected at +30% by 2050 — long-run rental-demand tailwind backs the buy-and-hold thesis.
Negotiation context
- It's been on market 51 days — a 3% lower offer ($965k) is reasonable based on typical stale-listing flexibility.
Risks & watch-outs
- Climate carrying-cost: severe wind risk, 99% chance of damaging wind over 30y; extreme-heat days projected 7→22/yr by 2055 (HVAC capex compounding) — expect insurance premiums to compound above CPI over the hold.
Questions for the listing agent
- What do current leases actually rent for vs. the listed asking? Can we see a recent rent roll and the last 12 months of T-12 income?
- It's been on market 51 days. Have you received any prior offers? Is the seller open to a 44% concession, seller financing, or rate buy-down credit?
- Built in 1976 — when were the roof, HVAC, electrical panel, plumbing, and water heater last replaced?
- Is there a deadline driving the sale (1031 exchange, divorce, estate, relocation)? That informs how much negotiation room exists.
- Schools are D-rated, which usually means shorter tenancies and higher turnover. Who's the typical renter profile here, and what's been the actual vacancy rate?
- The area grade is low — what's the realistic commute time and amenity access for the typical tenant pool here? Any planned neighborhood developments (good or bad) we should know about?
- What's the average days-on-market for RENTAL listings here right now (not sales)? A rising rental-DOM trend means longer vacancies and softer asking-rent achievability than the comps imply.
- What's the recent tenant-quality profile in this submarket — average credit score on applications, eviction rate, late-payment / NSF rate, and stable-employment percentage? A property-management company in the area should have these aggregated.
- How much new for-sale + rental construction is in the pipeline within 1–3 miles? Heavy new supply typically softens prices + rents 12–24 months out; constrained supply supports both.
Investment metrics
- 1% rule
- 0.56% ✗
- Cap rate
- 4.19%
- Cash-on-cash
- -7.51%
- DSCR
- 0.67
- GRM
- 14.8
CMA / ARV
No comps found within radius.
Projected returns pro-forma
-3.0% appreciation · 3.0% rent growth · sell at horizon
- IRR
- -29.5%
- Equity multiple
- 0.02×
- Total profit
- $-272,636
- Equity at exit
- $148,358
- IRR
- -30.4%
- Equity multiple
- -0.37×
- Total profit
- $-381,831
- Equity at exit
- $86,029
Cash invested: $278,600 (down + closing). Projections, not guarantees.
Landlord ↔ Tenant lean methodology
- Overall (STATE)
- 87 Strongly Landlord-Friendly
- State Florida
- 87 Strongly Landlord-Friendly · R+3
- County
- — inherits STATE
- City
- — inherits STATE
ZIP-level market 33478
- Active inventory
- 126
- Price-to-rent
- 14.8×
Monthly cashflow live
- Estimated rent
- $5,599 high interval (Pro) →
- Mortgage (P&I)
- −$5,218
- Tax from tax record
- −$535 /mo · $6,414/yr
- Insurance
- −$415
- HOA
- −$0
- Vacancy / Maint / Mgmt
- −$1,176
- Net cashflow
- $-1,744
Break-even live
UW: 25.0% down · 7.5% · 30yr · 1.5% tax · 5.0% vac · 8.0% maint · 8.0% mgmt
Financing live
Cash to close
- Down payment
- $248,750
- Closing costs
- $29,850
- Reserves months
- —
- Total cash needed
- —
Loan-product check · same deal, 3 products live
Conventional
25% down · 7.5% · 30yr
- Down + closing
- —
- Monthly P&I
- —
- Monthly cashflow
- —
- DSCR
- —
- Eligible?
- —
Personal DTI + credit; lowest rate.
DSCR
20% down · 8.5% · 30yr
- Down + closing
- —
- Monthly P&I
- —
- Monthly cashflow
- —
- DSCR
- —
- Eligible?
- —
No personal income docs; deal must DSCR.
Hard money
10% down · 12.0% · 12mo
- Down + closing
- —
- Monthly P&I
- —
- Monthly cashflow
- —
- DSCR
- —
- Eligible?
- —
Short-term bridge; refi at stabilization.
Rent comps 6 comps
| Address | Beds | Baths | Sqft | Rent | $/sqft | DOM | Units | Dist |
|---|---|---|---|---|---|---|---|---|
| 16655 113th Trl N Jupiter, FL | 3.0 | 2.0 | 1907 | $4,700 | $2.46 | 15d | 1 | 0.75mi |
| 12523 169th Ct N Jupiter, FL | 3.0 | 2.0 | 1908 | $4,500 | $2.36 | 24d | 1 | 0.82mi |
| 12863 159th Ct N Jupiter, FL | 5.0 | 3.0 | 2296 | $6,000 | $2.61 | 24d | 1 | 0.83mi |
| 17119 Alexander Run Jupiter, FL | 3.0 | 2.0 | 2757 | $4,500 | $1.63 | 24d | 1 | 0.84mi |
| 11217 169th Ct N Jupiter, FL | 4.0 | 3.0 | 2142 | $5,500 | $2.57 | 16d | 1 | 1.04mi |
| 11405 175th Rd N Jupiter, FL | 4.0 | 3.0 | 2362 | $10,000 | $4.23 | 18d | 1 | 1.48mi |
Listing history 14 events
-
2026-06-18days on market $995,000 Active 51 DOM
-
2026-06-17days on market $995,000 Active 50 DOM
-
2026-06-16days on market $995,000 Active 49 DOM
-
2026-06-15days on market $995,000 Active 48 DOM
-
2026-06-13days on market $995,000 Active 46 DOM
-
2026-06-09days on market $995,000 Active 42 DOM
-
2026-06-08days on market $995,000 Active 41 DOM
-
2026-06-07days on market $995,000 Active 40 DOM
-
2026-06-04days on market $995,000 Active 37 DOM
-
2026-06-03days on market $995,000 Active 36 DOM
-
2026-06-02days on market $995,000 Active 35 DOM
-
2026-06-01days on market $995,000 Active 34 DOM
-
2026-05-31days on market $995,000 Active 33 DOM
-
2026-04-28$995,000 Active
ⓘ Source: listings_history table (triggers on properties + properties_extension) + one-shot
backfill from property_details.listing_events for pre-trigger history.
Tax reassessment forecast FL · Resets to sale price
- Current annual tax
- $6,414 · $535/mo
- Projected year-2 tax
- $8,258 · $688/mo
- Expected delta
- +$1,844/yr (+$154/mo · 28.8%)
ⓘ Screening estimate from a state-policy table — verify with the county assessor before closing.
Climate risk First Street
- Flood 1/10 Low FEMA zone X (unshaded) · 0% chance over 30 yrs
- Wildfire 3/10 Moderate
- Heat 9/10 Extreme 7 d/yr ≥106°F today · 22 d/yr by 30 yrs out
- Wind 10/10 Extreme 99% chance of damaging wind over 30 yrs
- Air quality 1/10 Low 0 unhealthy d/yr today · 0 by 30 yrs out
Nearby sold comps map
Loading sold comps map…
Walkable amenities ~0.75 mi
Loading nearby amenities…
Taxation est. · year 1
- Rental income
- $67,190
- − Mortgage interest
- −$55,735
- − Property taxes
- −$6,414
- − Insurance
- −$4,975
- − Repairs & maintenance
- −$5,375
- − Management
- −$5,375
- − Depreciation
- −$28,945
- Taxable loss
- −$39,630
- Est. tax savings @ 24.0%
- +$9,511
- After-tax cash flow
- $-11,412/yr
For passive investors: Depreciation is non-cash, so a rental often shows a tax loss while cash-flowing — sheltering income. Rental losses are passive: they offset passive income freely, and up to $25,000/yr can offset ordinary (W-2) income if you actively participate and your MAGI is under $100k (phasing out to $0 by $150k); unused losses carry forward. On sale, claimed depreciation is recaptured at up to 25%, and gains may owe capital-gains tax (a 1031 exchange can defer both). Figures are a year-1 estimate at your 24.0% rate — not tax advice; consult a CPA.
Schools (NCES district)
- District
- Palm Beach
- NCES district ID
- 1201500
- Math proficiency
- 46% ▼ -16.00%
- Reading proficiency
- 53% ▼ -4.00%
- Median HH income
- $53,943
- Composite
- 42.72/100
- National rank
- #3160
- State rank
- #34 of 73 in FL
Livability — Jupiter Farms
- Score
- 66/100
- State rank
- #617
- US rank
- #11894
Category grades
Schools grade is shown separately in the Schools card above.
Census & demographics
- Census place
- Jupiter Farms, FL
- Population (ZIP)
- 15,205
Population outlook (Palm Beach County) Hauer SSP2
- Today (2025)
- 1,637,487 people
- By 2030
- 1,743,255 · +6.5%
- By 2040
- 1,948,712 · +19.0%
- By 2050
- 2,132,979 · +30.3%
- By 2075
- 2,530,027 · +54.5%
- By 2100
- 2,706,979 · +65.3%
Race, ethnicity, and origin ACS 2023
- Neighborhood character
- Predominantly White (80%)
- Race & ethnicity
- White 80% Two or more races 14% Hispanic / Latino 8% Asian 3%
- Hispanic origin (detail)
- Puerto Rican 1% Cuban 1%
- Common ancestry
- Slovak 4% Romanian 4% Italian 3%
- Foreign-born
- 10% · Canada, China, Vietnam
- Languages at home
- 86% English-only · Spanish 5% Other Indo-European 4% Russian/Polish/Slavic 1%
Political lean MEDSL · Palm Beach
- 2024 margin
- Toss-up / Even · D 50.0% · R 49.2%
- 2008→2024 swing
- -22.1pp toward R · 2008: 22.9pp · 2024: 0.8pp
- All cycles
- 2024: D+0.8 2020: D+12.8 2016: D+15.3 2012: D+17.0 2008: D+22.9
Not yet ingested
- Civics
- —
Market trends
- HPI YoY
- ▼ -306.11%
- Current HPI
- 427.5178
- Rent YoY
- —
- Metro
- —
- State GDP YoY
- ▲ 3.28%
- F500 in state
- 36
Industry mix (Fortune 500 HQ in FL)
| Industry | F500 HQs | Revenue |
|---|---|---|
| Industrial Technology | 2 | $29B |
|
||
| Insurance | 2 | $17B |
|
||
| Retail | 1 | $60B |
|
||
| Technology Distribution | 1 | $58B |
|
||
| Homebuilding | 1 | $35B |
|
||
| Technology Manufacturing | 1 | $35B |
|
||
Price history
1 event — show timeline
- 2026-04-28 Listed $995,000 Beaches MLS
Property tax history
+0.6%/yrLatest (2025): $6,414 · +4.0% YoY. Source: county tax records.
Cash-flow waterfall
monthlySold comps — $/sqft
last 12 mo · ≤1 miLoading sold comps…