164 Saint Augustine Dr · Madison, MS
Flood risk 1/10 · Minimal
- FEMA flood zone
- X (unshaded)
- Chance of flooding over 30 yrs
- 0.0%
- Est. flood insurance / yr
- $507 – $1,088
Fire risk 1/10 · Minimal
- Est. fire insurance / yr
- $1,241 – $2,305
Heat risk 7/10 · Major
- Hot days now (above 108°F)
- 7 days/yr
- Hot days in 30 yrs
- 20 days/yr
Wind risk 8/10 · Major
- Chance of severe wind over 30 yrs
- 80.0%
Air-quality risk 2/10 · Minimal
- Unhealthy air days now
- 0 days/yr
- Unhealthy air days in 30 yrs
- 1 days/yr
Risk factors via First Street. Map © Google.
Why this score? — see what drove the B+ grade
The composite is a weighted blend of 9 inputs, each scored 0–100. Each bar is that input's sub-score; the figure is the points it added to the 100-point composite (weight × sub-score).
- Cash flow +30.0/30.0
- ARV discount +15.0/15.0
- DSCR +10.0/10.0
- 1% rule +9.3/10.0
- Schools +4.8/10.0
- Livability +4.0/5.0
- Rent growth +3.2/5.0
- Condition / age +2.2/5.0
- Appreciation +0.0/10.0
$164,000
🖨 Deal sheet 📄 Offer letter ✓ Due diligence
Listing remarks
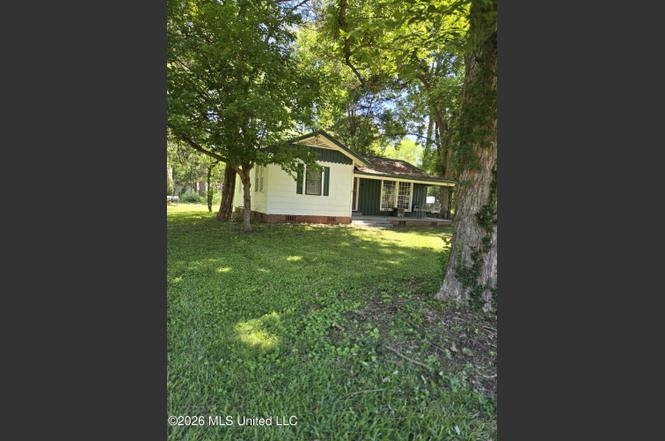
One-of-a-Kind Opportunity in the Heart of Madison! Don't miss this rare chance to own approximately 0.65 acres in one of Madison's most desirable locations! With a little TLC, this charming 3-bedroom, 1-bath home featuring a welcoming front porch could become the perfect starter home, rental property, or investment opportunity. Calling all hobbyists and handymen! The property includes a shop with electricity and a covered outdoor work area, making it ideal for projects, repairs, and weekend hobbies. Enjoy plenty of room for gardening, entertaining, children to play, and pets to roam on this spacious lot. Conveniently located with exceptional access to top-rated schools, churches, shopping,
Key facts
- 0.65 acres
- Spacious lot
- 0.65 acre lot
Tags
Property features AI
Exterior
- Parking: Gravel/unpaved parking
- Utilities: Public water; Public sewer; Electricity connected; Natural gas available; Sewer connected; Water connected
- Home design: Single-family house; One level; Masonry and shingle siding construction
- Construction: Conventional foundation; Asphalt shingle roof
- Exterior features: Porch; Partial fencing; Workshop; Few trees; Open, rectangular lot
Interior
- Kitchen: Free-standing electric range
- Flooring: Linoleum; Wood
- Bathrooms: 1 full bathroom
- Heating & cooling: Central heating; Central air conditioning
- Interior features: Free-standing electric range; Wood-frame windows
- Laundry & utility: Washer hookup; Electric dryer hookup
Neighborhood map
What this means for you Summary
Snapshot
- This is a 3-bed/1.0-bath single-family listed at $164k. Condition is rated fair.
Deal economics
- At list price, monthly cash flow is $719 ($9k/yr) — positive.
- The deal already cash-flows at list — no discount required.
- Meets the 1% rule at list price ($2k rent vs $164k).
- Cap rate 11.6% vs local median 3.7% in Madison — top-decile yield for the area; either an underpriced asset or a hidden risk that comps aren't pricing in. Stress-test before assuming the spread holds.
Location & tenants
- Location reads 81/100 on livability (#4 in MS, #1,556 nationally) — a professional / high-income tenant draw. Strengths: crime A+, employment A+, housing A+; Watch: amenities D-, commute F.
- Madison County School District (rural): math 54% / reading 54% proficiency, ranked #3 of 130 in MS (top 2%) — acceptable for families but not a draw, mixed tenant base, ~2y average lease.
- Zoned schools: Madison Avenue Lower Elementary (437 students, 99% FRL); Madison Central High School (math 5% / reading 63%, grade F, #78 of 197 statewide, top 39%, 1,246 students, 100% FRL) — zoned schools average 100% FRL vs 29% district-wide (70 pts higher); higher-poverty schools than district average — tighter screening recommended.
- Zoned-school proficiency averages 34% at this address vs 54% district-wide (-20 pts) — the specific schools serving this property underperform the Madison County School District average; the district grade overstates school quality for this exact location.
- Market conditions: Rents rising (+2.6%/yr); 628 active listings in the ZIP; high-income renter base; 553 units permitted in Madison County in 2024 (0 in 5+ unit buildings).
Forward outlook
- Local home prices are declining (-3.0%/yr); year-one equity from $1k of loan paydown is wiped out by about $5k of value loss. Plan a longer hold.
- Madison County population projected at +34% by 2050 — long-run rental-demand tailwind backs the buy-and-hold thesis.
- At projected returns (-3.0% appreciation + 2.6% rent growth), your $46k cash investment doubles in ~7 years — after that, you're playing with house money.
Negotiation context
- Only 6 days on market — expect competitive offers; lowballing is unlikely to land.
Risks & watch-outs
- Watch-outs: built in 1949 — expect roof / HVAC / electrical / plumbing capex.
- Climate carrying-cost: severe wind risk, 80% chance of damaging wind over 30y; extreme-heat days projected 7→20/yr by 2055 (HVAC capex compounding) — expect insurance premiums to compound above CPI over the hold.
Questions for the listing agent
- Have any recent inspections been done? Can we get a copy of the seller's disclosures and any deferred-maintenance estimates?
- Built in 1949 — when were the roof, HVAC, electrical panel, plumbing, and water heater last replaced?
- Is there a deadline driving the sale (1031 exchange, divorce, estate, relocation)? That informs how much negotiation room exists.
- Schools are A-rated — typically a magnet for longer-tenancy family renters. What's the average tenant stay here, and is there a school-zone premium baked into asking?
- What's the average days-on-market for RENTAL listings here right now (not sales)? A rising rental-DOM trend means longer vacancies and softer asking-rent achievability than the comps imply.
- What's the recent tenant-quality profile in this submarket — average credit score on applications, eviction rate, late-payment / NSF rate, and stable-employment percentage? A property-management company in the area should have these aggregated.
- How much new for-sale + rental construction is in the pipeline within 1–3 miles? Heavy new supply typically softens prices + rents 12–24 months out; constrained supply supports both.
Investment metrics
- 1% rule
- 1.43% ✓
- Cap rate
- 11.55%
- Cash-on-cash
- 18.79%
- DSCR
- 1.84
- GRM
- 5.8
CMA / ARV
- ARV (on-the-fly)
- $222,480
- Comps found
- 10
Show comp detail 10 sales within ~0.75 mi
| Address | Dist | Beds/Ba | Sqft | Sold | Price | $/sf | Match |
|---|---|---|---|---|---|---|---|
| 166 Cypress Dr | 0.09mi | 3/2.0 | 1,345 (+9%) | 2mo | $246,000 | $183 | 76 |
| 131 Cypress Dr | 0.15mi | 3/2.0 | 1,281 (+4%) | 9mo | $237,500 | $185 | 75 |
| 109 Twin Oaks Dr | 0.30mi | 3/2.0 | 1,288 (+4%) | 7mo | $239,000 | $186 | 69 |
| 232 Lisa Cir | 0.38mi | 3/2.0 | 1,314 (+6%) | 5mo | $228,500 | $174 | 64 |
| 456 Longwood Trl | 0.32mi | 3/2.0 | 1,332 (+8%) | 11mo | $240,000 | $180 | 59 |
| 250 Traceland Dr | 0.45mi | 3/2.0 | 1,305 (+6%) | 20mo | $219,900 | $169 | 49 |
| 420 Longwood Trl | 0.22mi | 3/2.0 | 1,411 (+14%) | 16mo | $245,000 | $174 | 48 |
| 557 Brookstone Cir | 0.74mi | 3/2.0 | 1,392 (+13%) | 15mo | $260,000 | $187 | 28 |
| 320 Pebble Creek Dr | 0.67mi | 3/2.0 | 1,420 (+15%) | 22mo | $219,000 | $154 | 22 |
| 304 Pebble Creek Dr | 0.72mi | 3/2.5 | 1,382 (+12%) | 23mo | $199,000 | $144 | 21 |
Match score weights: distance 35% · size 25% · config 20% · recency 20%. Top-matched comps best support the ARV.
Projected returns pro-forma
-3.0% appreciation · 2.61% rent growth · sell at horizon
- IRR
- 10.2%
- Equity multiple
- 1.40×
- Total profit
- $18,338
- Equity at exit
- $24,453
- IRR
- 19.0%
- Equity multiple
- 2.55×
- Total profit
- $71,349
- Equity at exit
- $14,180
Cash invested: $45,920 (down + closing). Projections, not guarantees.
Landlord ↔ Tenant lean methodology
- Overall (STATE)
- 90 Strongly Landlord-Friendly
- State Mississippi
- 90 Strongly Landlord-Friendly · R+11
- County
- — inherits STATE
- City
- — inherits STATE
ZIP-level market 39110
- Home prices YoY
- -28.3%
- Rents YoY
- 2.6%
- Active inventory
- 628
- Price-to-rent
- 5.8×
Monthly cashflow live
- Estimated rent
- $2,345 medium interval (Pro) →
- Mortgage (P&I)
- −$860
- Tax est. 1.5%
- −$205 /mo · $2,460/yr
- Insurance
- −$68
- HOA
- −$0
- Vacancy / Maint / Mgmt
- −$492
- Net cashflow
- $719
Break-even live
UW: 25.0% down · 7.5% · 30yr · 1.5% tax · 5.0% vac · 8.0% maint · 8.0% mgmt
Financing live
Cash to close
- Down payment
- $41,000
- Closing costs
- $4,920
- Reserves months
- —
- Total cash needed
- —
Loan-product check · same deal, 3 products live
Conventional
25% down · 7.5% · 30yr
- Down + closing
- —
- Monthly P&I
- —
- Monthly cashflow
- —
- DSCR
- —
- Eligible?
- —
Personal DTI + credit; lowest rate.
DSCR
20% down · 8.5% · 30yr
- Down + closing
- —
- Monthly P&I
- —
- Monthly cashflow
- —
- DSCR
- —
- Eligible?
- —
No personal income docs; deal must DSCR.
Hard money
10% down · 12.0% · 12mo
- Down + closing
- —
- Monthly P&I
- —
- Monthly cashflow
- —
- DSCR
- —
- Eligible?
- —
Short-term bridge; refi at stabilization.
Listing history 4 events
-
2026-06-16statusdays on market $164,000 Pending 6 DOM
-
2026-06-15days on market $164,000 Active 5 DOM
-
2026-06-14remarks 699-char remark
-
2026-06-14$164,000 Active 3 DOM
ⓘ Source: listings_history table (triggers on properties + properties_extension) + one-shot
backfill from property_details.listing_events for pre-trigger history.
Climate risk First Street
- Flood 1/10 Low FEMA zone X (unshaded) · 0% chance over 30 yrs
- Wildfire 1/10 Low
- Heat 7/10 Severe 7 d/yr ≥108°F today · 20 d/yr by 30 yrs out
- Wind 8/10 Severe 80% chance of damaging wind over 30 yrs
- Air quality 2/10 Low 0 unhealthy d/yr today · 1 by 30 yrs out
Nearby sold comps map
Loading sold comps map…
Walkable amenities ~0.75 mi
Loading nearby amenities…
Taxation est. · year 1
- Rental income
- $28,137
- − Mortgage interest
- −$9,187
- − Property taxes
- −$2,460
- − Insurance
- −$820
- − Repairs & maintenance
- −$2,251
- − Management
- −$2,251
- − Depreciation
- −$4,771
- Taxable income
- $6,398
- Est. tax owed @ 24.0%
- −$1,536
- After-tax cash flow
- $7,093/yr
For passive investors: Depreciation is non-cash, so a rental often shows a tax loss while cash-flowing — sheltering income. Rental losses are passive: they offset passive income freely, and up to $25,000/yr can offset ordinary (W-2) income if you actively participate and your MAGI is under $100k (phasing out to $0 by $150k); unused losses carry forward. On sale, claimed depreciation is recaptured at up to 25%, and gains may owe capital-gains tax (a 1031 exchange can defer both). Figures are a year-1 estimate at your 24.0% rate — not tax advice; consult a CPA.
Condition & rehab AI · 13 photos
This home requires moderate repairs and updates to improve its condition and value. Painting the exterior and updating the kitchen and bathroom would significantly enhance its appeal.
Repairs flagged
- Moderate kitchen cabinets — dated and in need of updating
- Moderate bathroom fixtures — dated and in need of updating
- Minor roof — visible wear, potential for minor leaks
- Moderate exterior paint — moderate paint wear
Value-add opportunities
- Resale paint exterior — Fresh paint can significantly improve curb appeal
- Resale update kitchen cabinets — Modern cabinets can enhance the home's appeal
- Resale update bathroom fixtures — Modern fixtures can make the bathroom more attractive
- Both landscaping — Well-maintained landscaping can improve both curb appeal and property value
Renovation cost estimate screening
| Repair item | Severity | Est. cost |
|---|---|---|
| kitchen cabinets · dated and in need of updating | Moderate | $3,000–15,000 |
| bathroom fixtures · dated and in need of updating | Moderate | $3,000–15,000 |
| roof · visible wear, potential for minor leaks | Minor | $500–3,000 |
| exterior paint · moderate paint wear | Moderate | $3,000–15,000 |
| Total estimated repair cost · 4 items | $9,500–48,000 |
Value-add ROI direction
- Resale paint exterior — Fresh paint can significantly improve curb appeal ↑
- Resale update kitchen cabinets — Modern cabinets can enhance the home's appeal ↑
- Resale update bathroom fixtures — Modern fixtures can make the bathroom more attractive ↑
- Both landscaping — Well-maintained landscaping can improve both curb appeal and property value ↑
ⓘ Cost ranges are severity-bucket heuristics (US national rule-of-thumb). Get contractor quotes + a written scope before underwriting a rehab budget.
Schools (NCES district)
- District
- Madison County School District
- NCES district ID
- 2802790
- Math proficiency
- 54% ▼ -7.00%
- Reading proficiency
- 54% ▼ -7.00%
- Median HH income
- $70,579
- Composite
- 48.08/100
- National rank
- #2188
- State rank
- #3 of 130 in MS
Livability — Madison
- Score
- 81/100
- State rank
- #4
- US rank
- #1556
Category grades
Schools grade is shown separately in the Schools card above.
Census & demographics
- Census place
- Madison, MS
- County
- Madison County · 75,005 people
- City population
- 50,443
- Metro
- Jackson, MS
- Population (ZIP)
- 50,443
- Household income
- $125,506
- Rent vs Own
- Severe rent burden
- 227.0
Population outlook (Madison County) Hauer SSP2
- Today (2025)
- 122,509 people
- By 2030
- 131,737 · +7.5%
- By 2040
- 148,930 · +21.6%
- By 2050
- 164,300 · +34.1%
- By 2075
- 197,495 · +61.2%
- By 2100
- 211,429 · +72.6%
Race, ethnicity, and origin ACS 2023
- Neighborhood character
- Predominantly White (76%)
- Race & ethnicity
- White 76% Black 15% Asian 4% Two or more races 3% Hispanic / Latino 2%
- Common ancestry
- Italian 6% Slovak 3% Lithuanian 3%
- Foreign-born
- 5% · China, Canada
- Languages at home
- 92% English-only · Spanish 2% Other Indo-European 2% Chinese 1%
Political lean MEDSL · Madison
- 2024 margin
- R (+17.3) · D 40.8% · R 58.0% · Other 1.2%
- 2008→2024 swing
- -1.7pp toward R · 2008: -15.6pp · 2024: -17.3pp
- All cycles
- 2024: R+17.3 2020: R+11.8 2016: R+16.1 2012: R+15.7 2008: R+15.6
Not yet ingested
- Civics
- —
Market trends
- HPI YoY
- ▼ -60.99%
- Current HPI
- 154.6909
- Rent YoY
- ▲ 2.61%
- Metro
- Jackson, MS
- State GDP YoY
- —
- F500 in state
- 0
Price history
1 event — show timeline
- 2026-06-09 Listed $164,000 MLSU
Cash-flow waterfall
monthlySold comps — $/sqft
last 12 mo · ≤1 miLoading sold comps…