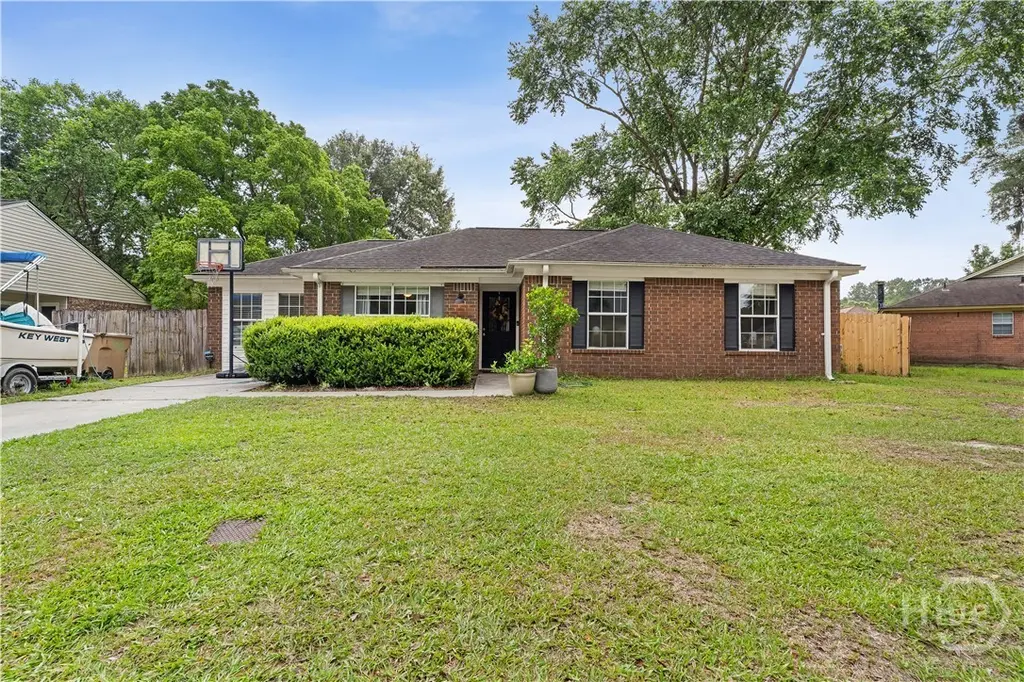
385 Sterling Creek Dr · Richmond Hill, GA
Flood risk 1/10 · Minimal
- FEMA flood zone
- X (unshaded)
- Chance of flooding over 30 yrs
- 0.0%
- Est. flood insurance / yr
- $507 – $1,088
Fire risk 3/10 · Minor
- Est. fire insurance / yr
- $963 – $1,789
Heat risk 9/10 · Severe
- Hot days now (above 108°F)
- 7 days/yr
- Hot days in 30 yrs
- 19 days/yr
Wind risk 8/10 · Major
- Chance of severe wind over 30 yrs
- 99.0%
Air-quality risk 2/10 · Minimal
- Unhealthy air days now
- 2 days/yr
- Unhealthy air days in 30 yrs
- 2 days/yr
Risk factors via First Street. Map © Google.
Why this score? — see what drove the D grade
The composite is a weighted blend of 9 inputs, each scored 0–100. Each bar is that input's sub-score; the figure is the points it added to the 100-point composite (weight × sub-score).
- Cash flow +13.6/30.0
- ARV discount +9.6/15.0
- Schools +4.5/10.0
- DSCR +4.1/10.0
- Livability +3.5/5.0
- 1% rule +3.1/10.0
- Rent growth +3.0/5.0
- Condition / age +2.5/5.0
- Appreciation +0.0/10.0
$280,000
🖨 Deal sheet (PDF) 📄 Offer letter ✓ Due diligence
Listing remarks MLS
Charming full brick 4bdrm/2ba situated on . 21 of an acre. Spacious living room opening to kitchen and eat in area. Laminate wood flooring through living and hall. Kitchen features tiled floors, pantry and breakfast bar. 4th bedroom or second living room/craft room/exercise room off of living room. Roof 2years new. Fenced back yard. No HOA! No required flood! Walk to High School. Go Wildcats! Bring your boats, work trucks and rv's. Home has brand new termite bond. USDA eligible.
Key facts
- Converted garage
- Sterling creek park
- 9,148 sq ft lot
Tags
Property features AI
Finance
- Other: Zoned for single-family residential (CITY zoning)
- HOA & community: Neighborhood features: park, street lights, curbs; Subdivision: Sterling Creek
Exterior
- Utilities: Public water; Public sewer; Underground utilities
- Home design: Single-family residence; Single-story
- Construction: Brick construction; Slab foundation; Asphalt roof; Built on a 0.21-acre lot
- Exterior features: Fire pit; Fenced yard; Asphalt road access
Interior
- Kitchen: Dishwasher; Disposal; Microwave; Range hood; Self-cleaning oven
- Bathrooms: 2 full bathrooms
- Heating & cooling: Central heating (electric); Heat pump cooling; Has heating and cooling
- Interior features: Pantry; Fireplace (outdoor fire pit noted under exterior)
- Laundry & utility: Washer hookup; Laundry located in kitchen; Electric water heater
Neighborhood map
What this means for you Summary
Snapshot
- This is a 4-bed/2.0-bath single-family listed at $280k.
Deal economics
- At list price, monthly cash flow is $18 ($210/yr) — positive.
- The deal already cash-flows at list — no discount required.
- To meet the 1% rule (rent ≥ 1% of price), the offer needs to be $228k (18.7% below list).
- Recommended offer: $228k (18.7% below list) — sets the bar for 1% rule.
- Cap rate 6.4% vs local median 4.2% in Richmond Hill — top-decile yield for the area; either an underpriced asset or a hidden risk that comps aren't pricing in. Stress-test before assuming the spread holds.
Location & tenants
- Location reads 69/100 on livability (#122 in GA) — a middle-class / working-renter tenant base. Strengths: housing A+, crime A, employment B; Watch: amenities F, commute F, health & safety F.
- Bryan County (rural): math 49% / reading 53% proficiency, ranked #14 of 174 in GA (top 8%) — acceptable for families but not a draw, mixed tenant base, ~2y average lease.
- Zoned schools: Richmond Hill Primary School (799 students, 37% FRL); Richmond Hill Middle School (math 49% / reading 61%, grade B-, #51 of 470 statewide, top 11%, 1,894 students, 25% FRL); Richmond Hill High School (math 32% / reading 58%, grade D-, #46 of 424 statewide, top 11%, 2,454 students, 23% FRL) — zoned schools at 28% FRL track the district average.
- Market conditions: Rents rising (+2.2%/yr); 483 active listings in the ZIP; 24 comparable units currently listed for rent nearby; rentals at typical pace (median 26d on market — plan ~3-4 weeks tenant-placement turnaround); 42% of comp listings sitting > 30 days — soft ceiling on asking rent; high-income renter base; 510 units permitted in Bryan County in 2024 (68 in 5+ unit buildings).
Forward outlook
- Local home prices are declining (-3.0%/yr); year-one equity from $2k of loan paydown is wiped out by about $8k of value loss. Plan a longer hold.
- Bryan County population projected at +64% by 2050 — long-run rental-demand tailwind backs the buy-and-hold thesis.
Negotiation context
- It's been on market 16 days — a 2% lower offer ($276k) is reasonable based on typical stale-listing flexibility.
- 3 sale attempts since 7y ago; this cycle's ask has dropped $15k (5%) from the opening price — seller is motivated, your offer sets the floor, not the list.
- Current owner paid $152k; list at $280k implies a 84% gain — meaningful room to come down on a strong offer.
Risks & watch-outs
- Climate carrying-cost: severe wind risk, 99% chance of damaging wind over 30y; extreme-heat days projected 7→19/yr by 2055 (HVAC capex compounding) — expect insurance premiums to compound above CPI over the hold.
Questions for the listing agent
- Is there a deadline driving the sale (1031 exchange, divorce, estate, relocation)? That informs how much negotiation room exists.
- Schools are B-rated — typically a magnet for longer-tenancy family renters. What's the average tenant stay here, and is there a school-zone premium baked into asking?
- The area grade is low — what's the realistic commute time and amenity access for the typical tenant pool here? Any planned neighborhood developments (good or bad) we should know about?
- What's the average days-on-market for RENTAL listings here right now (not sales)? A rising rental-DOM trend means longer vacancies and softer asking-rent achievability than the comps imply.
- What's the recent tenant-quality profile in this submarket — average credit score on applications, eviction rate, late-payment / NSF rate, and stable-employment percentage? A property-management company in the area should have these aggregated.
- How much new for-sale + rental construction is in the pipeline within 1–3 miles? Heavy new supply typically softens prices + rents 12–24 months out; constrained supply supports both.
Investment metrics
- 1% rule
- 0.81% ✗
- Cap rate
- 6.37%
- Cash-on-cash
- 0.27%
- DSCR
- 1.01
- GRM
- 10.2
CMA / ARV
- ARV (on-the-fly)
- $293,511
- Comps found
- 12
Show comp detail 12 sales within ~0.75 mi
| Address | Dist | Beds/Ba | Sqft | Sold | Price | $/sf | Match |
|---|---|---|---|---|---|---|---|
| 160 Wild Honey Ct | 0.15mi | 3/2.0 (-1) | 1,311 (+1%) | 10mo | $330,000 | $252 | 78 |
| 109 Rice Gate Dr | 0.22mi | 3/2.0 (-1) | 1,365 (+6%) | 1mo | $310,000 | $227 | 75 |
| 900 Osprey Dr | 0.38mi | 3/2.0 (-1) | 1,245 (-4%) | 3mo | $303,000 | $243 | 68 |
| 26 Whippoorwill Ln E | 0.51mi | 3/2.0 (-1) | 1,323 (+2%) | 2mo | $283,000 | $214 | 66 |
| 135 Reese Dr | 0.16mi | 3/2.0 (-1) | 1,455 (+12%) | 2mo | $330,000 | $227 | 65 |
| 207 Osprey Dr | 0.57mi | 3/2.0 (-1) | 1,318 (+2%) | 2mo | $302,000 | $229 | 64 |
| 873 Piercefield Dr | 0.51mi | 4/2.0 | 1,422 (+10%) | 0mo | $330,000 | $232 | 59 |
| 366 Osprey Dr | 0.61mi | 3/2.0 (-1) | 1,348 (+4%) | 3mo | $299,900 | $222 | 57 |
| 196 Bald Eagle Dr | 0.74mi | 3/2.0 (-1) | 1,318 (+2%) | 10mo | $295,000 | $224 | 49 |
| 74 Brown Thrasher Ct | 0.72mi | 3/2.0 (-1) | 1,257 (-3%) | 9mo | $300,000 | $239 | 49 |
| 89 Brisbon Hall Dr | 0.43mi | 3/2.0 (-1) | 1,486 (+15%) | 3mo | $330,000 | $222 | 48 |
| 310 Osprey Dr | 0.61mi | 3/2.0 (-1) | 1,446 (+12%) | 5mo | $269,400 | $186 | 43 |
Match score weights: distance 35% · size 25% · config 20% · recency 20%. Top-matched comps best support the ARV.
Projected returns pro-forma
-3.0% appreciation · 2.17% rent growth · sell at horizon
- IRR
- -16.8%
- Equity multiple
- 0.41×
- Total profit
- $-46,202
- Equity at exit
- $41,749
- IRR
- -10.1%
- Equity multiple
- 0.40×
- Total profit
- $-46,651
- Equity at exit
- $24,209
Cash invested: $78,400 (down + closing). Projections, not guarantees.
Landlord ↔ Tenant lean methodology
- Overall (STATE)
- 90 Strongly Landlord-Friendly
- State Georgia
- 90 Strongly Landlord-Friendly · R+3
- County
- — inherits STATE
- City
- — inherits STATE
ZIP-level market 31324
- Home prices YoY
- -30.8%
- Rents YoY
- 2.2%
- Active inventory
- 483
- Price-to-rent
- 10.2×
Monthly cashflow live
- Estimated rent
- $2,278 high interval (Pro) →
- Mortgage (P&I)
- −$1,468
- Tax from tax record
- −$197 /mo · $2,362/yr
- Insurance
- −$117
- HOA
- −$0
- Vacancy / Maint / Mgmt
- −$478
- Net cashflow
- $18
Break-even live
Sensitivity live
| Price | -10% $176 | -5% $97 | +0% $18 | +5% $-62 | +10% $-141 |
|---|---|---|---|---|---|
| Rent | -10% $-162 | -5% $-72 | +0% $18 | +5% $107 | +10% $197 |
| Rate | -1.0pp $159 | -0.5pp $89 | base $18 | +0.5pp $-55 | +1.0pp $-129 |
UW: 25.0% down · 7.5% · 30yr · 1.5% tax · 5.0% vac · 8.0% maint · 8.0% mgmt
Financing live
Cash to close
- Down payment
- $70,000
- Closing costs
- $8,400
- Reserves months
- —
- Total cash needed
- —
Loan-product check · same deal, 3 products live
Conventional
25% down · 7.5% · 30yr
- Down + closing
- —
- Monthly P&I
- —
- Monthly cashflow
- —
- DSCR
- —
- Eligible?
- —
Personal DTI + credit; lowest rate.
DSCR
20% down · 8.5% · 30yr
- Down + closing
- —
- Monthly P&I
- —
- Monthly cashflow
- —
- DSCR
- —
- Eligible?
- —
No personal income docs; deal must DSCR.
Hard money
10% down · 12.0% · 12mo
- Down + closing
- —
- Monthly P&I
- —
- Monthly cashflow
- —
- DSCR
- —
- Eligible?
- —
Short-term bridge; refi at stabilization.
Rent comps 24 comps
| Address | Beds | Baths | Sqft | Rent | $/sqft | DOM | Units | Dist |
|---|---|---|---|---|---|---|---|---|
| 348 Sterling Creek Dr Richmond Hill, GA | 3.0 | 2.0 | 1247 | $1,950 | $1.56 | 46d | 1 | 0.06mi |
| 43 Teal Lake Dr Richmond Hill, GA | 3.0 | 2.0 | 1659 | $2,200 | $1.33 | 23d | 1 | 0.35mi |
| 170 Teal Lake Dr Richmond Hill, GA | 3.0 | 2.0 | 1222 | $2,000 | $1.64 | 46d | 1 | 0.47mi |
| 286 Teal Lake Dr Unit 1244796P Richmond Hill, GA | 4.0 | 2.0 | 1399 | $2,641 | $1.89 | 16d | 1 | 0.49mi |
| 70 Vining Way Unit 2 Richmond Hill, GA | 3.0 | 2.5 | 1548 | $2,000 | $1.29 | 25d | 1 | 0.52mi |
| 494 Osprey Dr Richmond Hill, GA | 3.0 | 2.0 | 1148 | $1,950 | $1.70 | 25d | 1 | 0.62mi |
| 145 Conner Loop Richmond Hill, GA | 3.0 | 2.5 | 1297 | $1,800 | $1.39 | 46d | 1 | 0.64mi |
| 505 Harris Trail Rd Richmond Hill, GA | 1.0–3.0 | 1.0–2.0 | 960 | $1,851 | $1.93 | 46d | 24 | 0.64mi |
| 505 Harris Trail Rd Richmond Hill, GA | 1.0–3.0 | 1.0–2.0 | 960 | $1,851 | $1.93 | 16d | 31 | 0.64mi |
| 78 Mallard Ln Richmond Hill, GA | 3.0 | 2.0 | 1094 | $1,850 | $1.69 | 46d | 1 | 0.65mi |
| 13 Cypress Ln Richmond Hill, GA | 3.0 | 2.5 | 1292 | $1,925 | $1.49 | 23d | 1 | 0.68mi |
| 707 Ferguson Ln Richmond Hill, GA | 3.0 | 2.5 | 1507 | $2,099 | $1.39 | 46d | 1 | 0.75mi |
| 70 Quail Ln Richmond Hill, GA | 4.0 | 2.5 | 1695 | $2,650 | $1.56 | 25d | 1 | 0.79mi |
| 66 Egret Cir Richmond Hill, GA | 4.0 | 2.0 | 1446 | $2,150 | $1.49 | 46d | 1 | 0.87mi |
| 89 Blue Lake St Richmond Hill, GA | 3.0 | 2.0 | 1353 | $2,100 | $1.55 | 25d | 1 | 0.94mi |
| 110 Cantle Dr Richmond Hill, GA | 3.0 | 2.5 | 1556 | $1,900 | $1.22 | 46d | 1 | 0.99mi |
| 375 Cantle Dr Richmond Hill, GA | 3.0 | 2.5 | 1461 | $1,900 | $1.30 | 46d | 1 | 0.99mi |
| 35 Sandpiper Rd Richmond Hill, GA | 3.0 | 2.0 | 1296 | $1,900 | $1.47 | 25d | 1 | 0.99mi |
| 440 Cantle Dr Richmond Hill, GA | 3.0 | 2.5 | 1516 | $1,875 | $1.24 | 23d | 1 | 1.00mi |
| 123 Alexander Way Richmond Hill, GA | 3.0 | 2.0 | 1272 | $2,000 | $1.57 | 23d | 1 | 1.15mi |
| 1603 Waybridge Way Richmond Hill, GA | 3.0 | 2.5 | 1461 | $2,110 | $1.44 | 23d | 5 | 1.34mi |
| 23 Crossing Dr Richmond Hill, GA | 3.0 | 2.5 | 1753 | $2,500 | $1.43 | 25d | 1 | 1.37mi |
| 88 Magnolia St Richmond Hill, GA | 3.0 | 2.0 | 1242 | $3,500 | $2.82 | 46d | 1 | 1.44mi |
| 11 Holly Hill Park Dr Unit 11 Richmond Hill, GA | 3.0 | 2.0 | 1056 | $1,500 | $1.42 | 25d | 1 | 1.47mi |
Listing history 12 events
-
2026-06-21pricedays on market $280,000 Active 16 DOM
-
2026-06-18days on market $295,000 Active 13 DOM
-
2026-06-17days on market $295,000 Active 12 DOM
-
2026-06-16days on market $295,000 Active 11 DOM
-
2026-06-15days on market $295,000 Active 10 DOM
-
2026-06-14days on market $295,000 Active 8 DOM
-
2026-06-13days on market $295,000 Active 7 DOM
-
2026-06-10days on market $295,000 Active 5 DOM
-
2026-06-09days on market $295,000 Active 4 DOM
-
2026-06-08days on market $295,000 Active 3 DOM
-
2026-06-07remarks 699-char remark
-
2026-06-07$295,000 Active 2 DOM
ⓘ Source: listings_history table (triggers on properties + properties_extension) + one-shot
backfill from property_details.listing_events for pre-trigger history.
Tax reassessment forecast GA · Resets to sale price
- Current annual tax
- $2,362 · $197/mo
- Projected year-2 tax
- $2,576 · $215/mo
- Expected delta
- +$214/yr (+$18/mo · 9.0%)
ⓘ Screening estimate from a state-policy table — verify with the county assessor before closing.
Climate risk First Street
- Flood 1/10 Low FEMA zone X (unshaded) · 0% chance over 30 yrs
- Wildfire 3/10 Moderate
- Heat 9/10 Extreme 7 d/yr ≥108°F today · 19 d/yr by 30 yrs out
- Wind 8/10 Severe 99% chance of damaging wind over 30 yrs
- Air quality 2/10 Low 2 unhealthy d/yr today · 2 by 30 yrs out
Nearby sold comps map
Loading sold comps map…
Walkable amenities ~0.75 mi
Loading nearby amenities…
Taxation est. · year 1
- Rental income
- $27,333
- − Mortgage interest
- −$15,684
- − Property taxes
- −$2,362
- − Insurance
- −$1,400
- − Repairs & maintenance
- −$2,187
- − Management
- −$2,187
- − Depreciation
- −$8,145
- Taxable loss
- −$4,633
- Est. tax savings @ 24.0%
- +$1,112
- After-tax cash flow
- $1,322/yr
For passive investors: Depreciation is non-cash, so a rental often shows a tax loss while cash-flowing — sheltering income. Rental losses are passive: they offset passive income freely, and up to $25,000/yr can offset ordinary (W-2) income if you actively participate and your MAGI is under $100k (phasing out to $0 by $150k); unused losses carry forward. On sale, claimed depreciation is recaptured at up to 25%, and gains may owe capital-gains tax (a 1031 exchange can defer both). Figures are a year-1 estimate at your 24.0% rate — not tax advice; consult a CPA.
Schools (NCES district)
- District
- Bryan County
- NCES district ID
- 1300570
- Math proficiency
- 49% ▼ -2.00%
- Reading proficiency
- 53% ▼ -2.00%
- Median HH income
- $64,465
- Composite
- 44.99/100
- National rank
- #2701
- State rank
- #14 of 174 in GA
Livability — Richmond Hill
- Score
- 69/100
- State rank
- #122
- US rank
- #8778
Category grades
Schools grade is shown separately in the Schools card above.
Census & demographics
- Census place
- Richmond Hill, GA
- County
- Bryan County · 37,406 people
- City population
- 37,406
- Metro
- Savannah, GA
- Population (ZIP)
- 37,406
- Household income
- $122,378
- Rent vs Own
- Severe rent burden
- 562.0
Population outlook (Bryan County) Hauer SSP2
- Today (2025)
- 45,980 people
- By 2030
- 51,583 · +12.2%
- By 2040
- 63,184 · +37.4%
- By 2050
- 75,400 · +64.0%
- By 2075
- 105,363 · +129.1%
- By 2100
- 124,959 · +171.8%
Race, ethnicity, and origin ACS 2023
- Neighborhood character
- Predominantly White (70%)
- Race & ethnicity
- White 70% Black 12% Hispanic / Latino 9% Two or more races 8% Asian 3%
- Hispanic origin (detail)
- Mexican 2% Puerto Rican 5%
- Common ancestry
- Lithuanian 3% Romanian 2% Slovak 2%
- Foreign-born
- 6% · Canada, Jamaica
- Languages at home
- 89% English-only · Spanish 7% Other Indo-European 2% German/W. Germanic 1%
Political lean MEDSL · Bryan
- 2024 margin
- Solid R (+36.3) · D 31.6% · R 67.9%
- 2008→2024 swing
- +6.3pp toward D · 2008: -42.6pp · 2024: -36.3pp
- All cycles
- 2024: R+36.3 2020: R+35.2 2016: R+43.2 2012: R+43.6 2008: R+42.6
Not yet ingested
- Civics
- —
Market trends
- HPI YoY
- ▼ -95.54%
- Current HPI
- 215.1789
- Rent YoY
- ▲ 2.17%
- Metro
- Savannah, GA
- State GDP YoY
- ▲ 2.66%
- F500 in state
- 28
Industry mix (Fortune 500 HQ in GA)
| Industry | F500 HQs | Revenue |
|---|---|---|
| Paper / Packaging | 2 | $29B |
|
||
| Retail | 1 | $160B |
|
||
| Transportation / Logistics | 1 | $91B |
|
||
| Airlines | 1 | $62B |
|
||
| Consumer Goods | 1 | $47B |
|
||
| Utilities | 1 | $25B |
|
||
Price history
+90.4% since first listed5 events — show timeline
- 2026-06-04 Listed $295,000 Hive MLS
- 2020-01-17 Sold (Public Records) $152,500 Public Records
- 2020-01-08 Sold (MLS) $152,500 Hive MLS
- 2019-09-05 Listed $154,900 Hive MLS
- 2019-09-05 Listed $154,900 Hive MLS
Property tax history
+17.8%/yrLatest (2025): $2,362 · -2.5% YoY. Source: county tax records.
Cash-flow waterfall
monthlySold comps — $/sqft
last 12 mo · ≤1 miLoading sold comps…