130 Bradhurst Ave #702 · New York, NY
Flood risk 6/10 · Moderate
- FEMA flood zone
- X (unshaded)
- Chance of flooding over 30 yrs
- 0.27%
- Est. flood insurance / yr
- $507 – $1,088
Fire risk 1/10 · Minimal
- Est. fire insurance / yr
- $691 – $1,283
Heat risk 6/10 · Moderate
- Hot days now (above 99°F)
- 7 days/yr
- Hot days in 30 yrs
- 15 days/yr
Wind risk 5/10 · Moderate
- Chance of severe wind over 30 yrs
- 26.0%
Air-quality risk 4/10 · Minor
- Unhealthy air days now
- 5 days/yr
- Unhealthy air days in 30 yrs
- 6 days/yr
Risk factors via First Street. Map © Google.
Why this score? — see what drove the D grade
The composite is a weighted blend of 9 inputs, each scored 0–100. Each bar is that input's sub-score; the figure is the points it added to the 100-point composite (weight × sub-score).
- Appreciation +10.0/10.0
- ARV discount +7.5/15.0
- Cash flow +5.4/30.0
- Schools +5.0/10.0
- 1% rule +4.6/10.0
- Rent growth +4.2/5.0
- Livability +3.8/5.0
- Condition / age +2.5/5.0
- DSCR +0.0/10.0
$499,000
🖨 Deal sheet (PDF) 📄 Offer letter ✓ Due diligence
Listing remarks
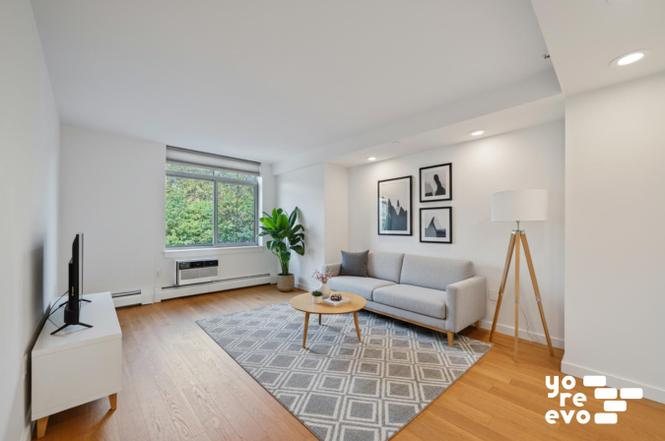
Very high income limit! $267,300 for a family of four or fewer. 130 Bradhurst Ave #702 is the renovated two-bedroom youve been waiting for!Commuting to midtown is shockingly easy with the A, C, B, D and 3 trains all within five minutes. Columbus Circle is just 20 minutes away!The apartment overlooks Jackie Robinson Park and features large windows that bring in great natural light. The apartment underwent a full renovation with the pass-through kitchen featuring quartz countertops, modern cabinetry, ceramic tile backsplash, and stainless steel appliances including a Bosch refrigerator. Throughout the apartment is through the wall air conditioning. Both bedrooms were built with sound isolatio
Key facts
- Large windows
- Quartz countertops
- Modern cabinetry
Tags
Property features AI
Finance
- Other: Pets allowed in building
- Financial info: Association fee: $1,399 monthly
- HOA & community: Monthly association fee
Exterior
- Parking: Has garage
- Security: Concierge
- Home design: Condo/co-op building (ELLINGTON ON THE PA); Entry at ground level; West-facing exposure
- Construction: Elevator-served building; Health club in building; Bike storage
- Exterior features: Building courtyard; Private outdoor space (under 60 sqft); Courtyard
Interior
- Kitchen: Dishwasher; Microwave; Stainless steel appliances
- Bedrooms: Total of 4 rooms (configuration not specified)
- Flooring: Hardwood
- Bathrooms: 1 full bathroom
- Interior features: Unfurnished; Hardwood floors
- Laundry & utility: In-unit laundry
Neighborhood map
What this means for you Summary
Snapshot
- This is a 2-bed/1.0-bath condo listed at $499k.
Deal economics
- At list price, monthly cash flow is $-1k ($-13k/yr) — negative.
- To cash-flow at today's rent, offer at most $343k (31.3% below list).
- To meet the 1% rule (rent ≥ 1% of price), the offer needs to be $477k (4.5% below list).
- Recommended offer: $343k (31.3% below list) — sets the bar for cash-flow.
- Cap rate 3.7% vs local median 2.6% in New York — top-decile yield for the area; either an underpriced asset or a hidden risk that comps aren't pricing in. Stress-test before assuming the spread holds.
Location & tenants
- Location reads 75/100 on livability (#268 in NY, #4,188 nationally) — a middle-class / working-renter tenant base. Strengths: amenities A+, commute A+, health & safety A; Watch: crime F, cost of living F.
- Zoned schools: Elm Tree Elementary School (math 27% / reading 52%, grade F, #1,444 of 2,108 statewide, top 71%, 806 students, 94% FRL); Mark Twain Is 239 For The Gifted And Talented (math 90% / reading 96%, grade A+, #6 of 729 statewide, top 1%, 1,207 students, 44% FRL); Midwood High School (math 94% / reading 96%, grade A+, #83 of 1,100 statewide, top 8%, 4,062 students, 73% FRL).
- Market conditions: Rents rising fast (+6.7%/yr); 42 active listings in the ZIP; 10 comparable units currently listed for rent nearby; rentals leasing fast (median 14d on market — plan ~1-2 weeks tenant-placement turnaround); 4,467 units permitted in New York County in 2024 (4,463 in 5+ unit buildings).
- At $4,768/mo this rent would consume 126% of the median local household income ($45k/yr) (locally 2826% of renters already pay >50% of income on rent) — very limited rent-growth headroom before tenants either downsize or default.
Forward outlook
- In year one you build about $53k of equity ($3k loan paydown + $50k appreciation (10.0% local appreciation)).
- New York County population projected at +21% by 2050 — long-run rental-demand tailwind backs the buy-and-hold thesis.
- By year 2, paydown + projected appreciation supports a ~$86k cash-out refi (75% LTV) — recoverable capital for the next deal without selling this one.
Negotiation context
- It's been on market 262 days — a 12% lower offer ($439k) is reasonable based on typical stale-listing flexibility.
- 2 sale attempts since 3y ago; this cycle's ask has dropped $100k (17%) from the opening price — seller is motivated, your offer sets the floor, not the list.
Risks & watch-outs
- Watch-outs: HOA is 29% of rent.
- Climate carrying-cost: major flood risk; moderate wind risk, 26% chance of damaging wind over 30y; extreme-heat days projected 7→15/yr by 2055 (HVAC capex compounding) — expect insurance premiums to compound above CPI over the hold.
Questions for the listing agent
- What do current leases actually rent for vs. the listed asking? Can we see a recent rent roll and the last 12 months of T-12 income?
- It's been on market 262 days. Have you received any prior offers? Is the seller open to a 31% concession, seller financing, or rate buy-down credit?
- What does the HOA fee cover, when was the last increase, and are there any pending special assessments or reserve-fund shortfalls?
- Any open or pending special assessments — roof, HVAC, plumbing, elevator, façade? What's the per-unit balance and payoff schedule, and is the seller paying it off at close or rolling it to the buyer?
- Why hasn't it sold? Are there any deal-killer items the seller is aware of (foundation, flood, title, zoning, code violations)?
- Is there a deadline driving the sale (1031 exchange, divorce, estate, relocation)? That informs how much negotiation room exists.
- Schools are B-rated — typically a magnet for longer-tenancy family renters. What's the average tenant stay here, and is there a school-zone premium baked into asking?
- Crime grade is F in this area — have there been break-ins, vandalism, or insurance claims at this property in the last 3 years? What carrier currently insures it and at what premium?
- The area grade is low — what's the realistic commute time and amenity access for the typical tenant pool here? Any planned neighborhood developments (good or bad) we should know about?
- What's the average days-on-market for RENTAL listings here right now (not sales)? A rising rental-DOM trend means longer vacancies and softer asking-rent achievability than the comps imply.
- What's the recent tenant-quality profile in this submarket — average credit score on applications, eviction rate, late-payment / NSF rate, and stable-employment percentage? A property-management company in the area should have these aggregated.
- How much new apartment / multifamily construction is in the pipeline within 1–3 miles? Heavy new supply (>2% of stock underway) typically softens rents 12–24 months out; light construction supports rent growth.
Investment metrics
- 1% rule
- 0.96% ✗
- Cap rate
- 3.69%
- Cash-on-cash
- -9.28%
- DSCR
- 0.59
- GRM
- 8.7
CMA / ARV
No comps found within radius.
Projected returns pro-forma
10.0% appreciation · 6.68% rent growth · sell at horizon
- IRR
- 19.2%
- Equity multiple
- 2.59×
- Total profit
- $222,167
- Equity at exit
- $449,539
- IRR
- 18.9%
- Equity multiple
- 6.39×
- Total profit
- $753,301
- Equity at exit
- $969,447
Cash invested: $139,720 (down + closing). Projections, not guarantees.
Landlord ↔ Tenant lean methodology
- Overall (CITY)
- 0 Strongly Tenant-Friendly
- State New York
- 15 Strongly Tenant-Friendly · D+10
- County
- — inherits STATE
- City New York
- 0 Strongly Tenant-Friendly · D+34
ZIP-level market 10039
- Home prices YoY
- 2.6%
- Rents YoY
- 6.7%
- Active inventory
- 42
- Price-to-rent
- 8.7×
Monthly cashflow live
- Estimated rent
- $4,768 high interval (Pro) →
- Mortgage (P&I)
- −$2,617
- Tax est. 1.5%
- −$624 /mo · $7,485/yr
- Insurance
- −$208
- HOA
- −$1,399
- Vacancy / Maint / Mgmt
- −$1,001
- Net cashflow
- $-1,081
Break-even live
Sensitivity live
| Price | -10% $-736 | -5% $-908 | +0% $-1,081 | +5% $-1,253 | +10% $-1,426 |
|---|---|---|---|---|---|
| Rent | -10% $-1,458 | -5% $-1,269 | +0% $-1,081 | +5% $-893 | +10% $-704 |
| Rate | -1.0pp $-830 | -0.5pp $-954 | base $-1,081 | +0.5pp $-1,210 | +1.0pp $-1,342 |
UW: 25.0% down · 7.5% · 30yr · 1.5% tax · 5.0% vac · 8.0% maint · 8.0% mgmt
Financing live
Cash to close
- Down payment
- $124,750
- Closing costs
- $14,970
- Reserves months
- —
- Total cash needed
- —
Loan-product check · same deal, 3 products live
Conventional
25% down · 7.5% · 30yr
- Down + closing
- —
- Monthly P&I
- —
- Monthly cashflow
- —
- DSCR
- —
- Eligible?
- —
Personal DTI + credit; lowest rate.
DSCR
20% down · 8.5% · 30yr
- Down + closing
- —
- Monthly P&I
- —
- Monthly cashflow
- —
- DSCR
- —
- Eligible?
- —
No personal income docs; deal must DSCR.
Hard money
10% down · 12.0% · 12mo
- Down + closing
- —
- Monthly P&I
- —
- Monthly cashflow
- —
- DSCR
- —
- Eligible?
- —
Short-term bridge; refi at stabilization.
Rent comps 10 comps
| Address | Beds | Baths | Sqft | Rent | $/sqft | DOM | Units | Dist |
|---|---|---|---|---|---|---|---|---|
| 300 W 135th St Unit 9G New York, NY | 3.0 | 2.0 | 1032 | $5,500 | $5.33 | 6d | 1 | 0.68mi |
| 132 W 134th St New York, NY | 2.0 | 1.0 | 750 | $4,500 | $6.00 | 26d | 1 | 0.76mi |
| 230 W 126th St Unit 20C New York, NY | 2.0 | 1.0 | 860 | $4,555 | $5.30 | 26d | 1 | 1.12mi |
| 2413 3rd Ave Bronx, NY | 1.0–3.0 | 1.0–2.0 | 857 | $4,022 | $4.69 | 1d | 21 | 1.23mi |
| 5 Lincoln Ave Bronx, NY | 1.0–3.0 | 1.0–2.5 | 1011 | $5,138 | $5.08 | 0d | 181 | 1.33mi |
| 508 Manhattan Ave Unit 2C New York, NY | 3.0 | 1.0 | 800 | $4,699 | $5.87 | 13d | 1 | 1.35mi |
| 312 W 121st St Unit 4C New York, NY | 3.0 | 2.0 | 900 | $4,854 | $5.39 | 9d | 1 | 1.35mi |
| 543 W 122nd St New York, NY | 2.0 | 1.0–2.0 | 1057 | $10,995 | $10.40 | 4d | 7 | 1.35mi |
| 506 Manhattan Ave Unit 1A New York, NY | 3.0 | 1.0 | 800 | $4,699 | $5.87 | 13d | 1 | 1.36mi |
| 312 W 121st St Unit 5-A New York, NY | 3.0 | 1.0 | 800 | $4,655 | $5.82 | 13d | 1 | 1.37mi |
HOA detail condo
- Monthly dues
- $1,399 · $16,788/yr
- Assessments
- None detected in remarks — confirm with the listing agent.
Listing history 15 events
-
2026-06-21days on market $499,000 Active 262 DOM
-
2026-06-18days on market $499,000 Active 259 DOM
-
2026-06-17days on market $499,000 Active 258 DOM
-
2026-06-15days on market $499,000 Active 256 DOM
-
2026-06-13days on market $499,000 Active 254 DOM
-
2026-06-10days on market $499,000 Active 250 DOM
-
2026-06-08days on market $499,000 Active 249 DOM
-
2026-06-03days on market $499,000 Active 244 DOM
-
2026-06-01days on market $499,000 Active 242 DOM
-
2026-05-31days on market $499,000 Active 241 DOM
-
2026-03-26price $499,000
-
2025-12-01price $550,000
-
2025-10-02$599,000 Active
-
2023-08-20historical $3,400
-
2023-08-07$3,500
ⓘ Source: listings_history table (triggers on properties + properties_extension) + one-shot
backfill from property_details.listing_events for pre-trigger history.
Climate risk First Street
- Flood 6/10 Major FEMA zone X (unshaded) · 27% chance over 30 yrs
- Wildfire 1/10 Low
- Heat 6/10 Major 7 d/yr ≥99°F today · 15 d/yr by 30 yrs out
- Wind 5/10 Major 26% chance of damaging wind over 30 yrs
- Air quality 4/10 Moderate 5 unhealthy d/yr today · 6 by 30 yrs out
Nearby sold comps map
Loading sold comps map…
Walkable amenities ~0.75 mi
Loading nearby amenities…
Taxation est. · year 1
- Rental income
- $57,215
- − Mortgage interest
- −$27,952
- − Property taxes
- −$7,485
- − Insurance
- −$2,495
- − Repairs & maintenance
- −$4,577
- − Management
- −$4,577
- − HOA
- −$16,788
- − Depreciation
- −$14,516
- Taxable loss
- −$21,176
- Est. tax savings @ 24.0%
- +$5,082
- After-tax cash flow
- $-7,888/yr
For passive investors: Depreciation is non-cash, so a rental often shows a tax loss while cash-flowing — sheltering income. Rental losses are passive: they offset passive income freely, and up to $25,000/yr can offset ordinary (W-2) income if you actively participate and your MAGI is under $100k (phasing out to $0 by $150k); unused losses carry forward. On sale, claimed depreciation is recaptured at up to 25%, and gains may owe capital-gains tax (a 1031 exchange can defer both). Figures are a year-1 estimate at your 24.0% rate — not tax advice; consult a CPA.
Schools (NCES district)
No district data.
Livability — New York
- Score
- 75/100
- State rank
- #268
- US rank
- #4188
Category grades
Schools grade is shown separately in the Schools card above.
Census & demographics
- Census place
- New York, NY
- County
- New York County · 1,599,927 people
- City population
- 7,731,280
- Metro
- New York-Newark-Jersey City, NY-NJ-PA
- Population (ZIP)
- 32,492
- Household income
- $45,371
- Rent vs Own
- Severe rent burden
- 2826.0
Population outlook (New York County) Hauer SSP2
- Today (2025)
- 1,825,725 people
- By 2030
- 1,904,611 · +4.3%
- By 2040
- 2,052,719 · +12.4%
- By 2050
- 2,206,601 · +20.9%
- By 2075
- 2,509,427 · +37.4%
- By 2100
- 2,702,933 · +48.0%
Race, ethnicity, and origin ACS 2023
- Neighborhood character
- Diverse neighborhood (Simpson 0.60)
- Race & ethnicity
- Black 53% Hispanic / Latino 33% Two or more races 18% White 7% Asian 1%
- Hispanic origin (detail)
- Mexican 7% Puerto Rican 6% Dominican 14%
- Common ancestry
- Scotch-Irish 1% Iranian 1% Romanian 1%
- Foreign-born
- 23% · Canada, China
- Languages at home
- 65% English-only · Spanish 28% French/Haitian/Cajun 3% Chinese 1%
Political lean MEDSL · New York
- 2024 margin
- Solid D (+64.8) · D 82.4% · R 17.6%
- 2008→2024 swing
- -7.4pp toward R · 2008: 72.2pp · 2024: 64.8pp
- All cycles
- 2024: D+64.8 2020: D+74.5 2016: D+77.2 2012: D+69.6 2008: D+72.2
Not yet ingested
- Civics
- —
Market trends
- HPI YoY
- ▲ 20.96%
- Current HPI
- 833.2625
- Rent YoY
- ▲ 6.68%
- Metro
- New York-Newark-Jersey City, NY-NJ-PA
- State GDP YoY
- ▲ 2.60%
- F500 in state
- 92
Industry mix (Fortune 500 HQ in NY)
| Industry | F500 HQs | Revenue |
|---|---|---|
| Financial Services | 10 | $950B |
|
||
| Consumer Goods | 9 | $162B |
|
||
| Insurance | 4 | $225B |
|
||
| Telecommunications | 2 | $144B |
|
||
| Pharmaceuticals | 2 | $112B |
|
||
| Media / Entertainment | 2 | $69B |
|
||
Price history
+14157.1% since first listed5 events — show timeline
- 2026-03-26 Price Changed $499,000 RLS at REBNY
- 2025-12-01 Price Changed $550,000 RLS at REBNY
- 2025-10-02 Listed $599,000 RLS at REBNY
- 2023-08-20 Rental Removed $3,400 REALTYMX
- 2023-08-07 Listed for Rent $3,500 REALTYMX
Cash-flow waterfall
monthlySold comps — $/sqft
last 12 mo · ≤1 miLoading sold comps…