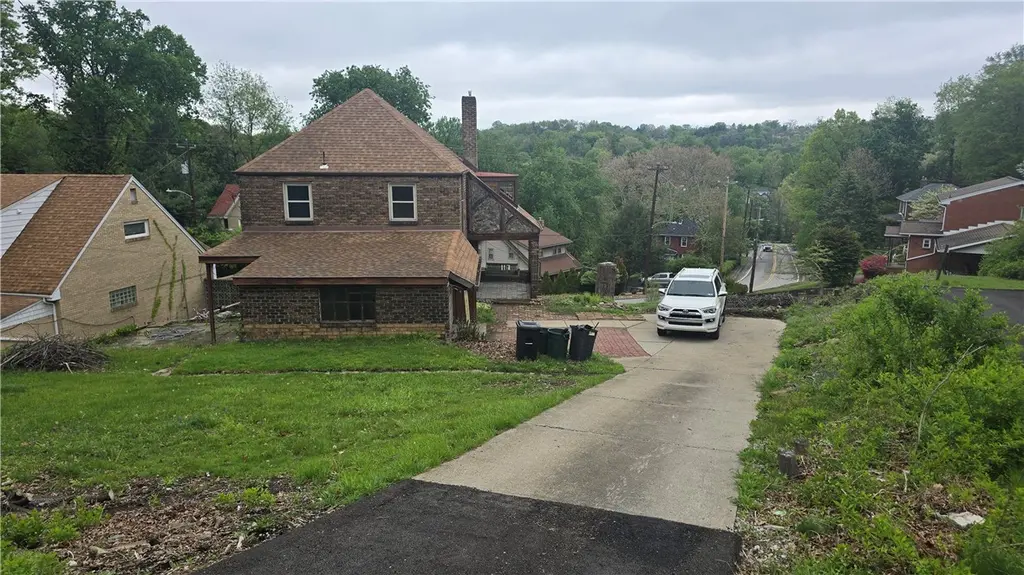
114 Braddock Rd · Forest Hills, PA
Flood risk 1/10 · Minimal
- FEMA flood zone
- X (unshaded)
- Chance of flooding over 30 yrs
- 0.0%
- Est. flood insurance / yr
- $473 – $860
Fire risk 1/10 · Minimal
- Est. fire insurance / yr
- $511 – $949
Heat risk 3/10 · Minor
- Hot days now (above 98°F)
- 7 days/yr
- Hot days in 30 yrs
- 16 days/yr
Wind risk 2/10 · Minimal
- Chance of severe wind over 30 yrs
- —
Air-quality risk 4/10 · Minor
- Unhealthy air days now
- 4 days/yr
- Unhealthy air days in 30 yrs
- 5 days/yr
Risk factors via First Street. Map © Google.
Why this score? — see what drove the D+ grade
The composite is a weighted blend of 9 inputs, each scored 0–100. Each bar is that input's sub-score; the figure is the points it added to the 100-point composite (weight × sub-score).
- ARV discount +15.0/15.0
- Cash flow +13.0/30.0
- 1% rule +4.9/10.0
- Livability +4.2/5.0
- DSCR +3.9/10.0
- Rent growth +3.5/5.0
- Condition / age +2.5/5.0
- Schools +1.8/10.0
- Appreciation +0.0/10.0
$130,000
🖨 Deal sheet 📄 Offer letter ✓ Due diligence
Listing remarks
This cute centrally located charmer packs a full on punch! Move in ready, located at 114 Braddock will provide it's new owners with a nostalgic front porch to set up the rocking chairs in summer, and ample yard. Plenty of additional parking space for your friends too! Drive into the city, or out to the turnpike, you just can't beat the location with all the East End favs even closer! Feel like you're in the burbs, but enjoy the perks of the city! Bonus unfinished lighthouse shaped room could be whatever you want to be off of the bedroom. New appliances and some updates.
Key facts
- Updates
- Front porch
- New appliances
Tags
Property features AI
Exterior
- Parking: Attached garage; Off-street parking
- Home design: 2 stories; Resale property; Brick construction
- Construction: Brick construction
- Exterior features: Lot approximately 0.2025 acres
Interior
- Kitchen: Cooktop; Stove; Dishwasher; Refrigerator; Some gas appliances
- Bedrooms: Bedroom 2 (Upper); Bedroom 3 (Upper)
- Bathrooms: 1 full bathroom
- Interior features: Has basement; Fireplace (1)
Neighborhood map
What this means for you Summary
Snapshot
- This is a 2-bed/1.0-bath single-family listed at $130k.
Deal economics
- At list price, monthly cash flow is $-6 ($-74/yr) — negative.
- To cash-flow at today's rent, offer at most $129k (0.8% below list).
- To meet the 1% rule (rent ≥ 1% of price), the offer needs to be $129k (0.9% below list).
- Recommended offer: $126k (3.0% below list) — sets the bar for market timing.
- Cap rate 6.2% vs local median 4.2% in Forest Hills — top-decile yield for the area; either an underpriced asset or a hidden risk that comps aren't pricing in. Stress-test before assuming the spread holds.
Location & tenants
- Location reads 83/100 on livability (#112 in PA, #873 nationally) — a professional / high-income tenant draw. Strengths: schools A+, crime A+, commute A+; Watch: amenities F.
- Woodland Hills SD (suburban): math 13% / reading 30% proficiency, ranked #486 of 539 in PA (top 90%) — low school quality limits family demand, transient renter base, plan for 1-2y turnover; 69% free/reduced lunch — lower-income household profile, screen leases tightly.
- Market conditions: Rents rising (+3.9%/yr); 118 active listings in the ZIP; 33 comparable units currently listed for rent nearby; rentals at typical pace (median 24d on market — plan ~3-4 weeks tenant-placement turnaround); 2,996 units permitted in Allegheny County in 2024 (1,588 in 5+ unit buildings).
Forward outlook
- Local home prices are declining (-3.0%/yr); year-one equity from $899 of loan paydown is wiped out by about $4k of value loss. Plan a longer hold.
Negotiation context
- It's been on market 49 days — a 3% lower offer ($126k) is reasonable based on typical stale-listing flexibility.
- Current owner paid $52k; list at $130k implies a 148% gain — meaningful room to come down on a strong offer.
Risks & watch-outs
- Watch-outs: property tax is 2.7% of price; built in 1930 — expect roof / HVAC / electrical / plumbing capex.
Questions for the listing agent
- What do current leases actually rent for vs. the listed asking? Can we see a recent rent roll and the last 12 months of T-12 income?
- It's been on market 49 days. Have you received any prior offers? Is the seller open to a 3% concession, seller financing, or rate buy-down credit?
- Built in 1930 — when were the roof, HVAC, electrical panel, plumbing, and water heater last replaced?
- Property tax is high relative to price — has the assessment been appealed recently, and will the sale trigger a re-assessment?
- Is there a deadline driving the sale (1031 exchange, divorce, estate, relocation)? That informs how much negotiation room exists.
- Schools are A-rated — typically a magnet for longer-tenancy family renters. What's the average tenant stay here, and is there a school-zone premium baked into asking?
- The area grade is low — what's the realistic commute time and amenity access for the typical tenant pool here? Any planned neighborhood developments (good or bad) we should know about?
- What's the average days-on-market for RENTAL listings here right now (not sales)? A rising rental-DOM trend means longer vacancies and softer asking-rent achievability than the comps imply.
- What's the recent tenant-quality profile in this submarket — average credit score on applications, eviction rate, late-payment / NSF rate, and stable-employment percentage? A property-management company in the area should have these aggregated.
- How much new for-sale + rental construction is in the pipeline within 1–3 miles? Heavy new supply typically softens prices + rents 12–24 months out; constrained supply supports both.
Investment metrics
- 1% rule
- 0.99% ✗
- Cap rate
- 6.24%
- Cash-on-cash
- -0.20%
- DSCR
- 0.99
- GRM
- 8.4
CMA / ARV
- ARV (median comp)
- $209,576
- List price
- $130,000
- Delta
- -37.97%
- Verdict
- UNDERPRICED
- Comps
- 20 within 1.0 mi
Show comp detail 12 sales within ~0.75 mi
| Address | Dist | Beds/Ba | Sqft | Sold | Price | $/sf | Match |
|---|---|---|---|---|---|---|---|
| 152 Fairfax Rd | 0.29mi | 3/2.0 (+1) | 1,224 (-2%) | 4mo | $225,000 | $184 | 70 |
| 967 Illinois Ave | 0.44mi | 3/2.0 (+1) | 1,264 (+1%) | 5mo | $214,000 | $169 | 64 |
| 850 Sherwood Rd | 0.53mi | 2/2.5 | 1,287 (+3%) | 1mo | $285,000 | $221 | 64 |
| 322 Virginia Ave | 0.48mi | 2/1.0 | 1,183 (-5%) | 8mo | $112,000 | $95 | 62 |
| 1606 Ardmore Blvd | 0.47mi | 2/1.5 | 1,144 (-8%) | 4mo | $175,000 | $153 | 58 |
| 406 Newport Rd | 0.43mi | 3/2.0 (+1) | 1,188 (-5%) | 6mo | $225,000 | $189 | 58 |
| 1252 Brinton Rd | 0.19mi | 3/2.0 (+1) | 1,063 (-15%) | 2mo | $66,150 | $62 | 55 |
| 425 Edgewood Rd | 0.59mi | 3/1.0 (+1) | 1,346 (+8%) | 0mo | $306,600 | $228 | 54 |
| 1212 Circle Dr | 0.49mi | 3/1.0 (+1) | 1,144 (-8%) | 6mo | $109,000 | $95 | 53 |
| 33 Roxbury Rd | 0.24mi | 3/2.0 (+1) | 1,428 (+14%) | 9mo | $285,000 | $200 | 48 |
| 1227 Circle Dr | 0.55mi | 3/2.0 (+1) | 1,150 (-8%) | 8mo | $110,566 | $96 | 46 |
| 2793 Columbia Ave | 0.37mi | 3/2.0 (+1) | 1,080 (-14%) | 8mo | $171,000 | $158 | 45 |
Match score weights: distance 35% · size 25% · config 20% · recency 20%. Top-matched comps best support the ARV.
Projected returns pro-forma
-3.0% appreciation · 3.86% rent growth · sell at horizon
- IRR
- -15.5%
- Equity multiple
- 0.44×
- Total profit
- $-20,238
- Equity at exit
- $19,383
- IRR
- -5.3%
- Equity multiple
- 0.64×
- Total profit
- $-13,044
- Equity at exit
- $11,240
Cash invested: $36,400 (down + closing). Projections, not guarantees.
Landlord ↔ Tenant lean methodology
- Overall (STATE)
- 62 Landlord-Friendly
- State Pennsylvania
- 62 Landlord-Friendly · EVEN
- County
- — inherits STATE
- City
- — inherits STATE
ZIP-level market 15221
- Home prices YoY
- -32.3%
- Rents YoY
- 3.9%
- Active inventory
- 118
- Price-to-rent
- 8.4×
Monthly cashflow live
- Estimated rent
- $1,288 high interval (Pro) →
- Mortgage (P&I)
- −$682
- Tax from tax record
- −$288 /mo · $3,450/yr
- Insurance
- −$54
- HOA
- −$0
- Vacancy / Maint / Mgmt
- −$270
- Net cashflow
- $-6
Break-even live
UW: 25.0% down · 7.5% · 30yr · 1.5% tax · 5.0% vac · 8.0% maint · 8.0% mgmt
Financing live
Cash to close
- Down payment
- $32,500
- Closing costs
- $3,900
- Reserves months
- —
- Total cash needed
- —
Loan-product check · same deal, 3 products live
Conventional
25% down · 7.5% · 30yr
- Down + closing
- —
- Monthly P&I
- —
- Monthly cashflow
- —
- DSCR
- —
- Eligible?
- —
Personal DTI + credit; lowest rate.
DSCR
20% down · 8.5% · 30yr
- Down + closing
- —
- Monthly P&I
- —
- Monthly cashflow
- —
- DSCR
- —
- Eligible?
- —
No personal income docs; deal must DSCR.
Hard money
10% down · 12.0% · 12mo
- Down + closing
- —
- Monthly P&I
- —
- Monthly cashflow
- —
- DSCR
- —
- Eligible?
- —
Short-term bridge; refi at stabilization.
Rent comps 33 comps
| Address | Beds | Baths | Sqft | Rent | $/sqft | DOM | Units | Dist |
|---|---|---|---|---|---|---|---|---|
| 207 Montana Ave Pittsburgh, PA | 2.0 | 1.0 | 840 | $1,000 | $1.19 | 23d | 1 | 0.53mi |
| 1003 Smokey Wood Dr Swissvale, PA | 1.0–2.0 | 1.0 | 874 | $1,475 | $1.69 | 4d | 4 | 0.68mi |
| 481 Filmore Rd Pittsburgh, PA | 3.0 | 1.5 | 1165 | $1,700 | $1.46 | 7d | 1 | 0.70mi |
| 2673 Woodstock Ave Pittsburgh, PA | 3.0 | 1.0 | 1000 | $1,190 | $1.19 | 23d | 1 | 0.76mi |
| 7801 Lloyd Ave Unit 105 Pittsburgh, PA | 1.0 | 1.0 | 750 | $970 | $1.29 | 23d | 1 | 0.77mi |
| 2323 Patterson Ave Unit NA Pittsburgh, PA | 3.0 | 1.0 | 1440 | $1,500 | $1.04 | 23d | 1 | 0.81mi |
| 2323 Patterson Ave Pittsburgh, PA | 3.0 | 1.0 | 1440 | $1,800 | $1.25 | 43d | 1 | 0.81mi |
| 539 Atlantic Ave Unit 2 Pittsburgh, PA | 3.0 | 1.0 | 1200 | $995 | $0.83 | 43d | 1 | 0.85mi |
| 17 Sumner Ave Pittsburgh, PA | 1.0 | 1.0 | 800 | $950 | $1.19 | 43d | 1 | 0.86mi |
| 7645 Highland Ave Pittsburgh, PA | 3.0 | 1.0 | 1161 | $1,325 | $1.14 | 7d | 1 | 0.89mi |
| 100 Bryn Mawr Ct W Pittsburgh, PA | 1.0–2.0 | 1.0–2.0 | 975 | $1,904 | $1.95 | 3d | 15 | 0.89mi |
| 2255 Hawthorne Ave Unit 2255 Swissvale, PA | 2.0 | 1.0 | 1020 | $1,000 | $0.98 | 12d | 1 | 0.93mi |
| 144 Comrie Ave Braddock, PA | 3.0 | 1.0 | 1000 | $1,250 | $1.25 | 23d | 1 | 0.97mi |
| 2121 Milligan Ave Unit 3 Pittsburgh, PA | 2.0 | 1.0 | 800 | $1,195 | $1.49 | 43d | 1 | 1.03mi |
| 2121 Milligan Ave Unit 6 Pittsburgh, PA | 2.0 | 1.0 | 800 | $1,300 | $1.62 | 4d | 1 | 1.03mi |
| 700 Filmore Rd Pittsburgh, PA | 3.0 | 2.0 | 1072 | $1,800 | $1.68 | 12d | 1 | 1.06mi |
| 12 Demmer Ave Unit 2 Pittsburgh, PA | 1.0 | 1.0 | 750 | $725 | $0.97 | 23d | 1 | 1.09mi |
| 212 Kenmawr Ave Braddock, PA | 2.0 | 1.5 | 1417 | $1,300 | $0.92 | 43d | 1 | 1.10mi |
| 537 6th St Braddock, PA | 3.0 | 1.0 | 1360 | $1,400 | $1.03 | 43d | 1 | 1.18mi |
| 227 Parklane Dr Unit Parklane Dr unit North Braddock, PA | 3.0 | 1.0 | 1107 | $1,500 | $1.36 | 12d | 1 | 1.20mi |
| 1305 Walnut St Unit B Pittsburgh, PA | 1.0 | 1.0 | 840 | $1,000 | $1.19 | 23d | 1 | 1.20mi |
| 233-241 Edgewood Ave Unit B06 Pittsburgh, PA | 2.0 | 1.0 | 726 | $1,250 | $1.72 | 23d | 1 | 1.22mi |
| 233-241 Edgewood Ave Unit B10 Pittsburgh, PA | 2.0 | 1.0 | 726 | $1,250 | $1.72 | 43d | 1 | 1.22mi |
| 233-241 Edgewood Ave Unit B09 Pittsburgh, PA | 1.0 | 1.0 | 712 | $1,050 | $1.47 | 43d | 1 | 1.22mi |
| 235 Edgewood Ave Pittsburgh, PA | 1.0 | 1.0 | 712 | $925 | $1.30 | 3d | 1 | 1.22mi |
| 241 Edgewood Ave Unit C12 Pittsburgh, PA | 1.0 | 1.0 | 712 | $925 | $1.30 | 19d | 1 | 1.23mi |
| 817 Kirkpatrick Ave Unit 8171-A Braddock, PA | 2.0 | 1.0 | 866 | $800 | $0.92 | 43d | 1 | 1.27mi |
| 7215 Beacon Hill Dr Pittsburgh, PA | 2.0 | 2.0 | 1259 | $1,795 | $1.43 | 4d | 1 | 1.32mi |
| 7467 Schoyer Ave Pittsburgh, PA | 1.0 | 1.0 | 900 | $895 | $0.99 | 3d | 1 | 1.37mi |
| 826 Walnut St Pittsburgh, PA | 2.0 | 1.0 | 1270 | $1,195 | $0.94 | 43d | 1 | 1.44mi |
| 1515 Penn Ave Wilkinsburg, PA | 2.0 | 2.0 | 1012 | $1,100 | $1.09 | 43d | 1 | 1.45mi |
| 7534 Penn Bridge Ct Pittsburgh, PA | 2.0 | 2.0 | 1259 | $1,750 | $1.39 | 43d | 1 | 1.48mi |
| 219 North Ave Unit 1 East Pittsburgh, PA | 2.0 | 1.0 | 850 | $900 | $1.06 | 3d | 1 | 1.50mi |
Listing history 15 events
-
2026-06-18days on market $130,000 Active 49 DOM
-
2026-06-17days on market $130,000 Active 48 DOM
-
2026-06-16days on market $130,000 Active 47 DOM
-
2026-06-15pricedays on market $130,000 Active 46 DOM
-
2026-06-13days on market $150,000 Active 44 DOM
-
2026-06-09days on market $150,000 Active 40 DOM
-
2026-06-08days on market $150,000 Active 39 DOM
-
2026-06-07days on market $150,000 Active 38 DOM
-
2026-06-05days on market $150,000 Active 35 DOM
-
2026-06-03days on market $150,000 Active 34 DOM
-
2026-06-02days on market $150,000 Active 33 DOM
-
2026-06-01days on market $150,000 Active 32 DOM
-
2026-05-31days on market $150,000 Active 31 DOM
-
2026-04-30$150,000 Active 577-char remark
-
1984-12-05soldstatus $52,500
ⓘ Source: listings_history table (triggers on properties + properties_extension) + one-shot
backfill from property_details.listing_events for pre-trigger history.
Tax reassessment forecast PA · Partial reset (capped growth)
- Current annual tax
- $3,450 · $288/mo
- Projected year-2 tax
- $3,450 · $288/mo
- Expected delta
- $0/yr ($0/mo · 0.0%)
ⓘ Screening estimate from a state-policy table — verify with the county assessor before closing.
Climate risk First Street
- Flood 1/10 Low FEMA zone X (unshaded) · 0% chance over 30 yrs
- Wildfire 1/10 Low
- Heat 3/10 Moderate 7 d/yr ≥98°F today · 16 d/yr by 30 yrs out
- Wind 2/10 Low
- Air quality 4/10 Moderate 4 unhealthy d/yr today · 5 by 30 yrs out
Nearby sold comps map
Loading sold comps map…
Walkable amenities ~0.75 mi
Loading nearby amenities…
Taxation est. · year 1
- Rental income
- $15,452
- − Mortgage interest
- −$7,282
- − Property taxes
- −$3,450
- − Insurance
- −$650
- − Repairs & maintenance
- −$1,236
- − Management
- −$1,236
- − Depreciation
- −$3,782
- Taxable loss
- −$2,184
- Est. tax savings @ 24.0%
- +$524
- After-tax cash flow
- $450/yr
For passive investors: Depreciation is non-cash, so a rental often shows a tax loss while cash-flowing — sheltering income. Rental losses are passive: they offset passive income freely, and up to $25,000/yr can offset ordinary (W-2) income if you actively participate and your MAGI is under $100k (phasing out to $0 by $150k); unused losses carry forward. On sale, claimed depreciation is recaptured at up to 25%, and gains may owe capital-gains tax (a 1031 exchange can defer both). Figures are a year-1 estimate at your 24.0% rate — not tax advice; consult a CPA.
Schools (NCES district)
- District
- Woodland Hills SD
- NCES district ID
- 4216500
- Math proficiency
- 13% ▼ -13.00%
- Reading proficiency
- 30% ▼ -10.00%
- Median HH income
- $41,803
- Composite
- 18.31/100
- National rank
- #8954
- State rank
- #486 of 539 in PA
Livability — Forest Hills
- Score
- 83/100
- State rank
- #112
- US rank
- #873
Category grades
Schools grade is shown separately in the Schools card above.
Census & demographics
- Census place
- Forest Hills, PA
- County
- Allegheny County · 1,022,028 people
- Metro
- Pittsburgh, PA
- Population (ZIP)
- 29,374
- Household income
- $55,028
- Rent vs Own
- Severe rent burden
- 1933.0
Population outlook (Allegheny County) Hauer SSP2
- Today (2025)
- 1,250,282 people
- By 2030
- 1,256,482 · +0.5%
- By 2040
- 1,256,318 · +0.5%
- By 2050
- 1,244,169 · -0.5%
- By 2075
- 1,197,693 · -4.2%
- By 2100
- 1,093,187 · -12.6%
Race, ethnicity, and origin ACS 2023
- Neighborhood character
- Diverse neighborhood (Simpson 0.60)
- Race & ethnicity
- White 47% Black 43% Two or more races 7% Hispanic / Latino 4% Asian 1%
- Common ancestry
- Romanian 4% Lithuanian 2% Serbian 1%
- Foreign-born
- 4% · Canada, South Korea, China
- Languages at home
- 93% English-only · Spanish 2% French/Haitian/Cajun 1% Other Indo-European 1%
Political lean MEDSL · Allegheny
- 2024 margin
- Strong D (+20.3) · D 59.7% · R 39.4%
- 2008→2024 swing
- +4.8pp toward D · 2008: 15.5pp · 2024: 20.3pp
- All cycles
- 2024: D+20.3 2020: D+20.4 2016: D+16.4 2012: D+14.4 2008: D+15.5
Not yet ingested
- Civics
- —
Market trends
- HPI YoY
- ▼ -109.77%
- Current HPI
- 230.0486
- Rent YoY
- ▲ 3.86%
- Metro
- Pittsburgh, PA
- State GDP YoY
- ▲ 1.68%
- F500 in state
- 34
Industry mix (Fortune 500 HQ in PA)
| Industry | F500 HQs | Revenue |
|---|---|---|
| Healthcare | 2 | $309B |
|
||
| Insurance | 2 | $27B |
|
||
| Telecommunications / Media | 1 | $124B |
|
||
| Industrial Distribution | 1 | $22B |
|
||
| Financial Services | 1 | $20B |
|
||
| Chemicals / Materials | 1 | $18B |
|
||
Price history
+147.6% since first listed3 events — show timeline
- 2026-06-14 Price Changed $130,000 West Penn MLS
- 2026-04-30 Listed $150,000 West Penn MLS
- 1984-12-05 Sold (Public Records) $52,500 Public Records
Property tax history
-0.9%/yrLatest (2026): $3,450 · +37.1% YoY. Source: county tax records.
Cash-flow waterfall
monthlySold comps — $/sqft
last 12 mo · ≤1 miLoading sold comps…