 🏗️ New Construction
60 Pinewoods St · Nocatee, FL
Flood risk 1/10 · Minimal
- FEMA flood zone
- X (unshaded)
- Chance of flooding over 30 yrs
- 0.0%
- Est. flood insurance / yr
- $507 – $1,088
Fire risk 5/10 · Moderate
- Est. fire insurance / yr
- $947 – $1,759
Heat risk 9/10 · Severe
- Hot days now (above 107°F)
- 7 days/yr
- Hot days in 30 yrs
- 20 days/yr
Wind risk 9/10 · Severe
- Chance of severe wind over 30 yrs
- 99.0%
Air-quality risk 4/10 · Minor
- Unhealthy air days now
- 4 days/yr
- Unhealthy air days in 30 yrs
- 4 days/yr
Risk factors via First Street. Map © Google.
Why this score? — see what drove the F grade
The composite is a weighted blend of 9 inputs, each scored 0–100. Each bar is that input's sub-score; the figure is the points it added to the 100-point composite (weight × sub-score).
- ARV discount +7.5/15.0
- Schools +6.4/10.0
- Appreciation +4.8/10.0
- Livability +3.5/5.0
- Rent growth +2.8/5.0
- Condition / age +2.5/5.0
- Cash flow +1.0/30.0
- 1% rule +0.0/10.0
- DSCR +0.0/10.0
$5,000
🖨 Deal sheet (PDF) 📄 Offer letter ✓ Due diligence
Listing remarks MLS
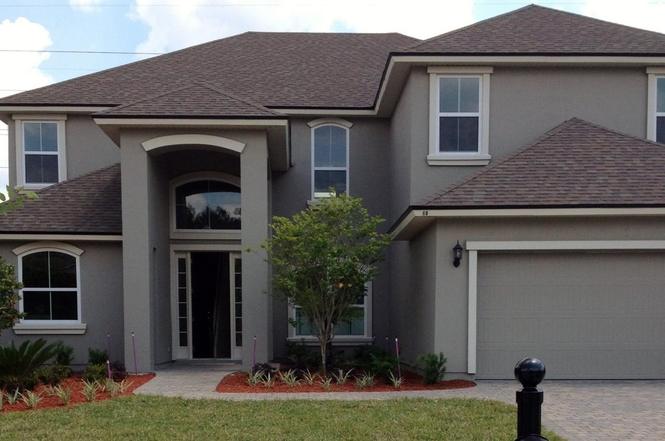
New Construction by the award winning CORNERSTONE HOMES. A ''Five'' Time Winner of The Golden Service Award. This beautiful 3634sf, 5 Bedroom / 3.5 Bath with Loft and Bonus Room is sure to please the most discriminate buyer. Located in Nocatee ''Ranked 6th Best-Selling Community in America''. This home features a 8' x 4’ floating island in kitchen with oversized pantry that opens to the Large Family Room. The home features arched openings, crown molding, a 10x20 rear covered porch and pavers on the front porch and sidewalk to add to the exterior Aesthetics. The garage features a 6 foot bump forward to create a workshop space for the Home Owner.
Key facts
- 2 garage spots
- Listed 8 days
Property features AI
Exterior
- Parking: Two-car garage
- Home design: Residential property; Two-story home
- Exterior features: Lot approximately 0.18 acres; Zoned SFR (single-family residential)
Interior
- Bathrooms: Three full bathrooms; One half bathroom
- Interior features: Directions available to property: Take US 1 South to east on 210 (at gate station), follow to right into Austin Park, left on Pinewoods; home is on the right
Neighborhood map
What this means for you Summary
Snapshot
- This is a 5-bed/4.0-bath single-family listed at $5k.
Deal economics
- At list price, monthly cash flow is $-4k ($-46k/yr) — negative.
- The deal already cash-flows at list — no discount required.
- Meets the 1% rule at list price ($3k rent vs $5k).
- Cap rate 1.3% vs local median 2.5% in Nocatee — below-typical yield; the buyer is paying a premium for something (appreciation thesis, condition, location) that the cap rate doesn't capture.
Location & tenants
- Location reads 70/100 on livability (#425 in FL) — a middle-class / working-renter tenant base. Strengths: crime A+, employment A+, housing A+; Watch: amenities F, commute F, cost of living F.
- St. Johns (rural): math 75% / reading 73% proficiency, ranked #2 of 73 in FL (top 3%) — strong family-tenant draw, lease renewals of 3-5y typical; only 20% free/reduced lunch — higher-income household profile.
- Zoned schools: Valley Ridge Academy (math 87% / reading 81%, grade A+, #55 of 2,144 statewide, top 3%, 1,306 students, 14% FRL); Allen D Nease Senior High School (math 72% / reading 78%, grade A-, #40 of 667 statewide, top 6%, 2,214 students, 4% FRL).
- Market conditions: Rents rising (+1.1%/yr); 648 active listings in the ZIP; high-income renter base; 5,575 units permitted in St. Johns County in 2024 (584 in 5+ unit buildings).
Forward outlook
- In year one you build about $2k of equity ($6k loan paydown + $-4k appreciation (-0.5% local appreciation)).
- St. Johns County population projected at +60% by 2050 — long-run rental-demand tailwind backs the buy-and-hold thesis.
- By year 10, paydown + projected appreciation supports a ~$58k cash-out refi (75% LTV) — recoverable capital for the next deal without selling this one.
Negotiation context
- Only 8 days on market — expect competitive offers; lowballing is unlikely to land.
- 3 sale attempts since 13y ago with the ask held roughly flat each time — persistent listings suggest the price (not the market) is what's stuck; bring a comps-based counter.
Risks & watch-outs
- Watch-outs: property tax is 275.9% of price.
- Climate carrying-cost: severe wind risk, 99% chance of damaging wind over 30y; moderate wildfire risk; extreme-heat days projected 7→20/yr by 2055 (HVAC capex compounding) — expect insurance premiums to compound above CPI over the hold.
Questions for the listing agent
- What do current leases actually rent for vs. the listed asking? Can we see a recent rent roll and the last 12 months of T-12 income?
- Property tax is high relative to price — has the assessment been appealed recently, and will the sale trigger a re-assessment?
- Is there a deadline driving the sale (1031 exchange, divorce, estate, relocation)? That informs how much negotiation room exists.
- Schools are A-rated — typically a magnet for longer-tenancy family renters. What's the average tenant stay here, and is there a school-zone premium baked into asking?
- The area grade is low — what's the realistic commute time and amenity access for the typical tenant pool here? Any planned neighborhood developments (good or bad) we should know about?
- What's the average days-on-market for RENTAL listings here right now (not sales)? A rising rental-DOM trend means longer vacancies and softer asking-rent achievability than the comps imply.
- What's the recent tenant-quality profile in this submarket — average credit score on applications, eviction rate, late-payment / NSF rate, and stable-employment percentage? A property-management company in the area should have these aggregated.
- How much new for-sale + rental construction is in the pipeline within 1–3 miles? Heavy new supply typically softens prices + rents 12–24 months out; constrained supply supports both.
Investment metrics
- 1% rule
- 0.35% ✗
- Cap rate
- 1.32%
- Cash-on-cash
- -17.75%
- DSCR
- 0.21
- GRM
- 23.8
CMA / ARV
- ARV (on-the-fly)
- $919,655
- Comps found
- 12
Show comp detail 12 sales within ~0.75 mi
| Address | Dist | Beds/Ba | Sqft | Sold | Price | $/sf | Match |
|---|---|---|---|---|---|---|---|
| 47 Puritan Rd | 0.12mi | 5/4.0 | 3,185 (-12%) | 7mo | $725,000 | $228 | 68 |
| 70 Glenalby Pl | 0.25mi | 5/3.5 | 3,421 (-6%) | 12mo | $770,000 | $225 | 67 |
| 186 Citrus Ridge Dr | 0.30mi | 4/3.5 (-1) | 3,485 (-4%) | 10mo | $880,000 | $253 | 63 |
| 165 Citrus Ridge Dr | 0.33mi | 4/3.5 (-1) | 3,263 (-10%) | 2mo | $945,000 | $290 | 59 |
| 90 Wild Elm Ave | 0.32mi | 5/4.0 | 3,251 (-11%) | 13mo | $792,000 | $244 | 57 |
| 212 Cornwall Dr | 0.32mi | 6/3.5 (+1) | 3,905 (+7%) | 13mo | $875,000 | $224 | 55 |
| 180 Cross Ridge Dr | 0.54mi | 5/4.5 | 3,207 (-12%) | 3mo | $879,000 | $274 | 51 |
| 56 Wild Elm Ave | 0.35mi | 5/4.0 | 3,274 (-10%) | 23mo | $950,000 | $290 | 48 |
| 10680 Quail Ridge Dr | 0.74mi | 4/4.0 (-1) | 3,558 (-2%) | 19mo | $1,800,000 | $506 | 41 |
| 1820 Falbridge Ln | 0.32mi | 4/4.0 (-1) | 3,091 (-15%) | 17mo | $620,000 | $201 | 41 |
| 170 Carrier Dr | 0.70mi | 4/4.0 (-1) | 3,189 (-12%) | 6mo | $710,000 | $223 | 37 |
| 290 Woodland Greens Dr | 0.63mi | 4/3.5 (-1) | 3,165 (-13%) | 20mo | $950,000 | $300 | 26 |
Match score weights: distance 35% · size 25% · config 20% · recency 20%. Top-matched comps best support the ARV.
Projected returns pro-forma
-0.49% appreciation · 1.13% rent growth · sell at horizon
- IRR
- -26.6%
- Equity multiple
- -0.15×
- Total profit
- $-296,338
- Equity at exit
- $244,773
- IRR
- -21.1%
- Equity multiple
- -0.93×
- Total profit
- $-496,244
- Equity at exit
- $277,000
Cash invested: $257,503 (down + closing). Projections, not guarantees.
Landlord ↔ Tenant lean methodology
- Overall (STATE)
- 87 Strongly Landlord-Friendly
- State Florida
- 87 Strongly Landlord-Friendly · R+3
- County
- — inherits STATE
- City
- — inherits STATE
ZIP-level market 32081
- Home prices YoY
- -0.3%
- Rents YoY
- 1.1%
- Active inventory
- 648
- Price-to-rent
- 0.1×
Monthly cashflow live
- Estimated rent
- $3,223 medium interval (Pro) →
- Mortgage (P&I)
- −$4,823
- Tax est. 1.5%
- −$1,150 /mo · $13,795/yr
- Insurance
- −$383
- HOA
- −$0
- Vacancy / Maint / Mgmt
- −$677
- Net cashflow
- $-3,809
Break-even live
Sensitivity live
| Price | -10% $-3,173 | -5% $-3,491 | +0% $-3,809 | +5% $-4,127 | +10% $-4,445 |
|---|---|---|---|---|---|
| Rent | -10% $-4,064 | -5% $-3,936 | +0% $-3,809 | +5% $-3,682 | +10% $-3,554 |
| Rate | -1.0pp $-3,346 | -0.5pp $-3,575 | base $-3,809 | +0.5pp $-4,047 | +1.0pp $-4,290 |
UW: 25.0% down · 7.5% · 30yr · 1.5% tax · 5.0% vac · 8.0% maint · 8.0% mgmt
Financing live
Cash to close
- Down payment
- $229,914
- Closing costs
- $27,590
- Reserves months
- —
- Total cash needed
- —
Loan-product check · same deal, 3 products live
Conventional
25% down · 7.5% · 30yr
- Down + closing
- —
- Monthly P&I
- —
- Monthly cashflow
- —
- DSCR
- —
- Eligible?
- —
Personal DTI + credit; lowest rate.
DSCR
20% down · 8.5% · 30yr
- Down + closing
- —
- Monthly P&I
- —
- Monthly cashflow
- —
- DSCR
- —
- Eligible?
- —
No personal income docs; deal must DSCR.
Hard money
10% down · 12.0% · 12mo
- Down + closing
- —
- Monthly P&I
- —
- Monthly cashflow
- —
- DSCR
- —
- Eligible?
- —
Short-term bridge; refi at stabilization.
Listing history 7 events
-
2026-06-18days on market $5,000 Active 8 DOM
-
2026-06-17days on market $5,000 Active 7 DOM
-
2026-06-16days on market $5,000 Active 6 DOM
-
2026-06-15days on market $5,000 Active 5 DOM
-
2026-06-13days on market $5,000 Active 3 DOM
-
2026-06-13remarks 292-char remark
-
2026-06-13$5,000 Active 2 DOM
ⓘ Source: listings_history table (triggers on properties + properties_extension) + one-shot
backfill from property_details.listing_events for pre-trigger history.
Climate risk First Street
- Flood 1/10 Low FEMA zone X (unshaded) · 0% chance over 30 yrs
- Wildfire 5/10 Major
- Heat 9/10 Extreme 7 d/yr ≥107°F today · 20 d/yr by 30 yrs out
- Wind 9/10 Extreme 99% chance of damaging wind over 30 yrs
- Air quality 4/10 Moderate 4 unhealthy d/yr today · 4 by 30 yrs out
Nearby sold comps map
Loading sold comps map…
Walkable amenities ~0.75 mi
Loading nearby amenities…
Taxation est. · year 1
- Rental income
- $38,681
- − Mortgage interest
- −$51,515
- − Property taxes
- −$13,795
- − Insurance
- −$4,598
- − Repairs & maintenance
- −$3,094
- − Management
- −$3,094
- − Depreciation
- −$26,754
- Taxable loss
- −$64,170
- Est. tax savings @ 24.0%
- +$15,401
- After-tax cash flow
- $-30,308/yr
For passive investors: Depreciation is non-cash, so a rental often shows a tax loss while cash-flowing — sheltering income. Rental losses are passive: they offset passive income freely, and up to $25,000/yr can offset ordinary (W-2) income if you actively participate and your MAGI is under $100k (phasing out to $0 by $150k); unused losses carry forward. On sale, claimed depreciation is recaptured at up to 25%, and gains may owe capital-gains tax (a 1031 exchange can defer both). Figures are a year-1 estimate at your 24.0% rate — not tax advice; consult a CPA.
Schools (NCES district)
- District
- St. Johns
- NCES district ID
- 1201740
- Math proficiency
- 75% ▼ -5.00%
- Reading proficiency
- 73% ▼ -2.00%
- Median HH income
- $66,842
- Composite
- 64.31/100
- National rank
- #556
- State rank
- #2 of 73 in FL
Livability — Nocatee
- Score
- 70/100
- State rank
- #425
- US rank
- #7550
Category grades
Schools grade is shown separately in the Schools card above.
Census & demographics
- Census place
- Nocatee, FL
- County
- Saint Johns County · 301,599 people
- City population
- 27,365
- Metro
- Jacksonville, FL
- Population (ZIP)
- 29,784
- Household income
- $131,624
- Rent vs Own
- Severe rent burden
- 729.0
Population outlook (St. Johns County) Hauer SSP2
- Today (2025)
- 303,941 people
- By 2030
- 342,590 · +12.7%
- By 2040
- 417,328 · +37.3%
- By 2050
- 487,011 · +60.2%
- By 2075
- 635,395 · +109.1%
- By 2100
- 717,469 · +136.1%
Race, ethnicity, and origin ACS 2023
- Neighborhood character
- Predominantly White (82%)
- Race & ethnicity
- White 82% Two or more races 9% Hispanic / Latino 7% Asian 5% Black 1%
- Hispanic origin (detail)
- Puerto Rican 3% Cuban 1%
- Common ancestry
- Lithuanian 5% Romanian 3% Portuguese 2%
- Foreign-born
- 9% · Canada, China
- Languages at home
- 89% English-only · Spanish 3% Other Indo-European 3% Other Asian/Pacific 2%
Political lean MEDSL · St. Johns
- 2024 margin
- Solid R (+31.4) · D 33.9% · R 65.2%
- 2008→2024 swing
- +0.2pp no change · 2008: -31.6pp · 2024: -31.4pp
- All cycles
- 2024: R+31.4 2020: R+26.7 2016: R+33.4 2012: R+37.8 2008: R+31.6
Not yet ingested
- Civics
- —
Market trends
- HPI YoY
- ▼ -0.49%
- Current HPI
- 145.8421
- Rent YoY
- ▲ 1.13%
- Metro
- Jacksonville, FL
- State GDP YoY
- ▲ 3.28%
- F500 in state
- 36
Industry mix (Fortune 500 HQ in FL)
| Industry | F500 HQs | Revenue |
|---|---|---|
| Industrial Technology | 2 | $29B |
|
||
| Insurance | 2 | $17B |
|
||
| Retail | 1 | $60B |
|
||
| Technology Distribution | 1 | $58B |
|
||
| Homebuilding | 1 | $35B |
|
||
| Technology Manufacturing | 1 | $35B |
|
||
Price history
-98.8% since first listed4 events — show timeline
- 2026-06-10 Listed $5,000 NFMLS
- 2025-09-02 Listed $5,000 NFMLS
- 2014-07-28 Sold (MLS) $382,000 realMLS
- 2013-12-22 Listed $400,000 realMLS
Property tax history
+12.9%/yrLatest (2025): $11,038 · +10.8% YoY. Source: county tax records.
Cash-flow waterfall
monthlySold comps — $/sqft
last 12 mo · ≤1 miLoading sold comps…