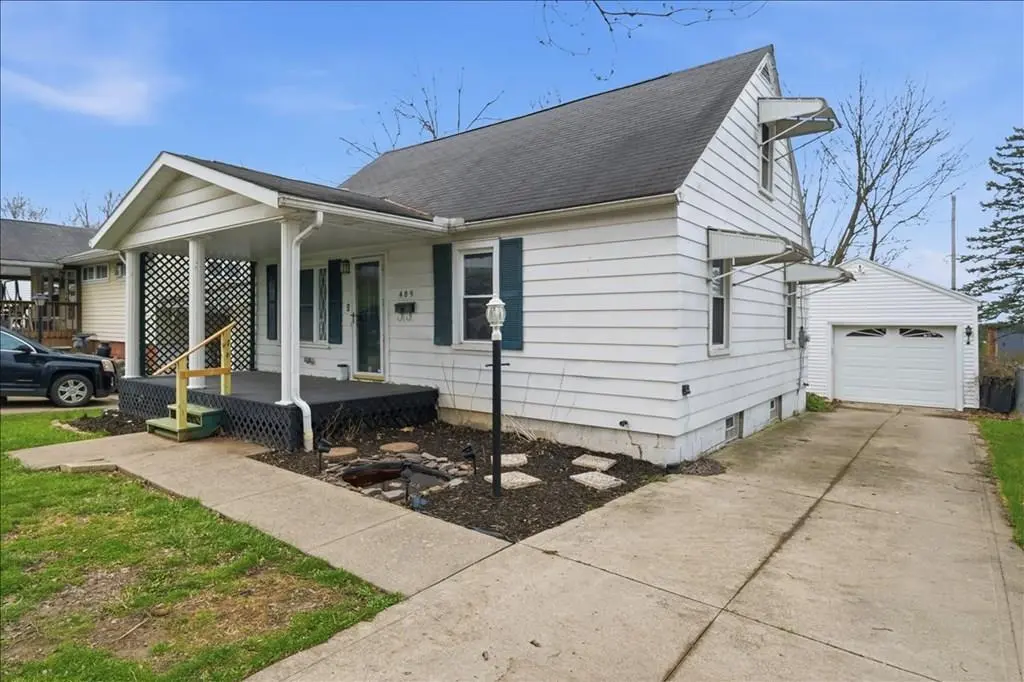
489 Boals Ave · Mansfield, OH
Flood risk 1/10 · Minimal
- FEMA flood zone
- X (unshaded)
- Chance of flooding over 30 yrs
- 0.0%
- Est. flood insurance / yr
- $473 – $860
Fire risk 1/10 · Minimal
- Est. fire insurance / yr
- $713 – $1,323
Heat risk 3/10 · Minor
- Hot days now (above 96°F)
- 7 days/yr
- Hot days in 30 yrs
- 17 days/yr
Wind risk 2/10 · Minimal
- Chance of severe wind over 30 yrs
- 0.0%
Air-quality risk 2/10 · Minimal
- Unhealthy air days now
- 1 days/yr
- Unhealthy air days in 30 yrs
- 1 days/yr
Risk factors via First Street. Map © Google.
Why this score? — see what drove the D- grade
The composite is a weighted blend of 9 inputs, each scored 0–100. Each bar is that input's sub-score; the figure is the points it added to the 100-point composite (weight × sub-score).
- Cash flow +14.5/30.0
- DSCR +4.4/10.0
- Schools +4.3/10.0
- Livability +3.8/5.0
- 1% rule +3.3/10.0
- Rent growth +2.5/5.0
- Condition / age +2.5/5.0
- ARV discount +0.0/15.0
- Appreciation +0.0/10.0
$124,900
🖨 Deal sheet (PDF) 📄 Offer letter ✓ Due diligence
Listing remarks MLS
This lovely Cape Cod-style home offers a cozy and inviting atmosphere. This 2 bedroom, 1 bathroom home boasts almost 1200 square feet of living space, with the potential to use the upstairs as additional bedrooms! Located in Madison School District, and conveniently located near Ashland Rd, Route 30 and I-71, this adorable home won't last long! Call to schedule your showing today!
Key facts
- New flooring
- Light fixtures
- Ceiling fans
Tags
Property features AI
Exterior
- Parking: 1-car garage; Concrete parking surface
- Utilities: Public water; Public sewer
- Home design: Single family residence; Residential property
- Construction: Aluminum siding
- Exterior features: Composition roof
Interior
- Kitchen: Dishwasher; Range; Refrigerator
- Bathrooms: 1 full bathroom
- Heating & cooling: Forced air heating (natural gas); Window cooling units
- Interior features: Dishwasher; Refrigerator; Range; Full basement
Neighborhood map
What this means for you Summary
Snapshot
- This is a 2-bed/1.0-bath single-family listed at $125k.
Deal economics
- At list price, monthly cash flow is $28 ($334/yr) — positive.
- The deal already cash-flows at list — no discount required.
- To meet the 1% rule (rent ≥ 1% of price), the offer needs to be $104k (17.1% below list).
- Recommended offer: $104k (17.1% below list) — sets the bar for 1% rule.
- Cap rate 6.6% vs local median 4.2% in Mansfield — top-decile yield for the area; either an underpriced asset or a hidden risk that comps aren't pricing in. Stress-test before assuming the spread holds.
Location & tenants
- Location reads 76/100 on livability (#224 in OH, #3,525 nationally) — a middle-class / working-renter tenant base. Strengths: commute A+, cost of living A+, housing A+; Watch: schools C-, crime D-, amenities D-.
- Madison Local (suburban): math 48% / reading 56% proficiency, ranked #430 of 656 in OH (top 66%) — acceptable for families but not a draw, mixed tenant base, ~2y average lease.
- Market conditions: 33 active listings in the ZIP; 145 units permitted in Richland County in 2024 (0 in 5+ unit buildings).
Forward outlook
- Local home prices are declining (-3.0%/yr); year-one equity from $864 of loan paydown is wiped out by about $4k of value loss. Plan a longer hold.
- Richland County population projected at -18% by 2050 — secular population decline; favor cash flow + early exit over multi-decade hold.
Negotiation context
- It's been on market 54 days — a 3% lower offer ($121k) is reasonable based on typical stale-listing flexibility.
- 7 sale attempts since 21y ago; this cycle's ask has dropped $10k (7%) from the opening price — seller is motivated, your offer sets the floor, not the list.
- Current owner paid $100k; 25% above their basis — modest negotiation headroom, anchor on the comps not their cost.
Risks & watch-outs
- Watch-outs: built in 1954 — expect roof / HVAC / electrical / plumbing capex.
Questions for the listing agent
- It's been on market 54 days. Have you received any prior offers? Is the seller open to a 17% concession, seller financing, or rate buy-down credit?
- Built in 1954 — when were the roof, HVAC, electrical panel, plumbing, and water heater last replaced?
- Is there a deadline driving the sale (1031 exchange, divorce, estate, relocation)? That informs how much negotiation room exists.
- Crime grade is D in this area — have there been break-ins, vandalism, or insurance claims at this property in the last 3 years? What carrier currently insures it and at what premium?
- The area grade is low — what's the realistic commute time and amenity access for the typical tenant pool here? Any planned neighborhood developments (good or bad) we should know about?
- What's the average days-on-market for RENTAL listings here right now (not sales)? A rising rental-DOM trend means longer vacancies and softer asking-rent achievability than the comps imply.
- What's the recent tenant-quality profile in this submarket — average credit score on applications, eviction rate, late-payment / NSF rate, and stable-employment percentage? A property-management company in the area should have these aggregated.
- How much new for-sale + rental construction is in the pipeline within 1–3 miles? Heavy new supply typically softens prices + rents 12–24 months out; constrained supply supports both.
Investment metrics
- 1% rule
- 0.83% ✗
- Cap rate
- 6.56%
- Cash-on-cash
- 0.95%
- DSCR
- 1.04
- GRM
- 10.0
CMA / ARV
- ARV (on-the-fly)
- $86,651
- Comps found
- 11
Show comp detail 11 sales within ~0.75 mi
| Address | Dist | Beds/Ba | Sqft | Sold | Price | $/sf | Match |
|---|---|---|---|---|---|---|---|
| 360 Central Ave | 0.59mi | 3/1.0 (+1) | 1,136 (-4%) | 4mo | $120,000 | $106 | 57 |
| 484 Van Buren Ave | 0.48mi | 3/1.0 (+1) | 1,312 (+10%) | 1mo | $130,000 | $99 | 54 |
| 328 Second Ave | 0.72mi | 3/1.0 (+1) | 1,219 (+3%) | 6mo | $86,000 | $71 | 52 |
| 503 Central Ave | 0.57mi | 2/2.0 | 1,270 (+7%) | 10mo | $30,000 | $24 | 50 |
| 357 5th Ave | 0.49mi | 3/1.0 (+1) | 1,098 (-8%) | 12mo | $50,000 | $46 | 49 |
| 408 Grace St | 0.58mi | 3/1.0 (+1) | 1,248 (+5%) | 12mo | $150,350 | $120 | 49 |
| 382 Fourth Ave | 0.50mi | 3/1.0 (+1) | 1,352 (+14%) | 0mo | $87,000 | $64 | 48 |
| 341 Auburn St | 0.71mi | 2/1.0 | 1,096 (-8%) | 11mo | $15,000 | $14 | 45 |
| 297 5th Ave | 0.55mi | 3/1.0 (+1) | 1,128 (-5%) | 21mo | $93,000 | $82 | 44 |
| 303 Fifth | 0.54mi | 3/1.0 (+1) | 1,302 (+10%) | 13mo | $95,000 | $73 | 43 |
| 395 Fifth Ave | 0.45mi | 3/2.5 (+1) | 1,311 (+10%) | 23mo | $165,000 | $126 | 31 |
Match score weights: distance 35% · size 25% · config 20% · recency 20%. Top-matched comps best support the ARV.
Projected returns pro-forma
-3.0% appreciation · 3.0% rent growth · sell at horizon
- IRR
- -14.8%
- Equity multiple
- 0.47×
- Total profit
- $-18,497
- Equity at exit
- $18,623
- IRR
- -6.2%
- Equity multiple
- 0.60×
- Total profit
- $-13,944
- Equity at exit
- $10,799
Cash invested: $34,972 (down + closing). Projections, not guarantees.
Landlord ↔ Tenant lean methodology
- Overall (STATE)
- 73 Landlord-Friendly
- State Ohio
- 73 Landlord-Friendly · R+6
- County
- — inherits STATE
- City
- — inherits STATE
ZIP-level market 44905
- Home prices YoY
- -24.4%
- Active inventory
- 33
- Price-to-rent
- 10.0×
Monthly cashflow live
- Estimated rent
- $1,036 medium interval (Pro) →
- Mortgage (P&I)
- −$655
- Tax from tax record
- −$83 /mo · $1,001/yr
- Insurance
- −$52
- HOA
- −$0
- Vacancy / Maint / Mgmt
- −$218
- Net cashflow
- $28
Break-even live
Sensitivity live
| Price | -10% $99 | -5% $63 | +0% $28 | +5% $-8 | +10% $-43 |
|---|---|---|---|---|---|
| Rent | -10% $-54 | -5% $-13 | +0% $28 | +5% $69 | +10% $110 |
| Rate | -1.0pp $91 | -0.5pp $60 | base $28 | +0.5pp $-5 | +1.0pp $-37 |
UW: 25.0% down · 7.5% · 30yr · 1.5% tax · 5.0% vac · 8.0% maint · 8.0% mgmt
Financing live
Cash to close
- Down payment
- $31,225
- Closing costs
- $3,747
- Reserves months
- —
- Total cash needed
- —
Loan-product check · same deal, 3 products live
Conventional
25% down · 7.5% · 30yr
- Down + closing
- —
- Monthly P&I
- —
- Monthly cashflow
- —
- DSCR
- —
- Eligible?
- —
Personal DTI + credit; lowest rate.
DSCR
20% down · 8.5% · 30yr
- Down + closing
- —
- Monthly P&I
- —
- Monthly cashflow
- —
- DSCR
- —
- Eligible?
- —
No personal income docs; deal must DSCR.
Hard money
10% down · 12.0% · 12mo
- Down + closing
- —
- Monthly P&I
- —
- Monthly cashflow
- —
- DSCR
- —
- Eligible?
- —
Short-term bridge; refi at stabilization.
Listing history 5 events
-
2026-06-12statusdays on market $124,900 Pending 54 DOM
-
2026-06-09days on market $124,900 Active 51 DOM
-
2026-06-08days on market $124,900 Active 50 DOM
-
2026-06-08remarks 689-char remark
-
2026-06-08$124,900 Active 49 DOM
ⓘ Source: listings_history table (triggers on properties + properties_extension) + one-shot
backfill from property_details.listing_events for pre-trigger history.
Tax reassessment forecast OH · Partial reset (capped growth)
- Current annual tax
- $1,001 · $83/mo
- Projected year-2 tax
- $1,475 · $123/mo
- Expected delta
- +$474/yr (+$39/mo · 47.3%)
ⓘ Screening estimate from a state-policy table — verify with the county assessor before closing.
Climate risk First Street
- Flood 1/10 Low FEMA zone X (unshaded) · 0% chance over 30 yrs
- Wildfire 1/10 Low
- Heat 3/10 Moderate 7 d/yr ≥96°F today · 17 d/yr by 30 yrs out
- Wind 2/10 Low 0% chance of damaging wind over 30 yrs
- Air quality 2/10 Low 1 unhealthy d/yr today · 1 by 30 yrs out
Nearby sold comps map
Loading sold comps map…
Walkable amenities ~0.75 mi
Loading nearby amenities…
Taxation est. · year 1
- Rental income
- $12,429
- − Mortgage interest
- −$6,996
- − Property taxes
- −$1,001
- − Insurance
- −$624
- − Repairs & maintenance
- −$994
- − Management
- −$994
- − Depreciation
- −$3,633
- Taxable loss
- −$1,815
- Est. tax savings @ 24.0%
- +$436
- After-tax cash flow
- $769/yr
For passive investors: Depreciation is non-cash, so a rental often shows a tax loss while cash-flowing — sheltering income. Rental losses are passive: they offset passive income freely, and up to $25,000/yr can offset ordinary (W-2) income if you actively participate and your MAGI is under $100k (phasing out to $0 by $150k); unused losses carry forward. On sale, claimed depreciation is recaptured at up to 25%, and gains may owe capital-gains tax (a 1031 exchange can defer both). Figures are a year-1 estimate at your 24.0% rate — not tax advice; consult a CPA.
Schools (NCES district)
- District
- Madison Local
- NCES district ID
- 3904945
- Math proficiency
- 48% ▼ -13.00%
- Reading proficiency
- 56% ▼ -6.00%
- Median HH income
- $39,880
- Composite
- 43.45/100
- National rank
- #3007
- State rank
- #430 of 656 in OH
Livability — Mansfield
- Score
- 76/100
- State rank
- #224
- US rank
- #3525
Category grades
Schools grade is shown separately in the Schools card above.
Census & demographics
- Census place
- Mansfield, OH
- County
- Richland · 128,966 people
- City population
- 16,349
- Metro
- Mansfield, OH
- Population (ZIP)
- 16,254
- Household income
- $55,716
- Rent vs Own
- Severe rent burden
- 3.1
Population outlook (Richland County) Hauer SSP2
- Today (2025)
- 115,577 people
- By 2030
- 111,669 · -3.4%
- By 2040
- 103,323 · -10.6%
- By 2050
- 95,135 · -17.7%
- By 2075
- 76,719 · -33.6%
- By 2100
- 57,188 · -50.5%
Race, ethnicity, and origin ACS 2023
- Neighborhood character
- Predominantly White (76%)
- Race & ethnicity
- White 76% Black 14% Two or more races 6% Hispanic / Latino 5%
- Common ancestry
- Serbian 2% Iranian 2% Romanian 1%
- Foreign-born
- 1% · Canada
- Languages at home
- 96% English-only · Spanish 2%
Political lean MEDSL · Richland
- 2024 margin
- Solid R (+42.3) · D 28.4% · R 70.8%
- 2008→2024 swing
- -28.8pp toward R · 2008: -13.6pp · 2024: -42.3pp
- All cycles
- 2024: R+42.3 2020: R+39.7 2016: R+37.5 2012: R+20.1 2008: R+13.6
Not yet ingested
- Civics
- —
Market trends
- HPI YoY
- ▼ -85.07%
- Current HPI
- 264.3148
- Rent YoY
- —
- Metro
- —
- State GDP YoY
- ▲ 1.98%
- F500 in state
- 48
Industry mix (Fortune 500 HQ in OH)
| Industry | F500 HQs | Revenue |
|---|---|---|
| Insurance | 3 | $145B |
|
||
| Industrial Machinery | 3 | $49B |
|
||
| Financial Services | 3 | $24B |
|
||
| Consumer Goods | 2 | $93B |
|
||
| Aerospace / Defense | 2 | $47B |
|
||
| Utilities | 2 | $33B |
|
||
Price history
+131.3% since first listed18 events — show timeline
- 2026-05-21 Relisted — MARMLS
- 2026-05-07 Pending — MARMLS
- 2026-04-30 Price Changed $124,900 MARMLS
- 2026-04-15 Relisted — MARMLS
- 2026-04-14 Pending — MARMLS
- 2026-04-04 Listed $134,900 MARMLS
- 2023-07-13 Sold (Public Records) $99,900 Public Records
- 2023-07-11 Sold (MLS) $99,900 MARMLS
- 2023-07-11 Sold (MLS) $99,900 ABOR
- 2023-07-11 Sold (MLS) $99,900 CBRMLS
- 2023-06-09 Pending — MARMLS
- 2023-06-09 Pending — CBRMLS
- 2023-06-06 Listed $99,900 MARMLS
- 2023-06-06 Listed $99,900 ABOR
- 2023-06-05 Listed $99,900 CBRMLS
- 2005-06-17 Sold (MLS) $48,400 MLSNOW
- 2005-04-29 Listed $50,000 MLSNOW
- 1997-06-18 Sold (Public Records) $54,000 Public Records
Property tax history
+5.2%/yrLatest (2025): $1,001 · -2.3% YoY. Source: county tax records.
Cash-flow waterfall
monthlySold comps — $/sqft
last 12 mo · ≤1 miLoading sold comps…