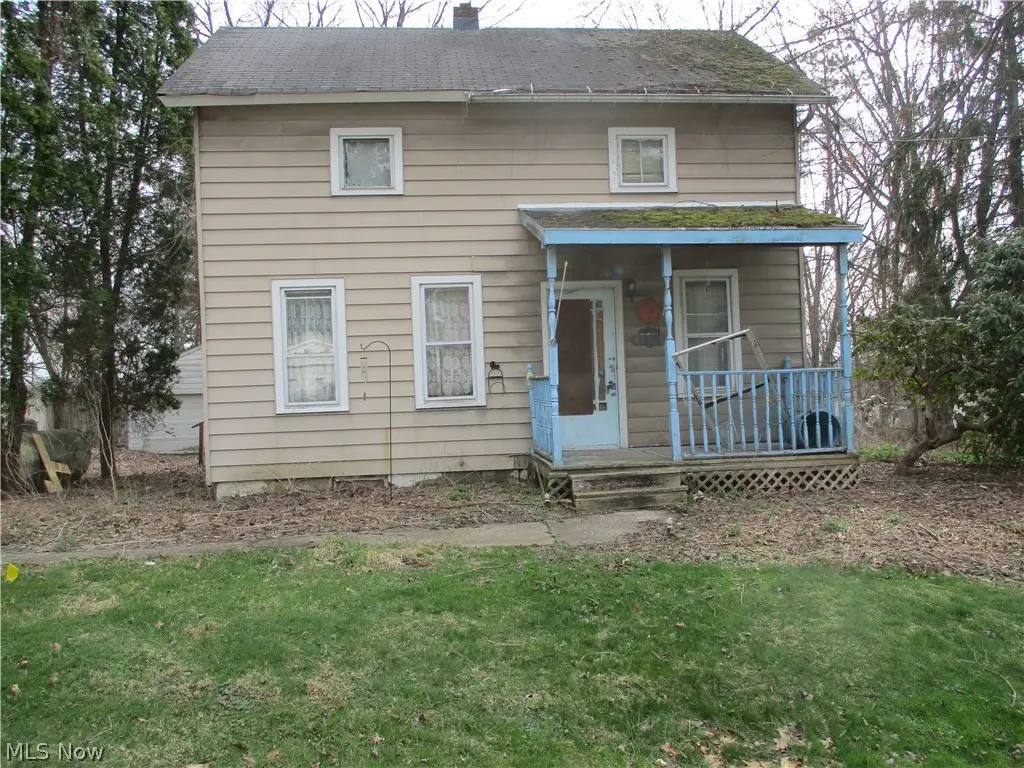
14831 Calaboone Rd · Doylestown, OH
Flood risk 1/10 · Minimal
- FEMA flood zone
- X (unshaded)
- Chance of flooding over 30 yrs
- 0.0%
- Est. flood insurance / yr
- $473 – $860
Fire risk 1/10 · Minimal
- Est. fire insurance / yr
- $713 – $1,323
Heat risk 2/10 · Minimal
- Hot days now (above 96°F)
- 7 days/yr
- Hot days in 30 yrs
- 17 days/yr
Wind risk 2/10 · Minimal
- Chance of severe wind over 30 yrs
- —
Air-quality risk 2/10 · Minimal
- Unhealthy air days now
- 1 days/yr
- Unhealthy air days in 30 yrs
- 1 days/yr
Risk factors via First Street. Map © Google.
Why this score? — see what drove the B grade
The composite is a weighted blend of 9 inputs, each scored 0–100. Each bar is that input's sub-score; the figure is the points it added to the 100-point composite (weight × sub-score).
- Cash flow +30.0/30.0
- 1% rule +10.0/10.0
- DSCR +10.0/10.0
- ARV discount +7.5/15.0
- Schools +6.3/10.0
- Livability +3.9/5.0
- Rent growth +2.5/5.0
- Condition / age +2.5/5.0
- Appreciation +0.0/10.0
$45,000
🖨 Deal sheet (PDF) 📄 Offer letter ✓ Due diligence
Listing remarks
Great investment home, needs work to settle an estate right off Route 21.
Key facts
- 0.73 acre lot
- 2 garage spots
- Built 1900
Neighborhood map
What this means for you Summary
Snapshot
- This is a 3-bed/1.0-bath single-family listed at $45k.
Deal economics
- At list price, monthly cash flow is $465 ($6k/yr) — positive.
- The deal already cash-flows at list — no discount required.
- Meets the 1% rule at list price ($1k rent vs $45k).
Location & tenants
- Location reads 78/100 on livability (#156 in OH, #2,375 nationally) — a middle-class / working-renter tenant base. Strengths: schools A+, crime A+, cost of living A+; Watch: amenities F, commute F.
- Chippewa Local (suburban): math 71% / reading 76% proficiency, ranked #116 of 656 in OH (top 18%) — strong family-tenant draw, lease renewals of 3-5y typical.
- Market conditions: 30 active listings in the ZIP; 2 comparable units currently listed for rent nearby; 284 units permitted in Wayne County in 2024 (42 in 5+ unit buildings).
- This rent is only 17% of the median local income ($74k/yr) — well below the 30% rent-burden line; pricing power to push rent on renewal without tenant pushback.
Forward outlook
- Local home prices are declining (-3.0%/yr); year-one equity from $311 of loan paydown is wiped out by about $1k of value loss. Plan a longer hold.
- Wayne County population projected to shrink 6% by 2050 — rents likely to lag national; underwrite the cash flow, not the appreciation.
- At projected returns (-3.0% appreciation + 3.0% rent growth), your $13k cash investment doubles in ~3 years — after that, you're playing with house money.
Negotiation context
- Only 4 days on market — expect competitive offers; lowballing is unlikely to land.
- 4 sale attempts since 32y ago with the ask held roughly flat each time — persistent listings suggest the price (not the market) is what's stuck; bring a comps-based counter.
Risks & watch-outs
- Watch-outs: property tax is 3.5% of price; built in 1900 — expect roof / HVAC / electrical / plumbing capex.
Questions for the listing agent
- Built in 1900 — when were the roof, HVAC, electrical panel, plumbing, and water heater last replaced?
- Property tax is high relative to price — has the assessment been appealed recently, and will the sale trigger a re-assessment?
- Is there a deadline driving the sale (1031 exchange, divorce, estate, relocation)? That informs how much negotiation room exists.
- Schools are A-rated — typically a magnet for longer-tenancy family renters. What's the average tenant stay here, and is there a school-zone premium baked into asking?
- What's the average days-on-market for RENTAL listings here right now (not sales)? A rising rental-DOM trend means longer vacancies and softer asking-rent achievability than the comps imply.
- What's the recent tenant-quality profile in this submarket — average credit score on applications, eviction rate, late-payment / NSF rate, and stable-employment percentage? A property-management company in the area should have these aggregated.
- How much new for-sale + rental construction is in the pipeline within 1–3 miles? Heavy new supply typically softens prices + rents 12–24 months out; constrained supply supports both.
Investment metrics
- 1% rule
- 2.39% ✓
- Cap rate
- 18.69%
- Cash-on-cash
- 44.29%
- DSCR
- 2.97
- GRM
- 3.5
CMA / ARV
- ARV (on-the-fly)
- $172,914
- Comps found
- 3
Show comp detail 3 sales within ~0.75 mi
| Address | Dist | Beds/Ba | Sqft | Sold | Price | $/sf | Match |
|---|---|---|---|---|---|---|---|
| 77 Koehler Ave | 0.52mi | 3/1.0 | 1,014 (-6%) | 6mo | $150,000 | $148 | 62 |
| 517 N Portage St | 0.51mi | 2/1.5 (-1) | 1,088 (+1%) | 7mo | $174,900 | $161 | 62 |
| 579 Summit St | 0.51mi | 2/1.5 (-1) | 1,032 (-4%) | 19mo | $219,900 | $213 | 46 |
Match score weights: distance 35% · size 25% · config 20% · recency 20%. Top-matched comps best support the ARV.
Projected returns pro-forma
-3.0% appreciation · 3.0% rent growth · sell at horizon
- IRR
- 41.3%
- Equity multiple
- 2.78×
- Total profit
- $22,388
- Equity at exit
- $6,710
- IRR
- 47.6%
- Equity multiple
- 5.59×
- Total profit
- $57,883
- Equity at exit
- $3,891
Cash invested: $12,600 (down + closing). Projections, not guarantees.
Landlord ↔ Tenant lean methodology
- Overall (STATE)
- 73 Landlord-Friendly
- State Ohio
- 73 Landlord-Friendly · R+6
- County
- — inherits STATE
- City
- — inherits STATE
ZIP-level market 44230
- Home prices YoY
- -24.7%
- Active inventory
- 30
- Price-to-rent
- 3.5×
Monthly cashflow live
- Estimated rent
- $1,075 medium interval (Pro) →
- Mortgage (P&I)
- −$236
- Tax from tax record
- −$129 /mo · $1,554/yr
- Insurance
- −$19
- HOA
- −$0
- Vacancy / Maint / Mgmt
- −$226
- Net cashflow
- $465
Break-even live
Sensitivity live
| Price | -10% $491 | -5% $478 | +0% $465 | +5% $452 | +10% $440 |
|---|---|---|---|---|---|
| Rent | -10% $380 | -5% $423 | +0% $465 | +5% $508 | +10% $550 |
| Rate | -1.0pp $488 | -0.5pp $476 | base $465 | +0.5pp $453 | +1.0pp $442 |
UW: 25.0% down · 7.5% · 30yr · 1.5% tax · 5.0% vac · 8.0% maint · 8.0% mgmt
Financing live
Cash to close
- Down payment
- $11,250
- Closing costs
- $1,350
- Reserves months
- —
- Total cash needed
- —
Loan-product check · same deal, 3 products live
Conventional
25% down · 7.5% · 30yr
- Down + closing
- —
- Monthly P&I
- —
- Monthly cashflow
- —
- DSCR
- —
- Eligible?
- —
Personal DTI + credit; lowest rate.
DSCR
20% down · 8.5% · 30yr
- Down + closing
- —
- Monthly P&I
- —
- Monthly cashflow
- —
- DSCR
- —
- Eligible?
- —
No personal income docs; deal must DSCR.
Hard money
10% down · 12.0% · 12mo
- Down + closing
- —
- Monthly P&I
- —
- Monthly cashflow
- —
- DSCR
- —
- Eligible?
- —
Short-term bridge; refi at stabilization.
Rent comps 2 comps
| Address | Beds | Baths | Sqft | Rent | $/sqft | DOM | Units | Dist |
|---|---|---|---|---|---|---|---|---|
| 240 Collier Dr Doylestown, OH | 2.0 | 1.5 | 904 | $1,100 | $1.22 | 2d | 1 | 1.23mi |
| 240 Collier Dr Doylestown, OH | 2.0 | 1.5 | 904 | $1,050 | $1.16 | 8d | 1 | 1.23mi |
Listing history 8 events
-
2026-03-27status Pending
-
2026-03-23$45,000 Active
-
1997-05-19soldstatus $80,000
-
1997-03-19$84,000
-
1994-04-18soldstatus $72,500
-
1994-04-18soldstatus $72,500
-
1994-02-03$74,900
-
1994-01-30$74,900
ⓘ Source: listings_history table (triggers on properties + properties_extension) + one-shot
backfill from property_details.listing_events for pre-trigger history.
Tax reassessment forecast OH · Partial reset (capped growth)
- Current annual tax
- $1,554 · $129/mo
- Projected year-2 tax
- $1,554 · $129/mo
- Expected delta
- $0/yr ($0/mo · 0.0%)
ⓘ Screening estimate from a state-policy table — verify with the county assessor before closing.
Climate risk First Street
- Flood 1/10 Low FEMA zone X (unshaded) · 0% chance over 30 yrs
- Wildfire 1/10 Low
- Heat 2/10 Low 7 d/yr ≥96°F today · 17 d/yr by 30 yrs out
- Wind 2/10 Low
- Air quality 2/10 Low 1 unhealthy d/yr today · 1 by 30 yrs out
Nearby sold comps map
Loading sold comps map…
Walkable amenities ~0.75 mi
Loading nearby amenities…
Taxation est. · year 1
- Rental income
- $12,900
- − Mortgage interest
- −$2,521
- − Property taxes
- −$1,554
- − Insurance
- −$225
- − Repairs & maintenance
- −$1,032
- − Management
- −$1,032
- − Depreciation
- −$1,309
- Taxable income
- $5,228
- Est. tax owed @ 24.0%
- −$1,255
- After-tax cash flow
- $4,326/yr
For passive investors: Depreciation is non-cash, so a rental often shows a tax loss while cash-flowing — sheltering income. Rental losses are passive: they offset passive income freely, and up to $25,000/yr can offset ordinary (W-2) income if you actively participate and your MAGI is under $100k (phasing out to $0 by $150k); unused losses carry forward. On sale, claimed depreciation is recaptured at up to 25%, and gains may owe capital-gains tax (a 1031 exchange can defer both). Figures are a year-1 estimate at your 24.0% rate — not tax advice; consult a CPA.
Schools (NCES district)
- District
- Chippewa Local
- NCES district ID
- 3905053
- Math proficiency
- 71% ▼ -9.00%
- Reading proficiency
- 76% ▼ -4.00%
- Median HH income
- $55,979
- Composite
- 62.83/100
- National rank
- #664
- State rank
- #116 of 656 in OH
Livability — Doylestown
- Score
- 78/100
- State rank
- #156
- US rank
- #2375
Category grades
Schools grade is shown separately in the Schools card above.
Census & demographics
- County
- Wayne · 117,095 people
- City population
- 8,225
- Population (ZIP)
- 8,225
- Household income
- $74,429
- Rent vs Own
- Severe rent burden
- 10.3
Population outlook (Wayne County) Hauer SSP2
- Today (2025)
- 116,616 people
- By 2030
- 116,214 · -0.3%
- By 2040
- 113,891 · -2.3%
- By 2050
- 109,009 · -6.5%
- By 2075
- 94,622 · -18.9%
- By 2100
- 70,577 · -39.5%
Race, ethnicity, and origin ACS 2023
- Neighborhood character
- Predominantly White (89%)
- Race & ethnicity
- White 89% Asian 6% Two or more races 4% Hispanic / Latino 4%
- Common ancestry
- Lithuanian 4% Slovak 2% Romanian 2%
- Foreign-born
- 6% · India, Canada
- Languages at home
- 94% English-only · Other Indo-European 6%
Political lean MEDSL · Wayne
- 2024 margin
- Solid R (+39.3) · D 29.9% · R 69.2%
- 2008→2024 swing
- -24.6pp toward R · 2008: -14.6pp · 2024: -39.3pp
- All cycles
- 2024: R+39.3 2020: R+37.0 2016: R+34.9 2012: R+21.3 2008: R+14.6
Not yet ingested
- Civics
- —
Market trends
- HPI YoY
- ▼ -74.51%
- Current HPI
- 227.4815
- Rent YoY
- —
- Metro
- —
- State GDP YoY
- ▲ 1.98%
- F500 in state
- 48
Industry mix (Fortune 500 HQ in OH)
| Industry | F500 HQs | Revenue |
|---|---|---|
| Insurance | 3 | $145B |
|
||
| Industrial Machinery | 3 | $49B |
|
||
| Financial Services | 3 | $24B |
|
||
| Consumer Goods | 2 | $93B |
|
||
| Aerospace / Defense | 2 | $47B |
|
||
| Utilities | 2 | $33B |
|
||
Price history
-39.9% since first listed8 events — show timeline
- 2026-03-27 Pending — MLSNOW
- 2026-03-23 Listed $45,000 MLSNOW
- 1997-05-19 Sold (Public Records) $80,000 Public Records
- 1997-03-19 Listed $84,000 MLSNOW
- 1994-04-18 Sold (Public Records) $72,500 Public Records
- 1994-04-18 Sold (MLS) $72,500 MLSNOW
- 1994-02-03 Listed $74,900 MLSNOW
- 1994-01-30 Listed $74,900 MLSNOW
Property tax history
+5.4%/yrLatest (2025): $1,554 · -0.5% YoY. Source: county tax records.
Cash-flow waterfall
monthlySold comps — $/sqft
last 12 mo · ≤1 miLoading sold comps…