 Triplex
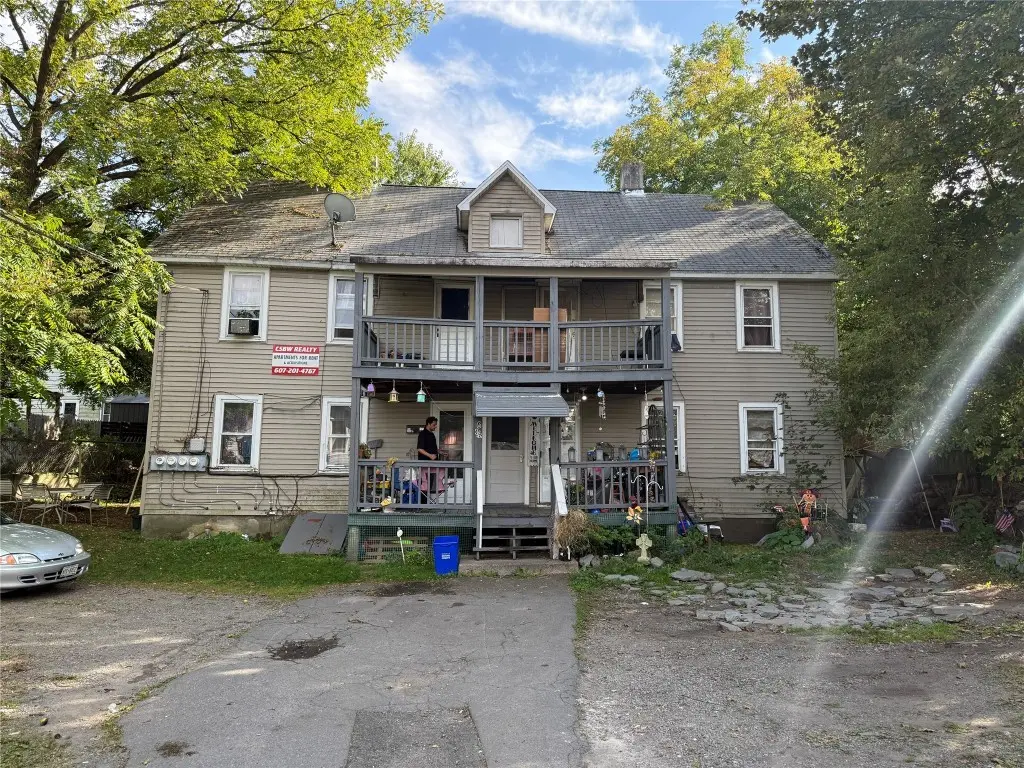
6 1/2 Evans St · Binghamton, NY
Flood risk 7/10 · Major
- FEMA flood zone
- X
- Chance of flooding over 30 yrs
- 0.77%
- Est. flood insurance / yr
- $473 – $860
Fire risk 2/10 · Minimal
- Est. fire insurance / yr
- $691 – $1,283
Heat risk 3/10 · Minor
- Hot days now (above 92°F)
- 7 days/yr
- Hot days in 30 yrs
- 17 days/yr
Wind risk 2/10 · Minimal
- Chance of severe wind over 30 yrs
- 2.0%
Air-quality risk 2/10 · Minimal
- Unhealthy air days now
- 0 days/yr
- Unhealthy air days in 30 yrs
- 1 days/yr
Risk factors via First Street. Map © Google.
Why this score? — see what drove the A grade
The composite is a weighted blend of 9 inputs, each scored 0–100. Each bar is that input's sub-score; the figure is the points it added to the 100-point composite (weight × sub-score).
- Cash flow +30.0/30.0
- ARV discount +15.0/15.0
- 1% rule +10.0/10.0
- DSCR +10.0/10.0
- Appreciation +10.0/10.0
- Livability +3.9/5.0
- Schools +3.0/10.0
- Rent growth +2.5/5.0
- Condition / age +1.0/5.0
$145,000
🖨 Deal sheet (PDF) 📄 Offer letter ✓ Due diligence
Multi-family units
County records classify this as Multi-Family (2-4 Unit). Listing-text estimate: 3 units. confirmed
Listing remarks MLS
Solid four-unit investment opportunity, with each apartment featuring two bedroooms, covered front porches and a covered rear deck that adds extra appeal for tenants. Separate utilities make management straightforward. Conveniently located and easy to maintain, this building is a practical addition to any rental portfolio.
Key facts
- Separate utilities
- Covered rear deck
- Conveniently located
Tags
Neighborhood map
What this means for you Summary
Snapshot
- This is a 3 × 3-bed/?-bath units multifamily listed at $145k. Condition is rated poor.
Deal economics
- At list price, monthly cash flow is $2k ($25k/yr) — positive. Per door: $687/mo.
- The deal already cash-flows at list — no discount required.
- Meets the 1% rule at list price ($4k rent vs $145k).
- Recommended offer: $143k (1.5% below list) — sets the bar for market timing.
- Cap rate 23.8% vs local median 6.4% in Binghamton — top-decile yield for the area; either an underpriced asset or a hidden risk that comps aren't pricing in. Stress-test before assuming the spread holds.
Location & tenants
- Location reads 78/100 on livability (#174 in NY, #2,710 nationally) — a middle-class / working-renter tenant base. Strengths: amenities A+, commute A+, cost of living A+; Watch: schools D, crime F, employment F.
- Binghamton City School District (urban): math 30% / reading 44% proficiency, ranked #557 of 590 in NY (top 94%) — families likely to look elsewhere, expect single-tenant / working-renter base with shorter leases; 61% free/reduced lunch — lower-income household profile, screen leases tightly.
- Market conditions: 112 active listings in the ZIP; 1 comparable units currently listed for rent nearby; 340 units permitted in Broome County in 2024 (269 in 5+ unit buildings).
Forward outlook
- In year one you build about $16k of equity ($1k loan paydown + $14k appreciation (10.0% local appreciation)).
- Broome County population projected at -13% by 2050 — secular population decline; favor cash flow + early exit over multi-decade hold.
- At projected returns (10.0% appreciation + 3.0% rent growth), your $41k cash investment doubles in ~2 years — after that, you're playing with house money.
- By year 3, paydown + projected appreciation supports a ~$39k cash-out refi (75% LTV) — recoverable capital for the next deal without selling this one.
Negotiation context
- It's been on market 25 days — a 2% lower offer ($143k) is reasonable based on typical stale-listing flexibility.
- 5 sale attempts since 19y ago; this cycle's ask is 4% above the opening price — seller raised mid-cycle; expect resistance to lowballs.
- Current owner paid $46k; list at $145k implies a 212% gain — meaningful room to come down on a strong offer.
Risks & watch-outs
- Watch-outs: flood insurance adds $56/mo; built in 1920 — expect roof / HVAC / electrical / plumbing capex.
- Climate carrying-cost: major flood risk — expect insurance premiums to compound above CPI over the hold.
Questions for the listing agent
- Can we see the unit-by-unit rent roll, current vacancy, and any below-market leases? What's the average tenancy length?
- What capital expenditures (roof, boiler, parking lot, exteriors) have been made in the last 5 years, and what's planned in the next 2?
- Have any recent inspections been done? Can we get a copy of the seller's disclosures and any deferred-maintenance estimates?
- Built in 1920 — when were the roof, HVAC, electrical panel, plumbing, and water heater last replaced?
- What's the actual annual flood-insurance premium (NFIP or private), and is the property in a SFHA with mandatory coverage?
- Is there a deadline driving the sale (1031 exchange, divorce, estate, relocation)? That informs how much negotiation room exists.
- Schools are D-rated, which usually means shorter tenancies and higher turnover. Who's the typical renter profile here, and what's been the actual vacancy rate?
- Crime grade is F in this area — have there been break-ins, vandalism, or insurance claims at this property in the last 3 years? What carrier currently insures it and at what premium?
- What's the average days-on-market for RENTAL listings here right now (not sales)? A rising rental-DOM trend means longer vacancies and softer asking-rent achievability than the comps imply.
- What's the recent tenant-quality profile in this submarket — average credit score on applications, eviction rate, late-payment / NSF rate, and stable-employment percentage? A property-management company in the area should have these aggregated.
- How much new apartment / multifamily construction is in the pipeline within 1–3 miles? Heavy new supply (>2% of stock underway) typically softens rents 12–24 months out; light construction supports rent growth.
Investment metrics
- 1% rule
- 2.72% ✓
- Cap rate
- 23.81%
- Cash-on-cash
- 62.57%
- DSCR
- 3.78
- GRM
- 3.1
CMA / ARV
- ARV (median comp)
- $201,673
- List price
- $145,000
- Delta
- -28.10%
- Verdict
- UNDERPRICED
- Comps
- 20 within 1.0 mi
Show comp detail 2 sales within ~0.75 mi
| Address | Dist | Beds/Ba | Sqft | Sold | Price | $/sf | Match |
|---|---|---|---|---|---|---|---|
| 162 Susquehanna St | 0.37mi | 8/2.0 (-1) | 2,600 (+9%) | 8mo | $85,000 | $33 | 49 |
| 72 Conklin Ave | 0.40mi | 8/4.0 (-1) | 2,596 (+8%) | 22mo | $226,000 | $87 | 43 |
Match score weights: distance 35% · size 25% · config 20% · recency 20%. Top-matched comps best support the ARV.
Projected returns pro-forma
10.0% appreciation · 3.0% rent growth · sell at horizon
- IRR
- 73.0%
- Equity multiple
- 6.18×
- Total profit
- $210,351
- Equity at exit
- $130,627
- IRR
- 66.9%
- Equity multiple
- 13.72×
- Total profit
- $516,392
- Equity at exit
- $281,703
Cash invested: $40,600 (down + closing). Projections, not guarantees.
Landlord ↔ Tenant lean methodology
- Overall (STATE)
- 15 Strongly Tenant-Friendly
- State New York
- 15 Strongly Tenant-Friendly · D+10
- County
- — inherits STATE
- City
- — inherits STATE
ZIP-level market 13903
- Home prices YoY
- 4.3%
- Active inventory
- 112
- Price-to-rent
- 9.2×
Monthly cashflow live
- Estimated rent
- $3,948 high interval (Pro) →
- Mortgage (P&I)
- −$760
- Tax est. 1.5%
- −$181 /mo · $2,175/yr
- Insurance
- −$60
- Flood insurance flood zone
- −$56 /mo · $666/yr
- HOA
- −$0
- Vacancy / Maint / Mgmt
- −$829
- Net cashflow
- $2,061
Break-even live
Sensitivity live
| Price | -10% $2,162 | -5% $2,111 | +0% $2,061 | +5% $2,011 | +10% $1,961 |
|---|---|---|---|---|---|
| Rent | -10% $1,749 | -5% $1,905 | +0% $2,061 | +5% $2,217 | +10% $2,373 |
| Rate | -1.0pp $2,134 | -0.5pp $2,098 | base $2,061 | +0.5pp $2,024 | +1.0pp $1,986 |
3-unit breakdown (identical units grouped — click to expand)
| Units | Beds | Baths | Est. rent |
|---|---|---|---|
| 3× units | 3 | — | $3,948 |
| #1 | 3 | — | $1,316 |
| #2 | 3 | — | $1,316 |
| #3 | 3 | — | $1,316 |
| Total (3 units) | $3,948 | ||
UW: 25.0% down · 7.5% · 30yr · 1.5% tax · 5.0% vac · 8.0% maint · 8.0% mgmt
Financing live
Cash to close
- Down payment
- $36,250
- Closing costs
- $4,350
- Reserves months
- —
- Total cash needed
- —
Loan-product check · same deal, 3 products live
Conventional
25% down · 7.5% · 30yr
- Down + closing
- —
- Monthly P&I
- —
- Monthly cashflow
- —
- DSCR
- —
- Eligible?
- —
Personal DTI + credit; lowest rate.
DSCR
20% down · 8.5% · 30yr
- Down + closing
- —
- Monthly P&I
- —
- Monthly cashflow
- —
- DSCR
- —
- Eligible?
- —
No personal income docs; deal must DSCR.
Hard money
10% down · 12.0% · 12mo
- Down + closing
- —
- Monthly P&I
- —
- Monthly cashflow
- —
- DSCR
- —
- Eligible?
- —
Short-term bridge; refi at stabilization.
Rent comps 1 comps
| Address | Beds | Baths | Sqft | Rent | $/sqft | DOM | Units | Dist |
|---|---|---|---|---|---|---|---|---|
| 81 State St Unit 2-1 10BR Binghamton, NY | 10.0 | 5.0 | 2600 | $900 | $0.35 | 44d | 1 | 0.73mi |
Listing history 9 events
-
2026-05-08status Pending 324-char remark
Show marketing remark (324 chars)
Solid four-unit investment opportunity, with each apartment featuring two bedroooms, covered front porches and a covered rear deck that adds extra appeal for tenants. Separate utilities make management straightforward. Conveniently located and easy to maintain, this building is a practical addition to any rental portfolio.
-
2026-04-24status Active 324-char remark
Show marketing remark (324 chars)
Solid four-unit investment opportunity, with each apartment featuring two bedroooms, covered front porches and a covered rear deck that adds extra appeal for tenants. Separate utilities make management straightforward. Conveniently located and easy to maintain, this building is a practical addition to any rental portfolio.
-
2026-04-24price $145,000 324-char remark
Show marketing remark (324 chars)
Solid four-unit investment opportunity, with each apartment featuring two bedroooms, covered front porches and a covered rear deck that adds extra appeal for tenants. Separate utilities make management straightforward. Conveniently located and easy to maintain, this building is a practical addition to any rental portfolio.
-
2026-01-30status Pending 324-char remark
Show marketing remark (324 chars)
Solid four-unit investment opportunity, with each apartment featuring two bedroooms, covered front porches and a covered rear deck that adds extra appeal for tenants. Separate utilities make management straightforward. Conveniently located and easy to maintain, this building is a practical addition to any rental portfolio.
-
2026-01-19$139,000 Active 324-char remark
Show marketing remark (324 chars)
Solid four-unit investment opportunity, with each apartment featuring two bedroooms, covered front porches and a covered rear deck that adds extra appeal for tenants. Separate utilities make management straightforward. Conveniently located and easy to maintain, this building is a practical addition to any rental portfolio.
-
2019-06-25$90,000
-
2017-04-05$90,000
-
2008-02-29soldstatus $46,500
-
2007-11-07$47,900
ⓘ Source: listings_history table (triggers on properties + properties_extension) + one-shot
backfill from property_details.listing_events for pre-trigger history.
Climate risk First Street
- Flood 7/10 Severe FEMA zone X · 77% chance over 30 yrs
- Wildfire 2/10 Low
- Heat 3/10 Moderate 7 d/yr ≥92°F today · 17 d/yr by 30 yrs out
- Wind 2/10 Low 2% chance of damaging wind over 30 yrs
- Air quality 2/10 Low 0 unhealthy d/yr today · 1 by 30 yrs out
Nearby sold comps map
Loading sold comps map…
Walkable amenities ~0.75 mi
Loading nearby amenities…
Taxation est. · year 1
- Rental income
- $47,376
- − Mortgage interest
- −$8,122
- − Property taxes
- −$2,175
- − Insurance
- −$1,392
- − Repairs & maintenance
- −$3,790
- − Management
- −$3,790
- − Depreciation
- −$4,218
- Taxable income
- $23,889
- Est. tax owed @ 24.0%
- −$5,733
- After-tax cash flow
- $19,002/yr
For passive investors: Depreciation is non-cash, so a rental often shows a tax loss while cash-flowing — sheltering income. Rental losses are passive: they offset passive income freely, and up to $25,000/yr can offset ordinary (W-2) income if you actively participate and your MAGI is under $100k (phasing out to $0 by $150k); unused losses carry forward. On sale, claimed depreciation is recaptured at up to 25%, and gains may owe capital-gains tax (a 1031 exchange can defer both). Figures are a year-1 estimate at your 24.0% rate — not tax advice; consult a CPA.
Condition & rehab AI · 8 photos
This multi-family property requires extensive repairs and maintenance, including exterior painting, interior painting, and flooring replacement. Upgrading the HVAC and mechanical systems and improving the landscaping can significantly increase its value for both resale and rental purposes.
Repairs flagged
- Major exterior siding — Dirty and worn, indicating significant deterioration.
- Major interior walls — Paint is peeling, indicating significant wear and tear.
- Major kitchen flooring — Worn and in need of replacement.
- Major bathroom flooring — Worn and in need of replacement.
- Major windows — Old and may need replacement for better energy efficiency and appearance.
- Major HVAC/mechanicals — Not visible, but likely outdated and in need of replacement for better energy efficiency and comfort.
- Major landscaping — Unkempt and in need of landscaping improvements to enhance curb appeal.
Value-add opportunities
- Both exterior painting — Improves curb appeal and can increase both resale and rental value.
- Both interior painting — Enhances the appearance of the interior and can increase both resale and rental value.
- Both kitchen and bathroom flooring — Replacing worn flooring can improve the overall appearance and functionality of the home, increasing both resale and rental value.
- Both HVAC and mechanical systems — Upgrading outdated systems can improve comfort and energy efficiency, increasing both resale and rental value.
- Both landscaping — Landscaping improvements can enhance curb appeal and increase both resale and rental value.
Renovation cost estimate screening
| Repair item | Severity | Est. cost |
|---|---|---|
| exterior siding · Dirty and worn, indicating significant deterioration. | Major | $15,000–50,000 |
| interior walls · Paint is peeling, indicating significant wear and tear. | Major | $15,000–50,000 |
| kitchen flooring · Worn and in need of replacement. | Major | $15,000–50,000 |
| bathroom flooring · Worn and in need of replacement. | Major | $15,000–50,000 |
| windows · Old and may need replacement for better energy efficiency and appearance. | Major | $15,000–50,000 |
| HVAC/mechanicals · Not visible, but likely outdated and in need of replacement for better energy efficiency and comfort. | Major | $15,000–50,000 |
| landscaping · Unkempt and in need of landscaping improvements to enhance curb appeal. | Major | $15,000–50,000 |
| Total estimated repair cost · 7 items | $105,000–350,000 |
Value-add ROI direction
- Both exterior painting — Improves curb appeal and can increase both resale and rental value. ↑
- Both interior painting — Enhances the appearance of the interior and can increase both resale and rental value. ↑
- Both kitchen and bathroom flooring — Replacing worn flooring can improve the overall appearance and functionality of the home, increasing both resale and rental value. ↑
- Both HVAC and mechanical systems — Upgrading outdated systems can improve comfort and energy efficiency, increasing both resale and rental value. ↑
- Both landscaping — Landscaping improvements can enhance curb appeal and increase both resale and rental value. ↑
ⓘ Cost ranges are severity-bucket heuristics (US national rule-of-thumb). Get contractor quotes + a written scope before underwriting a rehab budget.
Schools (NCES district)
- District
- Binghamton City School District
- NCES district ID
- 3604870
- Math proficiency
- 30% ▬ 0.00%
- Reading proficiency
- 44% ▲ 15.00%
- Median HH income
- $30,475
- Composite
- 30.09/100
- National rank
- #6342
- State rank
- #557 of 590 in NY
Livability — Binghamton
- Score
- 78/100
- State rank
- #174
- US rank
- #2710
Category grades
Schools grade is shown separately in the Schools card above.
Census & demographics
- Census place
- Binghamton, NY
- County
- Broome County · 126,805 people
- City population
- 65,170
- Metro
- Binghamton, NY
- Population (ZIP)
- 17,569
- Household income
- $66,278
- Rent vs Own
- Severe rent burden
- 602.0
Population outlook (Broome County) Hauer SSP2
- Today (2025)
- 187,989 people
- By 2030
- 183,066 · -2.6%
- By 2040
- 172,228 · -8.4%
- By 2050
- 163,161 · -13.2%
- By 2075
- 153,641 · -18.3%
- By 2100
- 140,851 · -25.1%
Race, ethnicity, and origin ACS 2023
- Neighborhood character
- Predominantly White (80%)
- Race & ethnicity
- White 80% Black 9% Two or more races 6% Hispanic / Latino 4% Asian 1%
- Common ancestry
- Romanian 6% Slovak 2% Scotch-Irish 2%
- Foreign-born
- 5% · Canada
- Languages at home
- 94% English-only · Spanish 2% Other Indo-European 1% Arabic 1%
Political lean MEDSL · Broome
- 2024 margin
- Toss-up / Even · D 50.2% · R 49.8%
- 2008→2024 swing
- -7.6pp toward R · 2008: 8.0pp · 2024: 0.4pp
- All cycles
- 2024: D+0.4 2020: D+3.5 2016: R+3.7 2012: D+4.6 2008: D+8.0
Not yet ingested
- Civics
- —
Market trends
- HPI YoY
- ▲ 11.68%
- Current HPI
- 286.1001
- Rent YoY
- —
- Metro
- Binghamton, NY
- State GDP YoY
- ▲ 2.60%
- F500 in state
- 92
Industry mix (Fortune 500 HQ in NY)
| Industry | F500 HQs | Revenue |
|---|---|---|
| Financial Services | 10 | $950B |
|
||
| Consumer Goods | 9 | $162B |
|
||
| Insurance | 4 | $225B |
|
||
| Telecommunications | 2 | $144B |
|
||
| Pharmaceuticals | 2 | $112B |
|
||
| Media / Entertainment | 2 | $69B |
|
||
Price history
+202.7% since first listed9 events — show timeline
- 2026-05-08 Pending — GBAOR
- 2026-04-24 Relisted — GBAOR
- 2026-04-24 Price Changed $145,000 GBAOR
- 2026-01-30 Pending — GBAOR
- 2026-01-19 Listed $139,000 GBAOR
- 2019-06-25 Listed $90,000 GBAOR
- 2017-04-05 Listed $90,000 GBAOR
- 2008-02-29 Sold (MLS) $46,500 GBAOR
- 2007-11-07 Listed $47,900 GBAOR
Cash-flow waterfall
monthlySold comps — $/sqft
last 12 mo · ≤1 miLoading sold comps…