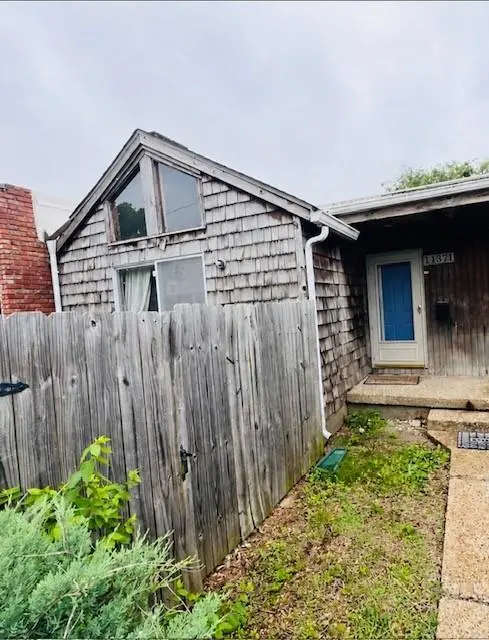
11371 Calico Dr · Kansas City, MO
Flood risk 1/10 · Minimal
- FEMA flood zone
- X (unshaded)
- Chance of flooding over 30 yrs
- 0.0%
- Est. flood insurance / yr
- $473 – $860
Fire risk 3/10 · Minor
- Est. fire insurance / yr
- $1,054 – $1,958
Heat risk 4/10 · Minor
- Hot days now (above 106°F)
- 7 days/yr
- Hot days in 30 yrs
- 17 days/yr
Wind risk 2/10 · Minimal
- Chance of severe wind over 30 yrs
- —
Air-quality risk 3/10 · Minor
- Unhealthy air days now
- 3 days/yr
- Unhealthy air days in 30 yrs
- 3 days/yr
Risk factors via First Street. Map © Google.
Why this score? — see what drove the D+ grade
The composite is a weighted blend of 9 inputs, each scored 0–100. Each bar is that input's sub-score; the figure is the points it added to the 100-point composite (weight × sub-score).
- ARV discount +15.0/15.0
- Cash flow +9.9/30.0
- 1% rule +5.6/10.0
- Rent growth +4.3/5.0
- Livability +3.9/5.0
- DSCR +2.8/10.0
- Condition / age +2.5/5.0
- Schools +1.1/10.0
- Appreciation +0.0/10.0
$123,000
🖨 Deal sheet (PDF) 📄 Offer letter ✓ Due diligence
Listing remarks MLS
Super clean and many updates! NEW LVP flooring in kitchen and bathrooms, NEW stove, NEW dishwasher, NEW refrigerator, NEW microwave, NEW carpet, NEW interior paint, and NEW tile in the bathroom shower, and NEW bathroom vanities. Come see it for yourself as there is so much more space here than you might think. The basement is fully finished with three non-conforming bedrooms, full bathroom, laundry room, and living room. Priced to sell quick! This townhouse is maintenance provided. Schedule your showing TODAY!
Key facts
- $275 HOA
- Built 1972
- Listed 26 days
Property features AI
Finance
- HOA & community: HOA: Calico Farms HOA; Monthly HOA fee of $275; HOA covers building maintenance, lawn service, roof repair and replacement, snow removal, trash, and water
Exterior
- Parking: Off-street parking
- Utilities: Public water; Public sewer; Cable and fiber available
- Home design: Attached townhouse; Ranch floor plan; Approximately 51–75 years old
- Construction: Shingle siding; Composition roof; Finished concrete full basement with inside entrance
- Exterior features: Patio; Privacy fencing
Interior
- Kitchen: Dishwasher; Disposal; Refrigerator; Electric range; Free-standing electric oven; Pantry
- Bedrooms: 2 bedrooms (both on the first level)
- Flooring: Carpet; Luxury vinyl; Other
- Bathrooms: 2 full bathrooms, 1 half bathroom
- Heating & cooling: Natural gas heating; Electric cooling
- Interior features: Ceiling fans; Pantry; Vaulted ceilings; Storm door(s)
- Laundry & utility: Washer included; Laundry in the basement
Neighborhood map
What this means for you Summary
Snapshot
- This is a 2-bed/1.5-bath townhouse listed at $123k.
Deal economics
- At list price, monthly cash flow is $-76 ($-911/yr) — negative.
- To cash-flow at today's rent, offer at most $110k (10.9% below list).
- Meets the 1% rule at list price ($1k rent vs $123k).
- Recommended offer: $110k (10.9% below list) — sets the bar for cash-flow.
- Cap rate 5.6% vs local median 3.9% in Kansas City — top-decile yield for the area; either an underpriced asset or a hidden risk that comps aren't pricing in. Stress-test before assuming the spread holds.
Location & tenants
- Location reads 78/100 on livability (#28 in MO, #2,671 nationally) — a middle-class / working-renter tenant base. Strengths: amenities A+, commute A+, cost of living A+; Watch: crime F.
- Hickman Mills C-1 (urban): math 8% / reading 18% proficiency, ranked #314 of 324 in MO (top 97%) — low school quality limits family demand, transient renter base, plan for 1-2y turnover; 78% free/reduced lunch — lower-income household profile, screen leases tightly.
- Zoned schools: Warford Elementary (math 12% / reading 17%, grade F, #993 of 1,115 statewide, top 90%, 394 students, 100% FRL); Smith-Hale Middle (math 7% / reading 19%, grade F, #368 of 391 statewide, top 94%, 770 students, 100% FRL); Ruskin High School (math 8% / reading 47%, grade F, #416 of 521 statewide, top 80%, 1,273 students, 100% FRL) — zoned schools average 100% FRL vs 78% district-wide (22 pts higher); higher-poverty schools than district average — tighter screening recommended.
- Market conditions: Rents rising fast (+7.3%/yr); 58 active listings in the ZIP; 18 comparable units currently listed for rent nearby; rentals at typical pace (median 26d on market — plan ~3-4 weeks tenant-placement turnaround); 4,002 units permitted in Jackson County in 2024 (2,271 in 5+ unit buildings).
Forward outlook
- Local home prices are declining (-3.0%/yr); year-one equity from $850 of loan paydown is wiped out by about $4k of value loss. Plan a longer hold.
- Jackson County population projected at +4% by 2050 — modest demand growth; plan on rents tracking national, not racing it.
Negotiation context
- It's been on market 27 days — a 2% lower offer ($121k) is reasonable based on typical stale-listing flexibility.
- 4 sale attempts since 21y ago; this cycle's ask is 6% above the opening price — seller raised mid-cycle; expect resistance to lowballs.
Risks & watch-outs
- Watch-outs: HOA is 21% of rent.
Questions for the listing agent
- What do current leases actually rent for vs. the listed asking? Can we see a recent rent roll and the last 12 months of T-12 income?
- Built in 1972 — when were the roof, HVAC, electrical panel, plumbing, and water heater last replaced?
- What does the HOA fee cover, when was the last increase, and are there any pending special assessments or reserve-fund shortfalls?
- Is there a deadline driving the sale (1031 exchange, divorce, estate, relocation)? That informs how much negotiation room exists.
- Crime grade is F in this area — have there been break-ins, vandalism, or insurance claims at this property in the last 3 years? What carrier currently insures it and at what premium?
- The area grade is low — what's the realistic commute time and amenity access for the typical tenant pool here? Any planned neighborhood developments (good or bad) we should know about?
- What's the average days-on-market for RENTAL listings here right now (not sales)? A rising rental-DOM trend means longer vacancies and softer asking-rent achievability than the comps imply.
- What's the recent tenant-quality profile in this submarket — average credit score on applications, eviction rate, late-payment / NSF rate, and stable-employment percentage? A property-management company in the area should have these aggregated.
- How much new for-sale + rental construction is in the pipeline within 1–3 miles? Heavy new supply typically softens prices + rents 12–24 months out; constrained supply supports both.
Investment metrics
- 1% rule
- 1.06% ✓
- Cap rate
- 5.55%
- Cash-on-cash
- -2.65%
- DSCR
- 0.88
- GRM
- 7.9
CMA / ARV
- ARV (on-the-fly)
- $162,400
- Comps found
- 2
Show comp detail 2 sales within ~0.75 mi
| Address | Dist | Beds/Ba | Sqft | Sold | Price | $/sf | Match |
|---|---|---|---|---|---|---|---|
| 11331 Calico Dr | 0.02mi | 2/1.5 | 1,116 (-4%) | 9mo | $135,000 | $121 | 85 |
| 11232 College Ave | 0.17mi | 3/2.0 (+1) | 1,286 (+11%) | 15mo | $180,000 | $140 | 54 |
Match score weights: distance 35% · size 25% · config 20% · recency 20%. Top-matched comps best support the ARV.
Projected returns pro-forma
-3.0% appreciation · 7.33% rent growth · sell at horizon
- IRR
- -14.4%
- Equity multiple
- 0.46×
- Total profit
- $-18,655
- Equity at exit
- $18,340
- IRR
- 1.6%
- Equity multiple
- 1.14×
- Total profit
- $4,886
- Equity at exit
- $10,635
Cash invested: $34,440 (down + closing). Projections, not guarantees.
Landlord ↔ Tenant lean methodology
- Overall (STATE)
- 81 Strongly Landlord-Friendly
- State Missouri
- 81 Strongly Landlord-Friendly · R+10
- County
- — inherits STATE
- City
- — inherits STATE
ZIP-level market 64137
- Rents YoY
- 7.3%
- Active inventory
- 58
- Price-to-rent
- 7.9×
Monthly cashflow live
- Estimated rent
- $1,306 high interval (Pro) →
- Mortgage (P&I)
- −$645
- Tax from tax record
- −$136 /mo · $1,633/yr
- Insurance
- −$51
- HOA
- −$275
- Vacancy / Maint / Mgmt
- −$274
- Net cashflow
- $-76
Break-even live
Sensitivity live
| Price | -10% $-6 | -5% $-41 | +0% $-76 | +5% $-111 | +10% $-146 |
|---|---|---|---|---|---|
| Rent | -10% $-179 | -5% $-128 | +0% $-76 | +5% $-24 | +10% $27 |
| Rate | -1.0pp $-14 | -0.5pp $-45 | base $-76 | +0.5pp $-108 | +1.0pp $-140 |
UW: 25.0% down · 7.5% · 30yr · 1.5% tax · 5.0% vac · 8.0% maint · 8.0% mgmt
Financing live
Cash to close
- Down payment
- $30,750
- Closing costs
- $3,690
- Reserves months
- —
- Total cash needed
- —
Loan-product check · same deal, 3 products live
Conventional
25% down · 7.5% · 30yr
- Down + closing
- —
- Monthly P&I
- —
- Monthly cashflow
- —
- DSCR
- —
- Eligible?
- —
Personal DTI + credit; lowest rate.
DSCR
20% down · 8.5% · 30yr
- Down + closing
- —
- Monthly P&I
- —
- Monthly cashflow
- —
- DSCR
- —
- Eligible?
- —
No personal income docs; deal must DSCR.
Hard money
10% down · 12.0% · 12mo
- Down + closing
- —
- Monthly P&I
- —
- Monthly cashflow
- —
- DSCR
- —
- Eligible?
- —
Short-term bridge; refi at stabilization.
Rent comps 18 comps
| Address | Beds | Baths | Sqft | Rent | $/sqft | DOM | Units | Dist |
|---|---|---|---|---|---|---|---|---|
| 3347 E 113 Ter Unit A Kansas City, MO | 2.0 | 1.0 | 891 | $1,050 | $1.18 | 25d | 1 | 0.03mi |
| 3341 E 113 Ter Unit A Kansas City, MO | 2.0 | 1.0 | 891 | $1,050 | $1.18 | 25d | 1 | 0.03mi |
| 3333 E 113 Ter Unit A Kansas City, MO | 2.0 | 1.0 | 891 | $1,050 | $1.18 | 25d | 1 | 0.04mi |
| 11345 Calico Dr Kansas City, MO | 1.0 | 1.0 | 768 | $900 | $1.17 | 25d | 1 | 0.05mi |
| 11314 Indiana Ave Kansas City, MO | 3.0 | 1.5 | 988 | $1,500 | $1.52 | 45d | 1 | 0.09mi |
| 11255 Calico Dr Kansas City, MO | 3.0 | 1.5 | 1424 | $1,675 | $1.18 | 45d | 1 | 0.14mi |
| 11247 Calico Dr Kansas City, MO | 3.0 | 2.5 | 1424 | $1,625 | $1.14 | 45d | 1 | 0.16mi |
| 11311 Bales Ave Kansas City, MO | 3.0 | 2.0 | 1150 | $1,400 | $1.22 | 25d | 1 | 0.21mi |
| 3311 E Red Bridge Rd Kansas City, MO | 1.0–2.0 | 1.0–2.0 | 975 | $1,295 | $1.33 | 4d | 19 | 0.37mi |
| 11026 College Ln Kansas City, MO | 1.0–2.0 | 1.0–1.5 | 754 | $1,235 | $1.64 | 3d | 7 | 0.46mi |
| 11206 Norby Rd Kansas City, MO | 3.0 | 1.0 | 1025 | $1,375 | $1.34 | 25d | 1 | 0.91mi |
| 5211 E 112 Ter Kansas City, MO | 1.0 | 1.0 | 715 | $995 | $1.39 | 45d | 1 | 1.18mi |
| 10561 Cypress Ave Unit 41B Kansas City, MO | 2.0 | 1.0 | 764 | $875 | $1.15 | 45d | 1 | 1.29mi |
| 10561 Cypress Ave Unit 41C Kansas City, MO | 2.0 | 1.0 | 764 | $875 | $1.15 | 4d | 1 | 1.29mi |
| 12316 3rd St Unit 12316-01 Grandview, MO | 2.0 | 1.0 | 800 | $875 | $1.09 | 9d | 1 | 1.36mi |
| 12310 3rd St Grandview, MO | 1.0–2.0 | 1.0 | 737 | $975 | $1.32 | 4d | 6 | 1.36mi |
| 12324 3rd St Unit 12324-09 Grandview, MO | 2.0 | 1.0 | 800 | $875 | $1.09 | 9d | 1 | 1.38mi |
| 12326 3rd St Unit 12326-12 Grandview, MO | 2.0 | 1.0 | 800 | $875 | $1.09 | 6d | 1 | 1.38mi |
HOA detail
- Monthly dues
- $275 · $3,300/yr
Listing history 28 events
-
2026-06-21days on market $123,000 Active 27 DOM
-
2026-06-18days on market $123,000 Active 24 DOM
-
2026-06-17days on market $123,000 Active 23 DOM
-
2026-06-16days on market $123,000 Active 22 DOM
-
2026-06-15days on market $123,000 Active 21 DOM
-
2026-06-13days on market $123,000 Active 19 DOM
-
2026-06-13pricedays on market $123,000 Active 18 DOM
-
2026-06-09days on market $130,000 Active 15 DOM
-
2026-06-08days on market $130,000 Active 14 DOM
-
2026-06-07days on market $130,000 Active 13 DOM
-
2026-06-03days on market $130,000 Active 9 DOM
-
2026-06-02days on market $130,000 Active 8 DOM
-
2026-06-01days on market $130,000 Active 7 DOM
-
2026-05-31days on market $130,000 Active 6 DOM
-
2026-05-23historical $130,000
-
2022-09-21soldstatus
-
2022-09-16soldstatus Closed 517-char remark
Show marketing remark (517 chars)
Super clean and many updates! NEW LVP flooring in kitchen and bathrooms, NEW stove, NEW dishwasher, NEW refrigerator, NEW microwave, NEW carpet, NEW interior paint, and NEW tile in the bathroom shower, and NEW bathroom vanities. Come see it for yourself as there is so much more space here than you might think. The basement is fully finished with three non-conforming bedrooms, full bathroom, laundry room, and living room. Priced to sell quick! This townhouse is maintenance provided. Schedule your showing TODAY!
-
2022-08-22status Pending 517-char remark
Show marketing remark (517 chars)
Super clean and many updates! NEW LVP flooring in kitchen and bathrooms, NEW stove, NEW dishwasher, NEW refrigerator, NEW microwave, NEW carpet, NEW interior paint, and NEW tile in the bathroom shower, and NEW bathroom vanities. Come see it for yourself as there is so much more space here than you might think. The basement is fully finished with three non-conforming bedrooms, full bathroom, laundry room, and living room. Priced to sell quick! This townhouse is maintenance provided. Schedule your showing TODAY!
-
2022-08-17$115,900 Active 517-char remark
Show marketing remark (517 chars)
Super clean and many updates! NEW LVP flooring in kitchen and bathrooms, NEW stove, NEW dishwasher, NEW refrigerator, NEW microwave, NEW carpet, NEW interior paint, and NEW tile in the bathroom shower, and NEW bathroom vanities. Come see it for yourself as there is so much more space here than you might think. The basement is fully finished with three non-conforming bedrooms, full bathroom, laundry room, and living room. Priced to sell quick! This townhouse is maintenance provided. Schedule your showing TODAY!
-
2020-06-18soldstatus
-
2015-08-25historical
-
2015-06-01$62,000
-
2011-01-07historical
-
2010-11-06$79,900
-
2005-05-05soldstatus
-
2005-04-28soldstatus
-
2005-03-21$62,000
-
1993-11-22soldstatus
ⓘ Source: listings_history table (triggers on properties + properties_extension) + one-shot
backfill from property_details.listing_events for pre-trigger history.
Tax reassessment forecast MO · Resets to sale price
- Current annual tax
- $1,633 · $136/mo
- Projected year-2 tax
- $1,633 · $136/mo
- Expected delta
- $0/yr ($0/mo · 0.0%)
ⓘ Screening estimate from a state-policy table — verify with the county assessor before closing.
Climate risk First Street
- Flood 1/10 Low FEMA zone X (unshaded) · 0% chance over 30 yrs
- Wildfire 3/10 Moderate
- Heat 4/10 Moderate 7 d/yr ≥106°F today · 17 d/yr by 30 yrs out
- Wind 2/10 Low
- Air quality 3/10 Moderate 3 unhealthy d/yr today · 3 by 30 yrs out
Nearby sold comps map
Loading sold comps map…
Walkable amenities ~0.75 mi
Loading nearby amenities…
Taxation est. · year 1
- Rental income
- $15,667
- − Mortgage interest
- −$6,890
- − Property taxes
- −$1,633
- − Insurance
- −$615
- − Repairs & maintenance
- −$1,253
- − Management
- −$1,253
- − HOA
- −$3,300
- − Depreciation
- −$3,578
- Taxable loss
- −$2,856
- Est. tax savings @ 24.0%
- +$685
- After-tax cash flow
- $-226/yr
For passive investors: Depreciation is non-cash, so a rental often shows a tax loss while cash-flowing — sheltering income. Rental losses are passive: they offset passive income freely, and up to $25,000/yr can offset ordinary (W-2) income if you actively participate and your MAGI is under $100k (phasing out to $0 by $150k); unused losses carry forward. On sale, claimed depreciation is recaptured at up to 25%, and gains may owe capital-gains tax (a 1031 exchange can defer both). Figures are a year-1 estimate at your 24.0% rate — not tax advice; consult a CPA.
Schools (NCES district)
- District
- Hickman Mills C-1
- NCES district ID
- 2914340
- Math proficiency
- 8% ▼ -8.00%
- Reading proficiency
- 18% ▼ -4.00%
- Median HH income
- $40,908
- Composite
- 11.2/100
- National rank
- #9725
- State rank
- #314 of 324 in MO
Livability — Kansas City
- Score
- 78/100
- State rank
- #28
- US rank
- #2671
Category grades
Schools grade is shown separately in the Schools card above.
Census & demographics
- Census place
- Kansas City, MO
- County
- Jackson County · 687,798 people
- City population
- 439,467
- Metro
- Kansas City, MO-KS
- Population (ZIP)
- 9,422
- Household income
- $66,036
- Rent vs Own
- Severe rent burden
- 356.0
Population outlook (Jackson County) Hauer SSP2
- Today (2025)
- 719,589 people
- By 2030
- 731,456 · +1.6%
- By 2040
- 746,689 · +3.8%
- By 2050
- 749,289 · +4.1%
- By 2075
- 736,227 · +2.3%
- By 2100
- 668,210 · -7.1%
Race, ethnicity, and origin ACS 2023
- Neighborhood character
- Majority White (64%)
- Race & ethnicity
- White 64% Black 23% Two or more races 7% Hispanic / Latino 5% Asian 3%
- Hispanic origin (detail)
- Mexican 3%
- Common ancestry
- Portuguese 5% Italian 3% Romanian 2%
- Foreign-born
- 9% · Canada, South Korea
- Languages at home
- 88% English-only · Spanish 3% Arabic 3% French/Haitian/Cajun 1%
Political lean MEDSL · Jackson
- 2024 margin
- D (+19.3) · D 58.9% · R 39.5% · Other 1.6%
- 2008→2024 swing
- -6.1pp toward R · 2008: 25.4pp · 2024: 19.3pp
- All cycles
- 2024: D+19.3 2020: D+22.0 2016: D+16.6 2012: D+19.0 2008: D+25.4
Not yet ingested
- Civics
- —
Market trends
- HPI YoY
- ▼ -145.45%
- Current HPI
- 255.0556
- Rent YoY
- ▲ 7.33%
- Metro
- Kansas City, MO-KS
- State GDP YoY
- ▲ 1.84%
- F500 in state
- 20
Industry mix (Fortune 500 HQ in MO)
| Industry | F500 HQs | Revenue |
|---|---|---|
| Healthcare | 1 | $163B |
|
||
| Insurance | 1 | $21B |
|
||
| Industrial Technology | 1 | $17B |
|
||
| Retail | 1 | $16B |
|
||
| Industrial Distribution | 1 | $10B |
|
||
| Utilities | 1 | $9B |
|
||
Price history
+109.7% since first listed14 events — show timeline
- 2026-05-23 Coming Soon $130,000 Heartland MLS as Distributed by MLS Grid
- 2022-09-21 Sold (Public Records) — Public Records
- 2022-09-16 Sold (MLS) — Heartland MLS as Distributed by MLS Grid
- 2022-08-22 Pending — Heartland MLS as Distributed by MLS Grid
- 2022-08-17 Listed $115,900 Heartland MLS as Distributed by MLS Grid
- 2020-06-18 Sold (Public Records) — Public Records
- 2015-08-25 Listing Removed — Heartland MLS as Distributed by MLS Grid
- 2015-06-01 Listed $62,000 Heartland MLS as Distributed by MLS Grid
- 2011-01-07 Listing Removed — Heartland MLS as Distributed by MLS Grid
- 2010-11-06 Listed $79,900 Heartland MLS as Distributed by MLS Grid
- 2005-05-05 Sold (Public Records) — Public Records
- 2005-04-28 Sold (MLS) — Heartland MLS as Distributed by MLS Grid
- 2005-03-21 Listed $62,000 Heartland MLS as Distributed by MLS Grid
- 1993-11-22 Sold (Public Records) — Public Records
Property tax history
+7.1%/yrLatest (2025): $1,633 · -6.4% YoY. Source: county tax records.
Cash-flow waterfall
monthlySold comps — $/sqft
last 12 mo · ≤1 miLoading sold comps…