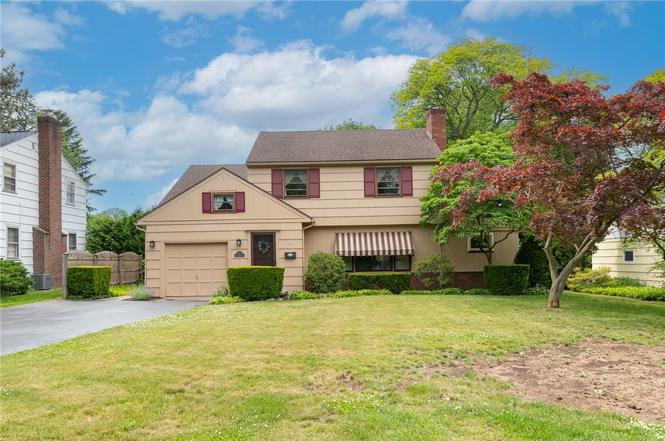
101 Newcastle Rd · Rochester, NY
Flood risk 1/10 · Minimal
- FEMA flood zone
- X (unshaded)
- Chance of flooding over 30 yrs
- 0.0%
- Est. flood insurance / yr
- $473 – $860
Fire risk 1/10 · Minimal
- Est. fire insurance / yr
- $691 – $1,283
Heat risk 2/10 · Minimal
- Hot days now (above 96°F)
- 7 days/yr
- Hot days in 30 yrs
- 15 days/yr
Wind risk 1/10 · Minimal
- Chance of severe wind over 30 yrs
- —
Air-quality risk 2/10 · Minimal
- Unhealthy air days now
- 1 days/yr
- Unhealthy air days in 30 yrs
- 2 days/yr
Risk factors via First Street. Map © Google.
Why this score? — see what drove the D+ grade
The composite is a weighted blend of 9 inputs, each scored 0–100. Each bar is that input's sub-score; the figure is the points it added to the 100-point composite (weight × sub-score).
- ARV discount +15.0/15.0
- Cash flow +14.1/30.0
- DSCR +4.3/10.0
- Livability +3.8/5.0
- 1% rule +3.2/10.0
- Rent growth +3.2/5.0
- Condition / age +2.5/5.0
- Schools +1.9/10.0
- Appreciation +0.0/10.0
$299,900
🖨 Deal sheet 📄 Offer letter ✓ Due diligence
Listing remarks
Welcome home. Nestled on picturesque, tree-lined street in one of Rochester's most welcoming neighborhood, this beautifully maintained home offers the comfort and character you've been searching for. From the moment you arrive, the mature trees and friendly neighbors set the tone for the life well-lived. Inside, thoughtful layout to include 4 bedrooms, 1 1/2 baths and timeless finishes to include hardwood floors creates a space that feels both functional and deeply livable-perfect for families, entertainers and everyone in between. Step outside and you're minutes from Rochester's vibrant dining, shopping, top rated-schools, and all the amenities the Greater Rochester area has to offer. This
Key facts
- 0.34 acre lot
- Garage
- Built 1955
Property features AI
Exterior
- Parking: Attached garage with garage door opener; 1 garage space
- Utilities: Cable available; High-speed internet available; Public water connected; Sewer connected; Circuit breaker electrical
- Home design: 2-story existing home; Resale property
- Construction: Wood siding; Copper plumbing
- Exterior features: Awning(s); Blacktop driveway; Partial fence; Patio; Near public transit; Rectangular residential lot; City street frontage; Lot dimensions approximately 70 x 209
Interior
- Kitchen: Free-standing range; Gas oven; Gas range; Oven; Refrigerator; Disposal; Eat-in kitchen
- Bedrooms: Den listed as a room type
- Flooring: Hardwood; Laminate; Luxury vinyl; Vinyl; Varies
- Bathrooms: 1 full bathroom; 1 half bathroom; 1 main-level bathroom
- Heating & cooling: Central air conditioning; Gas heating; Electric heating; Forced air; Hot water heating
- Interior features: Den; Eat-in kitchen; Window treatments; Drapes; Thermal windows; Has full basement (full)
- Laundry & utility: Dryer; Gas water heater
Neighborhood map
What this means for you Summary
Snapshot
- This is a 4-bed/1.5-bath single-family listed at $300k.
Deal economics
- At list price, monthly cash flow is $43 ($517/yr) — positive.
- The deal already cash-flows at list — no discount required.
- To meet the 1% rule (rent ≥ 1% of price), the offer needs to be $247k (17.6% below list).
- Recommended offer: $247k (17.6% below list) — sets the bar for 1% rule.
- Cap rate 6.5% vs local median 9.3% in Rochester — below-typical yield; the buyer is paying a premium for something (appreciation thesis, condition, location) that the cap rate doesn't capture.
Location & tenants
- Location reads 76/100 on livability (#222 in NY, #3,482 nationally) — a middle-class / working-renter tenant base. Strengths: commute A+, cost of living A+, housing A+; Watch: schools D+, crime F, employment F.
- Rochester City School District (urban): math 21% / reading 26% proficiency, ranked #589 of 590 in NY (top 100%) — low school quality limits family demand, transient renter base, plan for 1-2y turnover; 82% free/reduced lunch — lower-income household profile, screen leases tightly.
- Market conditions: Rents rising (+2.7%/yr); 85 active listings in the ZIP; 6 comparable units currently listed for rent nearby; rentals at typical pace (median 15d on market — plan ~3-4 weeks tenant-placement turnaround); solid renter incomes; 1,169 units permitted in Monroe County in 2024 (591 in 5+ unit buildings).
- This rent runs 34% of the median local income ($86k/yr) — at the standard rent-burdened threshold; future hikes will face affordability resistance.
Forward outlook
- Local home prices are declining (-3.0%/yr); year-one equity from $2k of loan paydown is wiped out by about $9k of value loss. Plan a longer hold.
- Monroe County population projected to shrink 6% by 2050 — rents likely to lag national; underwrite the cash flow, not the appreciation.
Negotiation context
- Only 3 days on market — expect competitive offers; lowballing is unlikely to land.
Risks & watch-outs
- Watch-outs: built in 1955 — expect roof / HVAC / electrical / plumbing capex.
Questions for the listing agent
- Built in 1955 — when were the roof, HVAC, electrical panel, plumbing, and water heater last replaced?
- Is there a deadline driving the sale (1031 exchange, divorce, estate, relocation)? That informs how much negotiation room exists.
- Schools are D-rated, which usually means shorter tenancies and higher turnover. Who's the typical renter profile here, and what's been the actual vacancy rate?
- Crime grade is F in this area — have there been break-ins, vandalism, or insurance claims at this property in the last 3 years? What carrier currently insures it and at what premium?
- The area grade is low — what's the realistic commute time and amenity access for the typical tenant pool here? Any planned neighborhood developments (good or bad) we should know about?
- What's the average days-on-market for RENTAL listings here right now (not sales)? A rising rental-DOM trend means longer vacancies and softer asking-rent achievability than the comps imply.
- What's the recent tenant-quality profile in this submarket — average credit score on applications, eviction rate, late-payment / NSF rate, and stable-employment percentage? A property-management company in the area should have these aggregated.
- How much new for-sale + rental construction is in the pipeline within 1–3 miles? Heavy new supply typically softens prices + rents 12–24 months out; constrained supply supports both.
Investment metrics
- 1% rule
- 0.82% ✗
- Cap rate
- 6.47%
- Cash-on-cash
- 0.62%
- DSCR
- 1.03
- GRM
- 10.1
CMA / ARV
- ARV (on-the-fly)
- $398,268
- Comps found
- 12
Show comp detail 12 sales within ~0.75 mi
| Address | Dist | Beds/Ba | Sqft | Sold | Price | $/sf | Match |
|---|---|---|---|---|---|---|---|
| 262 Beresford Rd | 0.19mi | 3/2.0 (-1) | 1,872 (-3%) | 7mo | $375,000 | $200 | 74 |
| 275 Yarmouth Rd | 0.16mi | 3/2.5 (-1) | 2,083 (+8%) | 1mo | $440,000 | $211 | 69 |
| 183 Corwin Rd | 0.31mi | 3/1.5 (-1) | 1,785 (-7%) | 3mo | $490,000 | $275 | 66 |
| 153 Fairhaven Rd | 0.17mi | 4/1.5 | 1,676 (-13%) | 6mo | $240,000 | $143 | 65 |
| 787 Corwin Rd | 0.55mi | 4/2.0 | 1,985 (+3%) | 4mo | $454,000 | $229 | 64 |
| 755 Corwin Rd | 0.59mi | 3/2.5 (-1) | 1,957 (+2%) | 0mo | $480,000 | $245 | 60 |
| 170 Elm Dr | 0.61mi | 4/1.5 | 1,794 (-7%) | 4mo | $300,000 | $167 | 57 |
| 33 Elm Dr | 0.57mi | 4/1.0 | 1,801 (-6%) | 8mo | $330,000 | $183 | 54 |
| 70 Lanark Cres | 0.50mi | 3/1.0 (-1) | 1,788 (-7%) | 6mo | $273,103 | $153 | 53 |
| 50 Blossom Cir E | 0.72mi | 3/2.0 (-1) | 1,841 (-4%) | 7mo | $381,000 | $207 | 47 |
| 39 Wendover Rd | 0.57mi | 3/2.0 (-1) | 1,660 (-14%) | 4mo | $330,000 | $199 | 40 |
| 116 Newcroft Park | 0.73mi | 3/3.0 (-1) | 1,652 (-14%) | 0mo | $510,000 | $309 | 31 |
Match score weights: distance 35% · size 25% · config 20% · recency 20%. Top-matched comps best support the ARV.
Projected returns pro-forma
-3.0% appreciation · 2.72% rent growth · sell at horizon
- IRR
- -15.6%
- Equity multiple
- 0.44×
- Total profit
- $-46,611
- Equity at exit
- $44,716
- IRR
- -7.7%
- Equity multiple
- 0.52×
- Total profit
- $-40,146
- Equity at exit
- $25,930
Cash invested: $83,972 (down + closing). Projections, not guarantees.
Landlord ↔ Tenant lean methodology
- Overall (STATE)
- 15 Strongly Tenant-Friendly
- State New York
- 15 Strongly Tenant-Friendly · D+10
- County
- — inherits STATE
- City
- — inherits STATE
ZIP-level market 14610
- Home prices YoY
- -23.6%
- Rents YoY
- 2.7%
- Active inventory
- 85
- Price-to-rent
- 10.1×
Monthly cashflow live
- Estimated rent
- $2,471 high interval (Pro) →
- Mortgage (P&I)
- −$1,573
- Tax from tax record
- −$211 /mo · $2,533/yr
- Insurance
- −$125
- HOA
- −$0
- Vacancy / Maint / Mgmt
- −$519
- Net cashflow
- $43
Break-even live
UW: 25.0% down · 7.5% · 30yr · 1.5% tax · 5.0% vac · 8.0% maint · 8.0% mgmt
Financing live
Cash to close
- Down payment
- $74,975
- Closing costs
- $8,997
- Reserves months
- —
- Total cash needed
- —
Loan-product check · same deal, 3 products live
Conventional
25% down · 7.5% · 30yr
- Down + closing
- —
- Monthly P&I
- —
- Monthly cashflow
- —
- DSCR
- —
- Eligible?
- —
Personal DTI + credit; lowest rate.
DSCR
20% down · 8.5% · 30yr
- Down + closing
- —
- Monthly P&I
- —
- Monthly cashflow
- —
- DSCR
- —
- Eligible?
- —
No personal income docs; deal must DSCR.
Hard money
10% down · 12.0% · 12mo
- Down + closing
- —
- Monthly P&I
- —
- Monthly cashflow
- —
- DSCR
- —
- Eligible?
- —
Short-term bridge; refi at stabilization.
Rent comps 6 comps
| Address | Beds | Baths | Sqft | Rent | $/sqft | DOM | Units | Dist |
|---|---|---|---|---|---|---|---|---|
| 176 Merwin Ave Rochester, NY | 4.0 | 1.5 | 1750 | $2,200 | $1.26 | 43d | 1 | 0.83mi |
| 1600 East Ave Rochester, NY | 3.0 | 1.0–2.0 | 944 | $2,875 | $3.04 | 2d | 1 | 0.87mi |
| 2500 East Ave Rochester, NY | 3.0 | 1.0–3.0 | 1171 | $2,520 | $2.15 | 2d | 17 | 0.93mi |
| 1079 Garson Ave Rochester, NY | 3.0 | 1.5 | 1273 | $2,100 | $1.65 | 10d | 1 | 1.08mi |
| 1159 Culver Rd Unit A2 UP Rochester, NY | 3.0 | 1.0 | 1313 | $1,500 | $1.14 | 43d | 1 | 1.43mi |
| 57 Calumet St Rochester, NY | 3.0 | 3.0 | 2500 | $2,250 | $0.90 | 14d | 1 | 1.43mi |
Listing history 4 events
-
2026-06-18days on market $299,900 Active 3 DOM
-
2026-06-17days on market $299,900 Active 2 DOM
-
2026-06-15remarks 699-char remark
-
2026-06-15$299,900 Active 1 DOM
ⓘ Source: listings_history table (triggers on properties + properties_extension) + one-shot
backfill from property_details.listing_events for pre-trigger history.
Tax reassessment forecast NY · Partial reset (capped growth)
- Current annual tax
- $2,533 · $211/mo
- Projected year-2 tax
- $3,801 · $317/mo
- Expected delta
- +$1,267/yr (+$106/mo · 50.0%)
ⓘ Screening estimate from a state-policy table — verify with the county assessor before closing.
Climate risk First Street
- Flood 1/10 Low FEMA zone X (unshaded) · 0% chance over 30 yrs
- Wildfire 1/10 Low
- Heat 2/10 Low 7 d/yr ≥96°F today · 15 d/yr by 30 yrs out
- Wind 1/10 Low
- Air quality 2/10 Low 1 unhealthy d/yr today · 2 by 30 yrs out
Nearby sold comps map
Loading sold comps map…
Walkable amenities ~0.75 mi
Loading nearby amenities…
Taxation est. · year 1
- Rental income
- $29,648
- − Mortgage interest
- −$16,799
- − Property taxes
- −$2,533
- − Insurance
- −$1,500
- − Repairs & maintenance
- −$2,372
- − Management
- −$2,372
- − Depreciation
- −$8,724
- Taxable loss
- −$4,652
- Est. tax savings @ 24.0%
- +$1,116
- After-tax cash flow
- $1,633/yr
For passive investors: Depreciation is non-cash, so a rental often shows a tax loss while cash-flowing — sheltering income. Rental losses are passive: they offset passive income freely, and up to $25,000/yr can offset ordinary (W-2) income if you actively participate and your MAGI is under $100k (phasing out to $0 by $150k); unused losses carry forward. On sale, claimed depreciation is recaptured at up to 25%, and gains may owe capital-gains tax (a 1031 exchange can defer both). Figures are a year-1 estimate at your 24.0% rate — not tax advice; consult a CPA.
Schools (NCES district)
- District
- Rochester City School District
- NCES district ID
- 3624750
- Math proficiency
- 21% ▬ 0.00%
- Reading proficiency
- 26% ▲ 4.00%
- Median HH income
- $30,923
- Composite
- 18.98/100
- National rank
- #8850
- State rank
- #589 of 590 in NY
Livability — Rochester
- Score
- 76/100
- State rank
- #222
- US rank
- #3482
Category grades
Schools grade is shown separately in the Schools card above.
Census & demographics
- Census place
- Rochester, NY
- County
- Monroe County · 674,131 people
- City population
- 432,803
- Metro
- Rochester, NY
- Population (ZIP)
- 14,311
- Household income
- $85,961
- Rent vs Own
- Severe rent burden
- 923.0
Population outlook (Monroe County) Hauer SSP2
- Today (2025)
- 759,460 people
- By 2030
- 757,154 · -0.3%
- By 2040
- 740,644 · -2.5%
- By 2050
- 714,443 · -5.9%
- By 2075
- 645,883 · -15.0%
- By 2100
- 547,084 · -28.0%
Race, ethnicity, and origin ACS 2023
- Neighborhood character
- Predominantly White (81%)
- Race & ethnicity
- White 81% Black 6% Hispanic / Latino 6% Two or more races 6% Asian 3%
- Hispanic origin (detail)
- Puerto Rican 2%
- Common ancestry
- Romanian 6% Iranian 4% Scotch-Irish 2%
- Foreign-born
- 7% · Canada, South Korea
- Languages at home
- 92% English-only · Spanish 2% Russian/Polish/Slavic 1% Other Indo-European 1%
Political lean MEDSL · Monroe
- 2024 margin
- D (+19.1) · D 59.5% · R 40.5%
- 2008→2024 swing
- +1.4pp toward D · 2008: 17.7pp · 2024: 19.1pp
- All cycles
- 2024: D+19.1 2020: D+21.0 2016: D+14.1 2012: D+17.4 2008: D+17.7
Not yet ingested
- Civics
- —
Market trends
- HPI YoY
- ▼ -86.64%
- Current HPI
- 280.8593
- Rent YoY
- ▲ 2.72%
- Metro
- Rochester, NY
- State GDP YoY
- ▲ 2.60%
- F500 in state
- 92
Industry mix (Fortune 500 HQ in NY)
| Industry | F500 HQs | Revenue |
|---|---|---|
| Financial Services | 10 | $950B |
|
||
| Consumer Goods | 9 | $162B |
|
||
| Insurance | 4 | $225B |
|
||
| Telecommunications | 2 | $144B |
|
||
| Pharmaceuticals | 2 | $112B |
|
||
| Media / Entertainment | 2 | $69B |
|
||
Price history
+0.3% since first listed2 events — show timeline
- 2026-06-15 Price Changed $299,900 UNYREIS
- 2026-06-15 Listed $299,000 UNYREIS
Property tax history
+1.8%/yrLatest (2025): $2,533 · -6.2% YoY. Source: county tax records.
Cash-flow waterfall
monthlySold comps — $/sqft
last 12 mo · ≤1 miLoading sold comps…