483 Kentucky 70 · Eubank, KY
Flood risk No data
- FEMA flood zone
- —
- Chance of flooding over 30 yrs
- —
- Est. flood insurance / yr
- —
Fire risk No data
- Est. fire insurance / yr
- —
Heat risk No data
- Hot days now (above threshold)
- —
- Hot days in 30 yrs
- —
Wind risk No data
- Chance of severe wind over 30 yrs
- —
Air-quality risk No data
- Unhealthy air days now
- —
- Unhealthy air days in 30 yrs
- —
Risk factors via First Street. Map © Google.
Why this score? — see what drove the D+ grade
The composite is a weighted blend of 9 inputs, each scored 0–100. Each bar is that input's sub-score; the figure is the points it added to the 100-point composite (weight × sub-score).
- Cash flow +14.1/30.0
- ARV discount +7.5/15.0
- Appreciation +6.1/10.0
- DSCR +4.3/10.0
- Schools +4.0/10.0
- Livability +3.2/5.0
- 1% rule +2.9/10.0
- Rent growth +2.5/5.0
- Condition / age +2.5/5.0
$179,900
🖨 Deal sheet (PDF) 📄 Offer letter ✓ Due diligence
Listing remarks
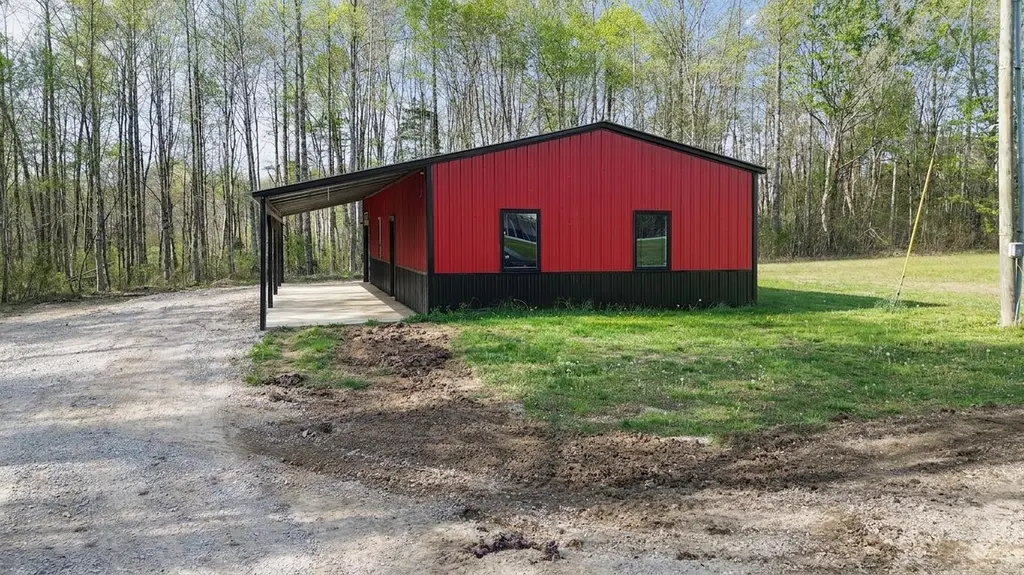
Absolutely Adorable wiht a Serene Setting. Welcome to this picture-perfect 2-bedroom, 2-bath barn-style home, where charm meets modern living. The inviting open-concept layout is filled with natural light and showcases stylish luxury vinyl flooring throughout, creating a warm yet contemporary feel. The spacious kitchen and living areas flow seamlessly—ideal for both everyday living and entertaining. Set on a generous 0.75-acre lot just off Highway 27, this property offers the perfect balance of privacy and convenience. A two-car garage provides plenty of room for vehicles, storage, or hobbies. Step out onto the covered front porch and unwind while enjoying peaceful views of the surrou
Key facts
- Covered front porch
- Spacious kitchen
- 0.75-acre lot
Tags
Property features AI
Exterior
- Parking: Has garage; Has carport
- Utilities: Septic tank sewer
- Home design: One level
- Construction: Metal siding construction; Block foundation; 888 square-foot building area
- Exterior features: Metal siding; Block foundation; Approximately 0.74-acre lot; Public water; Not on waterfront; Lot size per public records
Interior
- Bathrooms: Two full bathrooms
- Heating & cooling: Heat pump for heating and cooling
- Interior features: No fireplace; Two total rooms
Neighborhood map
What this means for you Summary
Snapshot
- This is a 2-bed/2.0-bath other listed at $180k.
Deal economics
- At list price, monthly cash flow is $28 ($330/yr) — positive.
- The deal already cash-flows at list — no discount required.
- To meet the 1% rule (rent ≥ 1% of price), the offer needs to be $142k (20.9% below list).
- Recommended offer: $142k (20.9% below list) — sets the bar for 1% rule.
- Cap rate 6.5% vs local median 4.7% in Eubank — top-decile yield for the area; either an underpriced asset or a hidden risk that comps aren't pricing in. Stress-test before assuming the spread holds.
Location & tenants
- Location reads 65/100 on livability (#262 in KY) — a middle-class / working-renter tenant base. Strengths: crime A+, cost of living A+, housing A+; Watch: amenities F, commute F, employment F.
- Pulaski County (town): math 43% / reading 53% proficiency, ranked #17 of 165 in KY (top 10%) — families likely to look elsewhere, expect single-tenant / working-renter base with shorter leases.
- Zoned schools: Eubank Elementary School (math 27% / reading 47%, grade F, #255 of 676 statewide, top 42%, 368 students, 83% FRL); Pulaski County High School (math 42% / reading 47%, grade F, #21 of 254 statewide, top 10%, 1,209 students, 57% FRL).
- Market conditions: 37 active listings in the ZIP; 117 units permitted in Pulaski County in 2024 (50 in 5+ unit buildings).
Forward outlook
- In year one you build about $5k of equity ($1k loan paydown + $4k appreciation (2.3% local appreciation)).
- At projected returns (2.3% appreciation + 3.0% rent growth), your $50k cash investment doubles in ~7 years — after that, you're playing with house money.
- By year 7, paydown + projected appreciation supports a ~$34k cash-out refi (75% LTV) — recoverable capital for the next deal without selling this one.
Negotiation context
- It's been on market 30 days — a 2% lower offer ($177k) is reasonable based on typical stale-listing flexibility.
Questions for the listing agent
- Is there a deadline driving the sale (1031 exchange, divorce, estate, relocation)? That informs how much negotiation room exists.
- The area grade is low — what's the realistic commute time and amenity access for the typical tenant pool here? Any planned neighborhood developments (good or bad) we should know about?
- What's the average days-on-market for RENTAL listings here right now (not sales)? A rising rental-DOM trend means longer vacancies and softer asking-rent achievability than the comps imply.
- What's the recent tenant-quality profile in this submarket — average credit score on applications, eviction rate, late-payment / NSF rate, and stable-employment percentage? A property-management company in the area should have these aggregated.
- How much new for-sale + rental construction is in the pipeline within 1–3 miles? Heavy new supply typically softens prices + rents 12–24 months out; constrained supply supports both.
Investment metrics
- 1% rule
- 0.79% ✗
- Cap rate
- 6.48%
- Cash-on-cash
- 0.66%
- DSCR
- 1.03
- GRM
- 10.5
CMA / ARV
- ARV (median comp)
- $110,818
- List price
- $179,900
- Delta
- 62.34%
- Verdict
- OVERPRICED
- Comps
- 4 within 1.0 mi
Projected returns pro-forma
2.28% appreciation · 3.0% rent growth · sell at horizon
- IRR
- 6.0%
- Equity multiple
- 1.33×
- Total profit
- $16,608
- Equity at exit
- $73,713
- IRR
- 9.3%
- Equity multiple
- 2.30×
- Total profit
- $65,245
- Equity at exit
- $108,306
Cash invested: $50,372 (down + closing). Projections, not guarantees.
Landlord ↔ Tenant lean methodology
- Overall (STATE)
- 83 Strongly Landlord-Friendly
- State Kentucky
- 83 Strongly Landlord-Friendly · R+16
- County
- — inherits STATE
- City
- — inherits STATE
ZIP-level market 42567
- Home prices YoY
- 0.9%
- Active inventory
- 37
- Price-to-rent
- 10.5×
Monthly cashflow live
- Estimated rent
- $1,423 medium interval (Pro) →
- Mortgage (P&I)
- −$943
- Tax from tax record
- −$78 /mo · $940/yr
- Insurance
- −$75
- HOA
- −$0
- Vacancy / Maint / Mgmt
- −$299
- Net cashflow
- $28
Break-even live
Sensitivity live
| Price | -10% $129 | -5% $78 | +0% $28 | +5% $-23 | +10% $-74 |
|---|---|---|---|---|---|
| Rent | -10% $-85 | -5% $-29 | +0% $28 | +5% $84 | +10% $140 |
| Rate | -1.0pp $118 | -0.5pp $73 | base $28 | +0.5pp $-19 | +1.0pp $-67 |
UW: 25.0% down · 7.5% · 30yr · 1.5% tax · 5.0% vac · 8.0% maint · 8.0% mgmt
Financing live
Cash to close
- Down payment
- $44,975
- Closing costs
- $5,397
- Reserves months
- —
- Total cash needed
- —
Loan-product check · same deal, 3 products live
Conventional
25% down · 7.5% · 30yr
- Down + closing
- —
- Monthly P&I
- —
- Monthly cashflow
- —
- DSCR
- —
- Eligible?
- —
Personal DTI + credit; lowest rate.
DSCR
20% down · 8.5% · 30yr
- Down + closing
- —
- Monthly P&I
- —
- Monthly cashflow
- —
- DSCR
- —
- Eligible?
- —
No personal income docs; deal must DSCR.
Hard money
10% down · 12.0% · 12mo
- Down + closing
- —
- Monthly P&I
- —
- Monthly cashflow
- —
- DSCR
- —
- Eligible?
- —
Short-term bridge; refi at stabilization.
Listing history 4 events
-
2026-06-01status $179,900 Pending 30 DOM
-
2026-05-31days on market $179,900 Active 30 DOM
-
2026-05-31days on market $179,900 Active 29 DOM
-
2026-05-01$179,900 Active 845-char remark
ⓘ Source: listings_history table (triggers on properties + properties_extension) + one-shot
backfill from property_details.listing_events for pre-trigger history.
Tax reassessment forecast KY · Resets to sale price
- Current annual tax
- $940 · $78/mo
- Projected year-2 tax
- $1,547 · $129/mo
- Expected delta
- +$607/yr (+$51/mo · 64.6%)
ⓘ Screening estimate from a state-policy table — verify with the county assessor before closing.
Nearby sold comps map
Loading sold comps map…
Walkable amenities ~0.75 mi
Loading nearby amenities…
Taxation est. · year 1
- Rental income
- $17,077
- − Mortgage interest
- −$10,077
- − Property taxes
- −$940
- − Insurance
- −$900
- − Repairs & maintenance
- −$1,366
- − Management
- −$1,366
- − Depreciation
- −$5,233
- Taxable loss
- −$2,806
- Est. tax savings @ 24.0%
- +$673
- After-tax cash flow
- $1,003/yr
For passive investors: Depreciation is non-cash, so a rental often shows a tax loss while cash-flowing — sheltering income. Rental losses are passive: they offset passive income freely, and up to $25,000/yr can offset ordinary (W-2) income if you actively participate and your MAGI is under $100k (phasing out to $0 by $150k); unused losses carry forward. On sale, claimed depreciation is recaptured at up to 25%, and gains may owe capital-gains tax (a 1031 exchange can defer both). Figures are a year-1 estimate at your 24.0% rate — not tax advice; consult a CPA.
Schools (NCES district)
- District
- Pulaski County
- NCES district ID
- 2104950
- Math proficiency
- 43% ▼ -18.00%
- Reading proficiency
- 53% ▼ -13.00%
- Median HH income
- $35,366
- Composite
- 39.69/100
- National rank
- #3906
- State rank
- #17 of 165 in KY
Livability — Eubank
- Score
- 65/100
- State rank
- #262
- US rank
- #12947
Category grades
Schools grade is shown separately in the Schools card above.
Census & demographics
- Census place
- Eubank, KY
- Population (ZIP)
- 5,150
Population outlook (Pulaski County) Hauer SSP2
- Today (2025)
- 65,414 people
- By 2030
- 65,828 · +0.6%
- By 2040
- 65,972 · +0.9%
- By 2050
- 65,108 · -0.5%
- By 2075
- 61,647 · -5.8%
- By 2100
- 53,613 · -18.0%
Race, ethnicity, and origin ACS 2023
- Neighborhood character
- Predominantly White (92%)
- Race & ethnicity
- White 92% Two or more races 5% Hispanic / Latino 3%
- Common ancestry
- Lithuanian 2% Italian 2% Slovak 1%
- Foreign-born
- 2% · Canada
- Languages at home
- 96% English-only · Spanish 3% German/W. Germanic 2%
Political lean MEDSL · Pulaski
- 2024 margin
- Solid R (+65.2) · D 16.9% · R 82.1% · Other 1.0%
- 2008→2024 swing
- -9.9pp toward R · 2008: -55.4pp · 2024: -65.2pp
- All cycles
- 2024: R+65.2 2020: R+62.7 2016: R+66.7 2012: R+60.5 2008: R+55.4
Not yet ingested
- Civics
- —
Market trends
- HPI YoY
- ▲ 2.28%
- Current HPI
- 263.9851
- Rent YoY
- —
- Metro
- —
- State GDP YoY
- ▲ 1.81%
- F500 in state
- 4
Industry mix (Fortune 500 HQ in KY)
| Industry | F500 HQs | Revenue |
|---|---|---|
| Healthcare | 1 | $118B |
|
||
| Food / Beverage | 1 | $7B |
|
||
Price history
2 events — show timeline
- 2026-06-01 Pending — ImagineMLS
- 2026-05-01 Listed $179,900 ImagineMLS
Property tax history
+2.7%/yrLatest (2025): $940 · +15.5% YoY. Source: county tax records.
Cash-flow waterfall
monthlySold comps — $/sqft
last 12 mo · ≤1 miLoading sold comps…