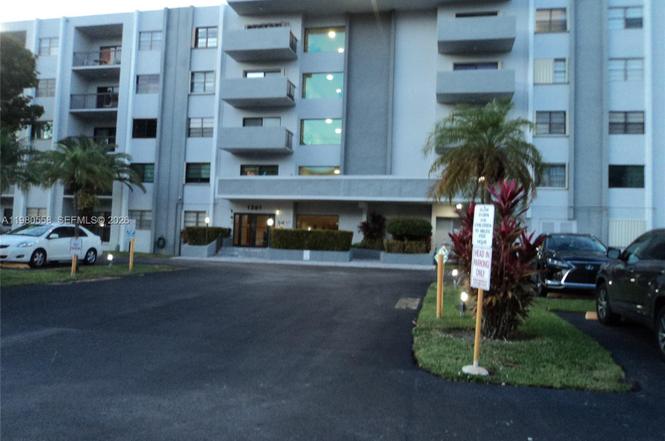
1301 NE 7th St #511 · Hallandale Beach, FL
Flood risk 7/10 · Major
- FEMA flood zone
- AE
- Chance of flooding over 30 yrs
- 0.76%
- Est. flood insurance / yr
- $1,737 – $8,500
Fire risk 1/10 · Minimal
- Est. fire insurance / yr
- $947 – $1,759
Heat risk 10/10 · Severe
- Hot days now (above 104°F)
- 7 days/yr
- Hot days in 30 yrs
- 26 days/yr
Wind risk 10/10 · Severe
- Chance of severe wind over 30 yrs
- 99.0%
Air-quality risk 2/10 · Minimal
- Unhealthy air days now
- 1 days/yr
- Unhealthy air days in 30 yrs
- 2 days/yr
Risk factors via First Street. Map © Google.
Why this score? — see what drove the C+ grade
The composite is a weighted blend of 9 inputs, each scored 0–100. Each bar is that input's sub-score; the figure is the points it added to the 100-point composite (weight × sub-score).
- Cash flow +25.4/30.0
- 1% rule +10.0/10.0
- DSCR +8.4/10.0
- ARV discount +7.5/15.0
- Schools +4.1/10.0
- Livability +4.0/5.0
- Rent growth +2.6/5.0
- Condition / age +2.5/5.0
- Appreciation +0.0/10.0
$259,000
🖨 Deal sheet 📄 Offer letter ✓ Due diligence
Listing remarks
LARGE 2/2 In Hallandale in GOOD CONDITION Location, Location ! This building is in good condition, passed the 40 year recertification, including new roof, concrete restoration, balconies, both elevators updated & New Hallways , etc. Plus has parking for 2 vehicles & east of US-1, only 5 minutes from the beach. Unit has had a lot of work done to it, porcelain tiles, both baths had work done on them and kitchen had work done on it. Very LARGE living room plus large kitchen, shutters on all windows. The building has a nice lobby, pool and tennis court. Basic cable and internet is included in the maintenance. Apartment can be rented right away
Key facts
- East of us-1
- Concrete restoration
- New hallways
Tags
Neighborhood map
What this means for you Summary
Snapshot
- This is a 2-bed/2.0-bath condo listed at $259k.
Deal economics
- At list price, monthly cash flow is $174 ($2k/yr) — positive.
- The deal already cash-flows at list — no discount required.
- Meets the 1% rule at list price ($4k rent vs $259k).
- Recommended offer: $255k (1.5% below list) — sets the bar for market timing.
- Cap rate 9.1% vs local median 5.2% in Hallandale Beach — top-decile yield for the area; either an underpriced asset or a hidden risk that comps aren't pricing in. Stress-test before assuming the spread holds.
Location & tenants
- Location reads 81/100 on livability (#86 in FL, #1,400 nationally) — a professional / high-income tenant draw. Strengths: commute A+, health & safety A+, crime B+; Watch: schools C-, employment D-.
- Broward (suburban): math 42% / reading 53% proficiency, ranked #46 of 73 in FL (top 63%) — families likely to look elsewhere, expect single-tenant / working-renter base with shorter leases.
- Market conditions: Rents flat; 1373 active listings in the ZIP; 40 comparable units currently listed for rent nearby; rentals at typical pace (median 22d on market — plan ~3-4 weeks tenant-placement turnaround); 2,111 units permitted in Broward County in 2024 (1,265 in 5+ unit buildings).
- At $3,962/mo this rent would consume 91% of the median local household income ($52k/yr) (locally 3293% of renters already pay >50% of income on rent) — very limited rent-growth headroom before tenants either downsize or default.
Forward outlook
- Local home prices are declining (-3.0%/yr); year-one equity from $2k of loan paydown is wiped out by about $8k of value loss. Plan a longer hold.
- Broward County population projected at +34% by 2050 — long-run rental-demand tailwind backs the buy-and-hold thesis.
Negotiation context
- It's been on market 30 days — a 2% lower offer ($255k) is reasonable based on typical stale-listing flexibility.
- 3 sale attempts; this cycle's ask is 12088% above the opening price — seller raised mid-cycle; expect resistance to lowballs.
Risks & watch-outs
- Watch-outs: flood insurance adds $427/mo.
- Climate carrying-cost: in FEMA flood zone AE (mandatory federal flood insurance); severe wind risk, 99% chance of damaging wind over 30y; extreme-heat days projected 7→26/yr by 2055 (HVAC capex compounding) — expect insurance premiums to compound above CPI over the hold.
Questions for the listing agent
- What's the actual annual flood-insurance premium (NFIP or private), and is the property in a SFHA with mandatory coverage?
- What does the HOA fee cover, when was the last increase, and are there any pending special assessments or reserve-fund shortfalls?
- Any open or pending special assessments — roof, HVAC, plumbing, elevator, façade? What's the per-unit balance and payoff schedule, and is the seller paying it off at close or rolling it to the buyer?
- Is there a deadline driving the sale (1031 exchange, divorce, estate, relocation)? That informs how much negotiation room exists.
- What's the average days-on-market for RENTAL listings here right now (not sales)? A rising rental-DOM trend means longer vacancies and softer asking-rent achievability than the comps imply.
- What's the recent tenant-quality profile in this submarket — average credit score on applications, eviction rate, late-payment / NSF rate, and stable-employment percentage? A property-management company in the area should have these aggregated.
- How much new apartment / multifamily construction is in the pipeline within 1–3 miles? Heavy new supply (>2% of stock underway) typically softens rents 12–24 months out; light construction supports rent growth.
Investment metrics
- 1% rule
- 1.53% ✓
- Cap rate
- 9.07%
- Cash-on-cash
- 9.93%
- DSCR
- 1.44
- GRM
- 5.4
CMA / ARV
No comps found within radius.
Projected returns pro-forma
-3.0% appreciation · 0.43% rent growth · sell at horizon
- IRR
- -16.2%
- Equity multiple
- 0.45×
- Total profit
- $-40,131
- Equity at exit
- $38,618
- IRR
- -17.4%
- Equity multiple
- 0.22×
- Total profit
- $-56,495
- Equity at exit
- $22,394
Cash invested: $72,520 (down + closing). Projections, not guarantees.
Landlord ↔ Tenant lean methodology
- Overall (STATE)
- 87 Strongly Landlord-Friendly
- State Florida
- 87 Strongly Landlord-Friendly · R+3
- County
- — inherits STATE
- City
- — inherits STATE
ZIP-level market 33009
- Rents YoY
- 0.4%
- Active inventory
- 1373
- Price-to-rent
- 5.4×
Monthly cashflow live
- Estimated rent
- $3,962 high interval (Pro) →
- Mortgage (P&I)
- −$1,358
- Tax from tax record
- −$446 /mo · $5,352/yr
- Insurance
- −$108
- Flood insurance flood zone
- −$427 /mo · $5,118/yr
- HOA
- −$618
- Vacancy / Maint / Mgmt
- −$832
- Net cashflow
- $174
Break-even live
UW: 25.0% down · 7.5% · 30yr · 1.5% tax · 5.0% vac · 8.0% maint · 8.0% mgmt
Financing live
Cash to close
- Down payment
- $64,750
- Closing costs
- $7,770
- Reserves months
- —
- Total cash needed
- —
Loan-product check · same deal, 3 products live
Conventional
25% down · 7.5% · 30yr
- Down + closing
- —
- Monthly P&I
- —
- Monthly cashflow
- —
- DSCR
- —
- Eligible?
- —
Personal DTI + credit; lowest rate.
DSCR
20% down · 8.5% · 30yr
- Down + closing
- —
- Monthly P&I
- —
- Monthly cashflow
- —
- DSCR
- —
- Eligible?
- —
No personal income docs; deal must DSCR.
Hard money
10% down · 12.0% · 12mo
- Down + closing
- —
- Monthly P&I
- —
- Monthly cashflow
- —
- DSCR
- —
- Eligible?
- —
Short-term bridge; refi at stabilization.
Rent comps 40 comps
| Address | Beds | Baths | Sqft | Rent | $/sqft | DOM | Units | Dist |
|---|---|---|---|---|---|---|---|---|
| 1124 NE 7th St Hallandale Beach, FL | 3.0 | 2.0 | 1320 | $3,900 | $2.95 | 21d | 1 | 0.08mi |
| 1001 NE 10th St Unit 2 Hallandale Beach, FL | 3.0 | 2.0 | 1270 | $3,600 | $2.83 | 24d | 1 | 0.22mi |
| 906 NE 6th St Hallandale Beach, FL | 3.0 | 2.0 | 1080 | $4,250 | $3.94 | 11d | 1 | 0.24mi |
| 906 NE 6th St Hallandale Beach, FL | 3.0 | 2.0 | 1080 | $4,250 | $3.94 | 24d | 1 | 0.24mi |
| 906 NE 6th St Hallandale Beach, FL | 3.0 | 2.0 | 1080 | $4,250 | $3.94 | 5d | 1 | 0.24mi |
| 1528 Wiley St Hollywood, FL | 2.0 | 1.0 | 1488 | $4,100 | $2.76 | 24d | 1 | 0.39mi |
| 1745 E Hallandale Beach Blvd Ph 05W Hallandale Beach, FL | 3.0 | 3.0 | 1715 | $5,000 | $2.92 | 2d | 1 | 0.51mi |
| 401 N Federal Hwy Hallandale Beach, FL | 1.0–3.0 | 1.0–2.0 | 973 | $2,765 | $2.84 | 15d | 48 | 0.54mi |
| 1755 E Hallandale Beach Blvd Unit 2207E Hallandale Beach, FL | 2.0 | 2.0 | 1354 | $3,950 | $2.92 | 24d | 1 | 0.54mi |
| 1755 E Hallandale Beach Blvd Unit 1407E Hallandale Beach, FL | 2.0 | 2.0 | 1354 | $3,650 | $2.70 | 24d | 1 | 0.54mi |
| 1529 Shoreline Way Hollywood, FL | 3.0 | 2.5 | 1784 | $7,500 | $4.20 | 7d | 1 | 0.56mi |
| 1529 Shoreline Way #1529 Hollywood, FL | 3.0 | 2.0 | 1784 | $7,500 | $4.20 | 1d | 1 | 0.56mi |
| 1529 Shoreline Way #1529 Hollywood, FL | 3.0 | 2.5 | 1784 | $7,750 | $4.34 | 11d | 1 | 0.56mi |
| 1745 E Hallandale Beach Blvd Unit 2302W Hallandale Beach, FL | 3.0 | 2.0 | 1481 | $3,900 | $2.63 | 24d | 1 | 0.57mi |
| 1745 E Hallandale Beach Blvd Unit 2302W Hallandale Beach, FL | 3.0 | 2.0 | 1481 | $3,900 | $2.63 | 14d | 1 | 0.57mi |
| 1745 E Hallandale Beach Blvd Unit 802W Hallandale Beach, FL | 3.0 | 2.0 | 1481 | $3,600 | $2.43 | 24d | 1 | 0.57mi |
| 110 N Federal Hwy #1401 Hallandale Beach, FL | 2.0 | 2.0 | 1220 | $3,999 | $3.28 | 7d | 1 | 0.62mi |
| 1180 E Hallandale Beach Blvd Unit 1241877P Hallandale Beach, FL | 1.0–2.0 | 1.0–2.0 | 844 | $5,453 | $6.46 | 3d | 2 | 0.67mi |
| 2500 Parkview Dr #2518 Hallandale Beach, FL | 2.0 | 2.0 | 1280 | $4,000 | $3.12 | 13d | 1 | 0.70mi |
| 2500 Parkview Dr #1112 Hallandale Beach, FL | 2.0 | 2.0 | 1580 | $3,800 | $2.41 | 24d | 1 | 0.70mi |
| 2500 Parkview Dr #2518 Hallandale Beach, FL | 2.0 | 2.0 | 1280 | $4,000 | $3.12 | 7d | 1 | 0.70mi |
| 200 E Pembroke Rd Hallandale Beach, FL | 3.0 | 1.0–2.0 | 1006 | $3,480 | $3.46 | 1d | 62 | 0.70mi |
| 825 NE 26th Ave Hallandale Beach, FL | 3.0 | 2.0 | 1844 | $4,200 | $2.28 | 24d | 1 | 0.79mi |
| 1239 Washington St Unit 1239 Hollywood, FL | 3.0 | 2.0 | 1721 | $5,600 | $3.25 | 20d | 1 | 0.79mi |
| 1403 Adams St Hollywood, FL | 3.0 | 2.0 | 1459 | $4,500 | $3.08 | 24d | 1 | 0.79mi |
| 1403 Adams St Unit 1403 Hollywood, FL | 3.0 | 2.0 | 1459 | $4,200 | $2.88 | 24d | 1 | 0.79mi |
| 2753 S Parkview Dr Hallandale Beach, FL | 2.0 | 2.0 | 1680 | $3,699 | $2.20 | 17d | 1 | 0.82mi |
| 513 Leslie Dr #513 Hallandale Beach, FL | 3.0 | 2.0 | 1624 | $5,250 | $3.23 | 24d | 1 | 0.84mi |
| 523 Leslie Dr Hallandale Beach, FL | 3.0 | 2.0 | 1624 | $4,950 | $3.05 | 24d | 1 | 0.85mi |
| 1715 Jefferson St Hollywood, FL | 3.0 | 2.0 | 1479 | $4,200 | $2.84 | 21d | 1 | 0.91mi |
| 1229 Jefferson St Hollywood, FL | 3.0 | 2.0 | 1861 | $5,400 | $2.90 | 24d | 1 | 0.91mi |
| 1041 Washington St Hollywood, FL | 3.0 | 2.0 | 1699 | $4,000 | $2.35 | 24d | 1 | 0.93mi |
| 1313 Madison St Hollywood, FL | 2.0 | 2.0 | 1740 | $4,900 | $2.82 | 24d | 1 | 0.94mi |
| 2601 E Hallandale Beach Blvd Unit 1227344P Hallandale Beach, FL | 1.0–2.0 | 1.0–2.0 | 844 | $4,219 | $5.00 | 1d | 2 | 0.98mi |
| 706 S 19th Ave Unit 706 Hollywood, FL | 3.0 | 2.0 | 1727 | $4,350 | $2.52 | 17d | 1 | 0.98mi |
| 706 S 19th Ave Hollywood, FL | 3.0 | 2.0 | 1727 | $3,950 | $2.29 | 7d | 1 | 0.98mi |
| 2602 E Hallandale Beach Blvd Hallandale Beach, FL | 3.0 | 1.0–3.0 | 1011 | $5,495 | $5.44 | 1d | 5 | 0.99mi |
| 2602 E Hallandale Beach Blvd Hallandale Beach, FL | 1.0–2.0 | 1.0–2.0 | 1070 | $5,950 | $5.56 | 20d | 4 | 0.99mi |
| 2602 E Hallandale Beach Blvd Hallandale Beach, FL | 1.0–2.0 | 1.0–2.0 | 1092 | $5,950 | $5.45 | 24d | 3 | 0.99mi |
| 2600 E Hallandale Beach Blvd Unit T3110 Hallandale Beach, FL | 2.0 | 2.0 | 1028 | $3,650 | $3.55 | 24d | 1 | 0.99mi |
HOA detail condo
- Monthly dues
- $618 · $7,416/yr
- Likely covers
- internetcablepool
- Assessments
- None detected in remarks — confirm with the listing agent.
Listing history 9 events
-
2026-05-06soldstatus $245,000
-
2026-04-23$2,125
-
2026-04-09status Pending
-
2026-03-24historical $2,125
-
2026-03-10$259,000 Active
-
2026-03-08$2,125
-
2000-10-16soldstatus $80,000
-
1994-07-26soldstatus $68,000
-
1989-10-23soldstatus $60,000
ⓘ Source: listings_history table (triggers on properties + properties_extension) + one-shot
backfill from property_details.listing_events for pre-trigger history.
Tax reassessment forecast FL · Resets to sale price
- Current annual tax
- $5,352 · $446/mo
- Projected year-2 tax
- $5,352 · $446/mo
- Expected delta
- $0/yr ($0/mo · 0.0%)
ⓘ Screening estimate from a state-policy table — verify with the county assessor before closing.
Climate risk First Street
- Flood 7/10 Severe FEMA zone AE · 76% chance over 30 yrs
- Wildfire 1/10 Low
- Heat 10/10 Extreme 7 d/yr ≥104°F today · 26 d/yr by 30 yrs out
- Wind 10/10 Extreme 99% chance of damaging wind over 30 yrs
- Air quality 2/10 Low 1 unhealthy d/yr today · 2 by 30 yrs out
Nearby sold comps map
Loading sold comps map…
Walkable amenities ~0.75 mi
Loading nearby amenities…
Taxation est. · year 1
- Rental income
- $47,548
- − Mortgage interest
- −$14,508
- − Property taxes
- −$5,352
- − Insurance
- −$6,414
- − Repairs & maintenance
- −$3,804
- − Management
- −$3,804
- − HOA
- −$7,416
- − Depreciation
- −$7,535
- Taxable loss
- −$1,284
- Est. tax savings @ 24.0%
- +$308
- After-tax cash flow
- $2,390/yr
For passive investors: Depreciation is non-cash, so a rental often shows a tax loss while cash-flowing — sheltering income. Rental losses are passive: they offset passive income freely, and up to $25,000/yr can offset ordinary (W-2) income if you actively participate and your MAGI is under $100k (phasing out to $0 by $150k); unused losses carry forward. On sale, claimed depreciation is recaptured at up to 25%, and gains may owe capital-gains tax (a 1031 exchange can defer both). Figures are a year-1 estimate at your 24.0% rate — not tax advice; consult a CPA.
Schools (NCES district)
- District
- Broward
- NCES district ID
- 1200180
- Math proficiency
- 42% ▼ -18.00%
- Reading proficiency
- 53% ▼ -5.00%
- Median HH income
- $52,139
- Composite
- 40.88/100
- National rank
- #3621
- State rank
- #46 of 73 in FL
Livability — Hallandale Beach
- Score
- 81/100
- State rank
- #86
- US rank
- #1400
Category grades
Schools grade is shown separately in the Schools card above.
Census & demographics
- Census place
- Hallandale Beach, FL
- County
- Broward County · 1,963,430 people
- City population
- 44,021
- Metro
- Miami-Fort Lauderdale-Pompano Beach, FL
- Population (ZIP)
- 44,502
- Household income
- $52,079
- Rent vs Own
- Severe rent burden
- 3293.0
Population outlook (Broward County) Hauer SSP2
- Today (2025)
- 2,207,033 people
- By 2030
- 2,360,704 · +7.0%
- By 2040
- 2,661,208 · +20.6%
- By 2050
- 2,946,698 · +33.5%
- By 2075
- 3,602,273 · +63.2%
- By 2100
- 3,970,984 · +79.9%
Race, ethnicity, and origin ACS 2023
- Neighborhood character
- Diverse neighborhood (Simpson 0.67)
- Race & ethnicity
- Hispanic / Latino 39% White 39% Two or more races 24% Black 17% Asian 1%
- Hispanic origin (detail)
- Mexican 2% Puerto Rican 3% Cuban 9% Dominican 3% Salvadoran 2%
- Common ancestry
- Scotch-Irish 5% Hispanic 5% Subsaharan African 3%
- Foreign-born
- 51% · Canada, Jamaica, Dominican Republic
- Languages at home
- 38% English-only · Spanish 36% Russian/Polish/Slavic 12% French/Haitian/Cajun 7%
Political lean MEDSL · Broward
- 2024 margin
- D (+17.0) · D 58.0% · R 41.0%
- 2008→2024 swing
- -17.8pp toward R · 2008: 34.7pp · 2024: 17.0pp
- All cycles
- 2024: D+17.0 2020: D+29.8 2016: D+35.0 2012: D+34.9 2008: D+34.7
Not yet ingested
- Civics
- —
Market trends
- HPI YoY
- ▼ -299.13%
- Current HPI
- 329.9081
- Rent YoY
- ▲ 0.43%
- Metro
- Miami-Fort Lauderdale-Pompano Beach, FL
- State GDP YoY
- ▲ 3.28%
- F500 in state
- 36
Industry mix (Fortune 500 HQ in FL)
| Industry | F500 HQs | Revenue |
|---|---|---|
| Industrial Technology | 2 | $29B |
|
||
| Insurance | 2 | $17B |
|
||
| Retail | 1 | $60B |
|
||
| Technology Distribution | 1 | $58B |
|
||
| Homebuilding | 1 | $35B |
|
||
| Technology Manufacturing | 1 | $35B |
|
||
Price history
+308.3% since first listed9 events — show timeline
- 2026-05-06 Sold (Public Records) $245,000 Public Records
- 2026-04-23 Listed for Rent $2,125 MARMLS
- 2026-04-09 Pending — MARMLS
- 2026-03-24 Rental Removed $2,125 MARMLS
- 2026-03-10 Listed $259,000 MARMLS
- 2026-03-08 Listed for Rent $2,125 MARMLS
- 2000-10-16 Sold (Public Records) $80,000 Public Records
- 1994-07-26 Sold (Public Records) $68,000 Public Records
- 1989-10-23 Sold (Public Records) $60,000 Public Records
Property tax history
+10.1%/yrLatest (2025): $5,352 · +10.6% YoY. Source: county tax records.
Cash-flow waterfall
monthlySold comps — $/sqft
last 12 mo · ≤1 miLoading sold comps…