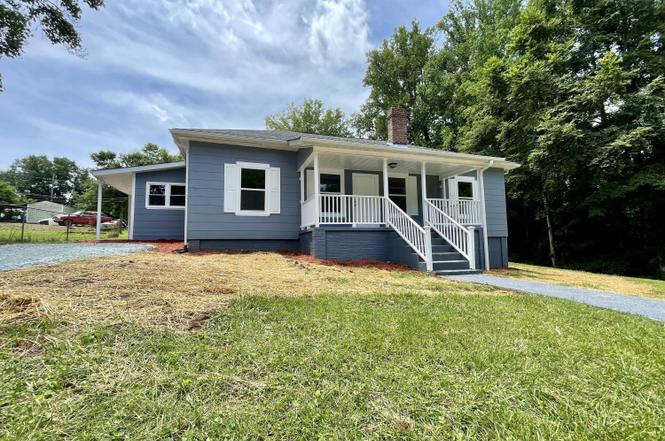
213 Hicks Cir · Roxboro, NC
Flood risk 1/10 · Minimal
- FEMA flood zone
- X (unshaded)
- Chance of flooding over 30 yrs
- 0.0%
- Est. flood insurance / yr
- $473 – $860
Fire risk 4/10 · Minor
- Est. fire insurance / yr
- $906 – $1,684
Heat risk 6/10 · Moderate
- Hot days now (above 103°F)
- 7 days/yr
- Hot days in 30 yrs
- 18 days/yr
Wind risk 5/10 · Moderate
- Chance of severe wind over 30 yrs
- 23.0%
Air-quality risk 2/10 · Minimal
- Unhealthy air days now
- 1 days/yr
- Unhealthy air days in 30 yrs
- 2 days/yr
Risk factors via First Street. Map © Google.
Why this score? — see what drove the D grade
The composite is a weighted blend of 9 inputs, each scored 0–100. Each bar is that input's sub-score; the figure is the points it added to the 100-point composite (weight × sub-score).
- Cash flow +11.1/30.0
- Appreciation +8.5/10.0
- ARV discount +7.3/15.0
- Schools +3.4/10.0
- DSCR +3.2/10.0
- Livability +2.8/5.0
- Rent growth +2.5/5.0
- Condition / age +2.5/5.0
- 1% rule +2.3/10.0
$217,000
🖨 Deal sheet (PDF) 📄 Offer letter ✓ Due diligence
Listing remarks
Complete Renovation! Ranch home on Corner Lot. New LVP floors, new HVAC, New Plumbing and Electric! New Updated Kitchen with Granite Countertops and Stainless Steel Appliances. Completely New Bathrooms! Big Covered Front and Side Porches! Close proximity to Downtown Roxboro. Many more updated features! A must see!
Key facts
- New updated kitchen
- Granite countertops
- 6,970 sq ft lot
Tags
Property features AI
Finance
- Other: Lot approximately 0.16 acre; Publicly maintained asphalt road access; Directions: From N Madison Blvd take a left onto Boston Road, Right on Hicks.
- HOA & community: No association
Exterior
- Parking: Direct access driveway; Gravel parking
- Utilities: Public water; Public sewer; Electricity available and connected; Water available and connected; Sewer available and connected
- Home design: One-story house; Main-level entry; Site-built construction
- Construction: Fiber cement exterior; Shingle roof; Updated/remodeled
- Exterior features: Covered front and side porches; Porch; Garden; Storage shed(s)
Interior
- Kitchen: Dishwasher; Electric range; Microwave
- Bedrooms: 3 bedrooms (all on the main level)
- Flooring: Luxury vinyl; Updated/remodeled condition
- Bathrooms: 2 full bathrooms
- Heating & cooling: Central heating; Electric heat pump; Central air conditioning
- Interior features: Eat-in kitchen; Granite counters
- Laundry & utility: Main-level laundry in a hall laundry closet (inside)
Neighborhood map
What this means for you Summary
Snapshot
- This is a 2-bed/1.0-bath single-family listed at $217k.
Deal economics
- At list price, monthly cash flow is $-87 ($-1k/yr) — negative.
- To cash-flow at today's rent, offer at most $202k (7.1% below list).
- To meet the 1% rule (rent ≥ 1% of price), the offer needs to be $158k (27.0% below list).
- Recommended offer: $158k (27.0% below list) — sets the bar for 1% rule.
- Cap rate 5.8% vs local median 4.5% in Roxboro — top-decile yield for the area; either an underpriced asset or a hidden risk that comps aren't pricing in. Stress-test before assuming the spread holds.
Location & tenants
- Location reads 55/100 on livability (#649 in NC) — a working-class tenant base; expect higher turnover. Strengths: cost of living A+; Watch: crime F, amenities F, commute F.
- Person County Schools (rural): math 39% / reading 42% proficiency, ranked #110 of 178 in NC (top 62%) — families likely to look elsewhere, expect single-tenant / working-renter base with shorter leases.
- Zoned schools: Person High (math 45% / reading 44%, grade F, #352 of 535 statewide, top 68%, 1,079 students, 60% FRL).
- Market conditions: 100 active listings in the ZIP; 113 units permitted in Person County in 2024 (0 in 5+ unit buildings).
Forward outlook
- In year one you build about $17k of equity ($2k loan paydown + $15k appreciation (7.0% local appreciation)).
- Person County population projected at -15% by 2050 — secular population decline; favor cash flow + early exit over multi-decade hold.
- By year 3, paydown + projected appreciation supports a ~$42k cash-out refi (75% LTV) — recoverable capital for the next deal without selling this one.
Negotiation context
- It's been on market 171 days — a 12% lower offer ($191k) is reasonable based on typical stale-listing flexibility.
- Current owner paid $103k; list at $217k implies a 111% gain — meaningful room to come down on a strong offer.
Risks & watch-outs
- Watch-outs: built in 1930 — expect roof / HVAC / electrical / plumbing capex.
- Climate carrying-cost: moderate wind risk, 23% chance of damaging wind over 30y; extreme-heat days projected 7→18/yr by 2055 (HVAC capex compounding) — expect insurance premiums to compound above CPI over the hold.
Questions for the listing agent
- What do current leases actually rent for vs. the listed asking? Can we see a recent rent roll and the last 12 months of T-12 income?
- It's been on market 171 days. Have you received any prior offers? Is the seller open to a 27% concession, seller financing, or rate buy-down credit?
- Built in 1930 — when were the roof, HVAC, electrical panel, plumbing, and water heater last replaced?
- Why hasn't it sold? Are there any deal-killer items the seller is aware of (foundation, flood, title, zoning, code violations)?
- Is there a deadline driving the sale (1031 exchange, divorce, estate, relocation)? That informs how much negotiation room exists.
- Schools are D-rated, which usually means shorter tenancies and higher turnover. Who's the typical renter profile here, and what's been the actual vacancy rate?
- Crime grade is F in this area — have there been break-ins, vandalism, or insurance claims at this property in the last 3 years? What carrier currently insures it and at what premium?
- The area grade is low — what's the realistic commute time and amenity access for the typical tenant pool here? Any planned neighborhood developments (good or bad) we should know about?
- What's the average days-on-market for RENTAL listings here right now (not sales)? A rising rental-DOM trend means longer vacancies and softer asking-rent achievability than the comps imply.
- What's the recent tenant-quality profile in this submarket — average credit score on applications, eviction rate, late-payment / NSF rate, and stable-employment percentage? A property-management company in the area should have these aggregated.
- How much new for-sale + rental construction is in the pipeline within 1–3 miles? Heavy new supply typically softens prices + rents 12–24 months out; constrained supply supports both.
Investment metrics
- 1% rule
- 0.73% ✗
- Cap rate
- 5.81%
- Cash-on-cash
- -1.71%
- DSCR
- 0.92
- GRM
- 11.4
CMA / ARV
- ARV (on-the-fly)
- $216,132
- Comps found
- 12
Show comp detail 12 sales within ~0.75 mi
| Address | Dist | Beds/Ba | Sqft | Sold | Price | $/sf | Match |
|---|---|---|---|---|---|---|---|
| 1701 Sunset St | 0.26mi | 3/2.0 (+1) | 1,152 (-1%) | 11mo | $60,000 | $52 | 68 |
| 123 Landon Pl | 0.36mi | 3/2.0 (+1) | 1,202 (+3%) | 8mo | $226,990 | $189 | 62 |
| 86 Maggie Ln | 0.31mi | 3/2.0 (+1) | 1,265 (+9%) | 3mo | $219,000 | $173 | 60 |
| 252 Maggie Ln | 0.30mi | 3/2.0 (+1) | 1,202 (+3%) | 14mo | $225,990 | $188 | 60 |
| 132 Lillian Ct | 0.44mi | 3/2.0 (+1) | 1,202 (+3%) | 6mo | $224,488 | $187 | 59 |
| 1716 Turner St | 0.16mi | 2/1.0 | 1,000 (-14%) | 12mo | $126,000 | $126 | 59 |
| 49 Eli Ct | 0.36mi | 3/2.0 (+1) | 1,185 (+2%) | 15mo | $249,900 | $211 | 58 |
| 224 Landon Pl | 0.47mi | 3/2.0 (+1) | 1,202 (+3%) | 7mo | $219,997 | $183 | 57 |
| 121 Clayton St | 0.37mi | 3/2.0 (+1) | 1,206 (+4%) | 18mo | $228,000 | $189 | 53 |
| 348 Maggie Ln | 0.40mi | 3/2.0 (+1) | 1,202 (+3%) | 18mo | $223,100 | $186 | 52 |
| 142 Yarborough St | 0.52mi | 3/1.0 (+1) | 1,280 (+10%) | 3mo | $59,900 | $47 | 51 |
| 1420 Pointer St | 0.66mi | 2/1.0 | 1,132 (-3%) | 17mo | $150,000 | $133 | 50 |
Match score weights: distance 35% · size 25% · config 20% · recency 20%. Top-matched comps best support the ARV.
Projected returns pro-forma
7.01% appreciation · 3.0% rent growth · sell at horizon
- IRR
- 16.4%
- Equity multiple
- 2.16×
- Total profit
- $70,272
- Equity at exit
- $150,471
- IRR
- 16.0%
- Equity multiple
- 4.43×
- Total profit
- $208,221
- Equity at exit
- $285,912
Cash invested: $60,760 (down + closing). Projections, not guarantees.
Landlord ↔ Tenant lean methodology
- Overall (STATE)
- 85 Strongly Landlord-Friendly
- State North Carolina
- 85 Strongly Landlord-Friendly · R+3
- County
- — inherits STATE
- City
- — inherits STATE
ZIP-level market 27573
- Home prices YoY
- 2.5%
- Active inventory
- 100
- Price-to-rent
- 11.4×
Monthly cashflow live
- Estimated rent
- $1,584 medium interval (Pro) →
- Mortgage (P&I)
- −$1,138
- Tax from tax record
- −$110 /mo · $1,316/yr
- Insurance
- −$90
- HOA
- −$0
- Vacancy / Maint / Mgmt
- −$333
- Net cashflow
- $-87
Break-even live
Sensitivity live
| Price | -10% $36 | -5% $-25 | +0% $-87 | +5% $-148 | +10% $-209 |
|---|---|---|---|---|---|
| Rent | -10% $-212 | -5% $-149 | +0% $-87 | +5% $-24 | +10% $39 |
| Rate | -1.0pp $23 | -0.5pp $-31 | base $-87 | +0.5pp $-143 | +1.0pp $-200 |
UW: 25.0% down · 7.5% · 30yr · 1.5% tax · 5.0% vac · 8.0% maint · 8.0% mgmt
Financing live
Cash to close
- Down payment
- $54,250
- Closing costs
- $6,510
- Reserves months
- —
- Total cash needed
- —
Loan-product check · same deal, 3 products live
Conventional
25% down · 7.5% · 30yr
- Down + closing
- —
- Monthly P&I
- —
- Monthly cashflow
- —
- DSCR
- —
- Eligible?
- —
Personal DTI + credit; lowest rate.
DSCR
20% down · 8.5% · 30yr
- Down + closing
- —
- Monthly P&I
- —
- Monthly cashflow
- —
- DSCR
- —
- Eligible?
- —
No personal income docs; deal must DSCR.
Hard money
10% down · 12.0% · 12mo
- Down + closing
- —
- Monthly P&I
- —
- Monthly cashflow
- —
- DSCR
- —
- Eligible?
- —
Short-term bridge; refi at stabilization.
Listing history 26 events
-
2026-06-22days on market $217,000 Active 171 DOM
-
2026-06-21days on market $217,000 Active 170 DOM
-
2026-06-21days on market $217,000 Active 169 DOM
-
2026-06-18days on market $217,000 Active 167 DOM
-
2026-06-18price $217,000 Active 166 DOM
-
2026-06-17days on market $224,999 Active 166 DOM
-
2026-06-16days on market $224,999 Active 165 DOM
-
2026-06-15days on market $224,999 Active 164 DOM
-
2026-06-13days on market $224,999 Active 162 DOM
-
2026-06-12days on market $224,999 Active 161 DOM
-
2026-06-09days on market $224,999 Active 158 DOM
-
2026-06-08days on market $224,999 Active 157 DOM
-
2026-06-07days on market $224,999 Active 156 DOM
-
2026-06-05days on market $224,999 Active 154 DOM
-
2026-06-04days on market $224,999 Active 152 DOM
-
2026-06-02days on market $224,999 Active 151 DOM
-
2026-06-01days on market $224,999 Active 150 DOM
-
2026-05-31days on market $224,999 Active 149 DOM
-
2026-05-03price $224,999
-
2026-04-17price $225,000
-
2026-03-06price $229,000
-
2026-02-25price $239,000
-
2026-02-21price $249,000
-
2026-01-03$250,000 Active
-
2025-02-21soldstatus $103,000
-
1989-06-29soldstatus $26,000
ⓘ Source: listings_history table (triggers on properties + properties_extension) + one-shot
backfill from property_details.listing_events for pre-trigger history.
Tax reassessment forecast NC · Resets to sale price
- Current annual tax
- $1,316 · $110/mo
- Projected year-2 tax
- $1,779 · $148/mo
- Expected delta
- +$464/yr (+$39/mo · 35.2%)
ⓘ Screening estimate from a state-policy table — verify with the county assessor before closing.
Climate risk First Street
- Flood 1/10 Low FEMA zone X (unshaded) · 0% chance over 30 yrs
- Wildfire 4/10 Moderate
- Heat 6/10 Major 7 d/yr ≥103°F today · 18 d/yr by 30 yrs out
- Wind 5/10 Major 23% chance of damaging wind over 30 yrs
- Air quality 2/10 Low 1 unhealthy d/yr today · 2 by 30 yrs out
Nearby sold comps map
Loading sold comps map…
Walkable amenities ~0.75 mi
Loading nearby amenities…
Taxation est. · year 1
- Rental income
- $19,009
- − Mortgage interest
- −$12,155
- − Property taxes
- −$1,316
- − Insurance
- −$1,085
- − Repairs & maintenance
- −$1,521
- − Management
- −$1,521
- − Depreciation
- −$6,313
- Taxable loss
- −$4,901
- Est. tax savings @ 24.0%
- +$1,176
- After-tax cash flow
- $137/yr
For passive investors: Depreciation is non-cash, so a rental often shows a tax loss while cash-flowing — sheltering income. Rental losses are passive: they offset passive income freely, and up to $25,000/yr can offset ordinary (W-2) income if you actively participate and your MAGI is under $100k (phasing out to $0 by $150k); unused losses carry forward. On sale, claimed depreciation is recaptured at up to 25%, and gains may owe capital-gains tax (a 1031 exchange can defer both). Figures are a year-1 estimate at your 24.0% rate — not tax advice; consult a CPA.
Schools (NCES district)
- District
- Person County Schools
- NCES district ID
- 3703630
- Math proficiency
- 39% ▬ 0.00%
- Reading proficiency
- 42% ▲ 2.00%
- Median HH income
- $43,729
- Composite
- 34.3/100
- National rank
- #5242
- State rank
- #110 of 178 in NC
Livability — Roxboro
- Score
- 55/100
- State rank
- #649
- US rank
- #23536
Category grades
Schools grade is shown separately in the Schools card above.
Census & demographics
- Census place
- Roxboro, NC
- City population
- 11,954
- Population (ZIP)
- 11,954
Population outlook (Person County) Hauer SSP2
- Today (2025)
- 38,577 people
- By 2030
- 37,847 · -1.9%
- By 2040
- 35,740 · -7.4%
- By 2050
- 32,683 · -15.3%
- By 2075
- 24,979 · -35.2%
- By 2100
- 15,779 · -59.1%
Race, ethnicity, and origin ACS 2023
- Neighborhood character
- Diverse neighborhood (Simpson 0.65)
- Race & ethnicity
- White 45% Black 36% Hispanic / Latino 11% Two or more races 11% Native American 2%
- Hispanic origin (detail)
- Mexican 9%
- Common ancestry
- Slovak 3% Romanian 2% Italian 1%
- Foreign-born
- 5% · Canada
- Languages at home
- 90% English-only · Spanish 8% Other Asian/Pacific 1% Other Indo-European 1%
Political lean MEDSL · Person
- 2024 margin
- Strong R (+23.7) · D 37.7% · R 61.4%
- 2008→2024 swing
- -15.2pp toward R · 2008: -8.5pp · 2024: -23.7pp
- All cycles
- 2024: R+23.7 2020: R+21.6 2016: R+17.3 2012: R+11.0 2008: R+8.5
Not yet ingested
- Civics
- —
Market trends
- HPI YoY
- ▲ 7.01%
- Current HPI
- 286.1496
- Rent YoY
- —
- Metro
- —
- State GDP YoY
- ▲ 3.28%
- F500 in state
- 26
Industry mix (Fortune 500 HQ in NC)
| Industry | F500 HQs | Revenue |
|---|---|---|
| Financial Services | 2 | $213B |
|
||
| Retail | 2 | $95B |
|
||
| Industrial Conglomerate | 1 | $38B |
|
||
| Metals / Steel | 1 | $35B |
|
||
| Utilities | 1 | $30B |
|
||
| Industrial Machinery | 1 | $19B |
|
||
Price history
+765.4% since first listed8 events — show timeline
- 2026-05-03 Price Changed $224,999 TMLS
- 2026-04-17 Price Changed $225,000 TMLS
- 2026-03-06 Price Changed $229,000 TMLS
- 2026-02-25 Price Changed $239,000 TMLS
- 2026-02-21 Price Changed $249,000 TMLS
- 2026-01-03 Listed $250,000 TMLS
- 2025-02-21 Sold (Public Records) $103,000 Public Records
- 1989-06-29 Sold (Public Records) $26,000 Public Records
Property tax history
+6.1%/yrLatest (2025): $1,316 · +76.2% YoY. Source: county tax records.
Cash-flow waterfall
monthlySold comps — $/sqft
last 12 mo · ≤1 miLoading sold comps…