1119 Marcella St · Houston, TX
Flood risk 3/10 · Minor
- FEMA flood zone
- X (unshaded)
- Chance of flooding over 30 yrs
- 0.1%
- Est. flood insurance / yr
- $507 – $1,088
Fire risk 1/10 · Minimal
- Est. fire insurance / yr
- $1,222 – $2,270
Heat risk 9/10 · Severe
- Hot days now (above 109°F)
- 7 days/yr
- Hot days in 30 yrs
- 24 days/yr
Wind risk 8/10 · Major
- Chance of severe wind over 30 yrs
- 99.0%
Air-quality risk 3/10 · Minor
- Unhealthy air days now
- 2 days/yr
- Unhealthy air days in 30 yrs
- 3 days/yr
Risk factors via First Street. Map © Google.
Why this score? — see what drove the B- grade
The composite is a weighted blend of 9 inputs, each scored 0–100. Each bar is that input's sub-score; the figure is the points it added to the 100-point composite (weight × sub-score).
- Cash flow +30.0/30.0
- 1% rule +10.0/10.0
- DSCR +10.0/10.0
- ARV discount +7.5/15.0
- Livability +3.7/5.0
- Rent growth +3.0/5.0
- Schools +2.7/10.0
- Condition / age +2.5/5.0
- Appreciation +0.0/10.0
$119,900
🖨 Deal sheet (PDF) 📄 Offer letter ✓ Due diligence
Listing remarks
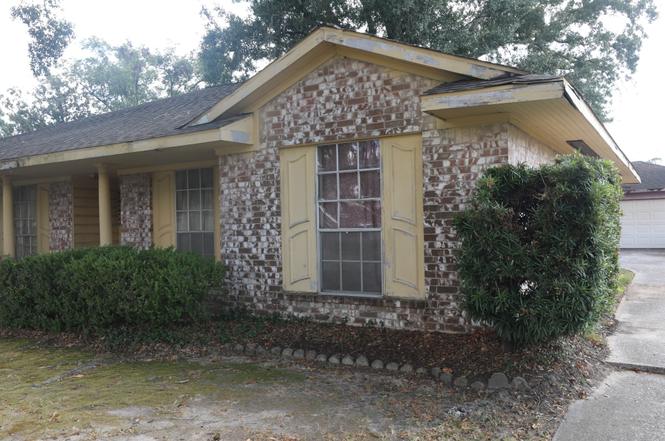
Property sold as-is in current condition. No repairs, warranties, disclosures or inspections provided by seller. Contract subject to lien holder(s) approval. Buyer proof of funds or prequal letter and addendum to contract is required. Submit all offers on One to Four Res. Resale Contract with added Addendum. Needs TLC. Not updated. Needs electrical/plumbing work, some roof issues. Carpet not usable. Appliances unknown.
Key facts
- 8,398 sq ft lot
- 2 garage spots
- Built 1969
Neighborhood map
What this means for you Summary
Snapshot
- This is a 3-bed/2.0-bath single-family listed at $120k.
Deal economics
- At list price, monthly cash flow is $1k ($12k/yr) — positive.
- The deal already cash-flows at list — no discount required.
- Meets the 1% rule at list price ($2k rent vs $120k).
- Recommended offer: $106k (12.0% below list) — sets the bar for market timing.
- Cap rate 16.4% vs local median 3.2% in Houston — top-decile yield for the area; either an underpriced asset or a hidden risk that comps aren't pricing in. Stress-test before assuming the spread holds.
Location & tenants
- Location reads 74/100 on livability (#184 in TX, #4,771 nationally) — a middle-class / working-renter tenant base. Strengths: amenities A+, cost of living A+, housing A+; Watch: crime F.
- Houston ISD (urban): math 27% / reading 35% proficiency, ranked #593 of 826 in TX (top 72%) — families likely to look elsewhere, expect single-tenant / working-renter base with shorter leases; 71% free/reduced lunch — lower-income household profile, screen leases tightly.
- Zoned schools: Highland Hts El (math 17% / reading 22%, grade F, #3,583 of 4,322 statewide, top 86%, 450 students, 98% FRL); Williams Middle (math 9% / reading 15%, grade F, #1,623 of 1,662 statewide, top 98%, 411 students, 98% FRL); Washington B T H S (math 27% / reading 25%, grade F, #1,234 of 1,632 statewide, top 76%, 878 students, 96% FRL) — zoned schools average 97% FRL vs 71% district-wide (26 pts higher); higher-poverty schools than district average — tighter screening recommended.
- Market conditions: Rents rising (+2.1%/yr); 680 active listings in the ZIP; 21 comparable units currently listed for rent nearby; rentals lingering (median 45d on market — plan ~5-8 weeks vacancy on turnover, expect pricing pressure); 52% of comp listings sitting > 30 days — soft ceiling on asking rent; lower-income renter base — watch delinquency; 29,883 units permitted in Harris County in 2024 (8,621 in 5+ unit buildings).
- At $2,331/mo this rent would consume 79% of the median local household income ($35k/yr) (locally 3210% of renters already pay >50% of income on rent) — very limited rent-growth headroom before tenants either downsize or default.
Forward outlook
- Local home prices are declining (-3.0%/yr); year-one equity from $829 of loan paydown is wiped out by about $4k of value loss. Plan a longer hold.
- Harris County population projected at +47% by 2050 — long-run rental-demand tailwind backs the buy-and-hold thesis.
- At projected returns (-3.0% appreciation + 2.1% rent growth), your $34k cash investment doubles in ~4 years — after that, you're playing with house money.
Negotiation context
- It's been on market 123 days — a 12% lower offer ($106k) is reasonable based on typical stale-listing flexibility.
Risks & watch-outs
- Climate carrying-cost: severe wind risk, 99% chance of damaging wind over 30y; extreme-heat days projected 7→24/yr by 2055 (HVAC capex compounding) — expect insurance premiums to compound above CPI over the hold.
Questions for the listing agent
- It's been on market 123 days. Have you received any prior offers? Is the seller open to a 12% concession, seller financing, or rate buy-down credit?
- Built in 1969 — when were the roof, HVAC, electrical panel, plumbing, and water heater last replaced?
- Why hasn't it sold? Are there any deal-killer items the seller is aware of (foundation, flood, title, zoning, code violations)?
- Is there a deadline driving the sale (1031 exchange, divorce, estate, relocation)? That informs how much negotiation room exists.
- Schools are D-rated, which usually means shorter tenancies and higher turnover. Who's the typical renter profile here, and what's been the actual vacancy rate?
- Crime grade is F in this area — have there been break-ins, vandalism, or insurance claims at this property in the last 3 years? What carrier currently insures it and at what premium?
- What's the average days-on-market for RENTAL listings here right now (not sales)? A rising rental-DOM trend means longer vacancies and softer asking-rent achievability than the comps imply.
- What's the recent tenant-quality profile in this submarket — average credit score on applications, eviction rate, late-payment / NSF rate, and stable-employment percentage? A property-management company in the area should have these aggregated.
- How much new for-sale + rental construction is in the pipeline within 1–3 miles? Heavy new supply typically softens prices + rents 12–24 months out; constrained supply supports both.
Investment metrics
- 1% rule
- 1.94% ✓
- Cap rate
- 16.43%
- Cash-on-cash
- 36.21%
- DSCR
- 2.61
- GRM
- 4.3
CMA / ARV
- ARV (on-the-fly)
- $430,148
- Comps found
- 12
Show comp detail 12 sales within ~0.75 mi
| Address | Dist | Beds/Ba | Sqft | Sold | Price | $/sf | Match |
|---|---|---|---|---|---|---|---|
| 5422 Golf Dr | 0.13mi | 3/2.0 | 2,310 (+14%) | 1mo | $445,000 | $193 | 70 |
| 5522 Wheatley St Unit F | 0.18mi | 4/3.5 (+1) | 2,161 (+6%) | 1mo | $449,900 | $208 | 69 |
| 5822 Highland Sun Ln | 0.47mi | 3/3.5 | 1,911 (-6%) | 1mo | $349,900 | $183 | 62 |
| 1410 Del Norte St | 0.74mi | 3/2.0 | 1,967 (-3%) | 1mo | $575,000 | $292 | 59 |
| 810 Glowing Dawn Dr | 0.73mi | 3/2.5 | 1,932 (-5%) | 1mo | $415,700 | $215 | 56 |
| 808 Glowing Dawn Dr | 0.73mi | 3/2.5 | 1,932 (-5%) | 2mo | $409,700 | $212 | 55 |
| 4914 Alba Rd | 0.61mi | 4/2.0 (+1) | 2,173 (+7%) | 2mo | $649,000 | $299 | 53 |
| 5929 Wheatley St | 0.57mi | 3/2.5 | 1,776 (-12%) | 1mo | $354,900 | $200 | 50 |
| 1202 Highland Row Ln | 0.62mi | 3/2.5 | 1,808 (-11%) | 1mo | $389,990 | $216 | 50 |
| 1102 Mansfield St Unit C | 0.52mi | 3/3.5 | 1,741 (-14%) | 0mo | $334,900 | $192 | 46 |
| 1034 Bethlehem St | 0.50mi | 4/3.0 (+1) | 2,285 (+13%) | 1mo | $799,000 | $350 | 46 |
| 6135 Pacific Forest Dr | 0.71mi | 3/2.5 | 1,731 (-15%) | 2mo | $330,000 | $191 | 39 |
Match score weights: distance 35% · size 25% · config 20% · recency 20%. Top-matched comps best support the ARV.
Projected returns pro-forma
-3.0% appreciation · 2.1% rent growth · sell at horizon
- IRR
- 30.9%
- Equity multiple
- 2.28×
- Total profit
- $43,039
- Equity at exit
- $17,877
- IRR
- 37.6%
- Equity multiple
- 4.34×
- Total profit
- $112,275
- Equity at exit
- $10,367
Cash invested: $33,572 (down + closing). Projections, not guarantees.
Landlord ↔ Tenant lean methodology
- Overall (STATE)
- 87 Strongly Landlord-Friendly
- State Texas
- 87 Strongly Landlord-Friendly · R+5
- County
- — inherits STATE
- City
- — inherits STATE
ZIP-level market 77091
- Home prices YoY
- -24.9%
- Rents YoY
- 2.1%
- Active inventory
- 680
- Price-to-rent
- 4.3×
Monthly cashflow live
- Estimated rent
- $2,331 high interval (Pro) →
- Mortgage (P&I)
- −$629
- Tax est. 1.5%
- −$150 /mo · $1,798/yr
- Insurance
- −$50
- HOA
- −$0
- Vacancy / Maint / Mgmt
- −$490
- Net cashflow
- $1,013
Break-even live
Sensitivity live
| Price | -10% $1,096 | -5% $1,055 | +0% $1,013 | +5% $972 | +10% $930 |
|---|---|---|---|---|---|
| Rent | -10% $829 | -5% $921 | +0% $1,013 | +5% $1,105 | +10% $1,197 |
| Rate | -1.0pp $1,073 | -0.5pp $1,044 | base $1,013 | +0.5pp $982 | +1.0pp $950 |
UW: 25.0% down · 7.5% · 30yr · 1.5% tax · 5.0% vac · 8.0% maint · 8.0% mgmt
Financing live
Cash to close
- Down payment
- $29,975
- Closing costs
- $3,597
- Reserves months
- —
- Total cash needed
- —
Loan-product check · same deal, 3 products live
Conventional
25% down · 7.5% · 30yr
- Down + closing
- —
- Monthly P&I
- —
- Monthly cashflow
- —
- DSCR
- —
- Eligible?
- —
Personal DTI + credit; lowest rate.
DSCR
20% down · 8.5% · 30yr
- Down + closing
- —
- Monthly P&I
- —
- Monthly cashflow
- —
- DSCR
- —
- Eligible?
- —
No personal income docs; deal must DSCR.
Hard money
10% down · 12.0% · 12mo
- Down + closing
- —
- Monthly P&I
- —
- Monthly cashflow
- —
- DSCR
- —
- Eligible?
- —
Short-term bridge; refi at stabilization.
Rent comps 21 comps
| Address | Beds | Baths | Sqft | Rent | $/sqft | DOM | Units | Dist |
|---|---|---|---|---|---|---|---|---|
| 5508 Oakmont Villas Dr Houston, TX | 3.0 | 2.0 | 2199 | $2,599 | $1.18 | 45d | 1 | 0.39mi |
| 5720 Beall St Unit C Houston, TX | 3.0 | 2.5 | 1474 | $2,006 | $1.36 | 45d | 1 | 0.60mi |
| 5722 # E Unit Beall St unit Houston, TX | 3.0 | 2.5 | 1474 | $2,011 | $1.36 | 45d | 1 | 0.61mi |
| 774 Paul Quinn St Houston, TX | 3.0 | 3.0 | 1651 | $2,350 | $1.42 | 45d | 1 | 0.69mi |
| 5121 Royal Heath Dr Houston, TX | 3.0 | 2.5 | 1435 | $2,215 | $1.54 | 0d | 1 | 0.70mi |
| 5115 Royal Heath Dr Houston, TX | 3.0 | 2.5 | 1600 | $2,175 | $1.36 | 25d | 1 | 0.70mi |
| 6127 W Montgomery Rd Houston, TX | 3.0 | 3.0 | 1786 | $2,000 | $1.12 | 25d | 1 | 0.80mi |
| 717 Lehman St Houston, TX | 1.0–3.0 | 1.0–3.0 | 1084 | $3,120 | $2.88 | 6d | 263 | 0.88mi |
| 910 1/2 Oak St Houston, TX | 3.0 | 2.0 | 1526 | $1,995 | $1.31 | 45d | 1 | 0.92mi |
| 6513 Knox St Houston, TX | 4.0 | 3.0 | 1773 | $2,100 | $1.18 | 45d | 1 | 0.94mi |
| 717 Janisch Rd Unit B Houston, TX | 3.0 | 3.5 | 1821 | $2,750 | $1.51 | 45d | 1 | 0.95mi |
| 717 Janisch Rd Unit B Houston, TX | 3.0 | 3.5 | 1821 | $2,750 | $1.51 | 25d | 1 | 0.95mi |
| 622 Janisch Rd Houston, TX | 3.0 | 4.0 | 1785 | $2,650 | $1.48 | 45d | 1 | 1.09mi |
| 6555 Sealey St Houston, TX | 3.0 | 2.5 | 1800 | $2,700 | $1.50 | 25d | 1 | 1.23mi |
| 5342 Donovan Gardens Ln Unit 1521013P Houston, TX | 3.0 | 3.0 | 1743 | $2,985 | $1.71 | 9d | 1 | 1.23mi |
| 402 Del Norte St Houston, TX | 4.0 | 2.0 | 1790 | $2,300 | $1.28 | 45d | 1 | 1.25mi |
| 619 Thornton Oaks Ln Unit Labs Houston, TX | 3.0 | 2.5 | 1657 | $2,200 | $1.33 | 9d | 1 | 1.29mi |
| 774 Dillard St Houston, TX | 4.0 | 2.5 | 1899 | $2,405 | $1.27 | 22d | 1 | 1.34mi |
| 827 W 43rd St Houston, TX | 3.0 | 2.0 | 1968 | $2,200 | $1.12 | 20d | 1 | 1.35mi |
| 4813 Martin Oaks Ln Houston, TX | 3.0 | 4.0 | 1972 | $2,200 | $1.12 | 45d | 1 | 1.38mi |
| 1032 Glen Ln Houston, TX | 3.0 | 3.0 | 1667 | $2,400 | $1.44 | 45d | 1 | 1.48mi |
Listing history 16 events
-
2026-06-21days on market $119,900 Pending 123 DOM
-
2026-06-18days on market $119,900 Pending 120 DOM
-
2026-06-17days on market $119,900 Pending 119 DOM
-
2026-06-16days on market $119,900 Pending 118 DOM
-
2026-06-15days on market $119,900 Pending 117 DOM
-
2026-06-13days on market $119,900 Pending 115 DOM
-
2026-06-10days on market $119,900 Pending 111 DOM
-
2026-06-08days on market $119,900 Pending 110 DOM
-
2026-06-07days on market $119,900 Pending 109 DOM
-
2026-06-04days on market $119,900 Pending 106 DOM
-
2026-06-01days on market $119,900 Pending 103 DOM
-
2026-05-31days on market $119,900 Pending 102 DOM
-
2026-02-19status Pending
-
2025-10-28status Pending
-
2025-10-28$119,900 Active
-
1988-01-02soldstatus
ⓘ Source: listings_history table (triggers on properties + properties_extension) + one-shot
backfill from property_details.listing_events for pre-trigger history.
Climate risk First Street
- Flood 3/10 Moderate FEMA zone X (unshaded) · 10% chance over 30 yrs
- Wildfire 1/10 Low
- Heat 9/10 Extreme 7 d/yr ≥109°F today · 24 d/yr by 30 yrs out
- Wind 8/10 Severe 99% chance of damaging wind over 30 yrs
- Air quality 3/10 Moderate 2 unhealthy d/yr today · 3 by 30 yrs out
Nearby sold comps map
Loading sold comps map…
Walkable amenities ~0.75 mi
Loading nearby amenities…
Taxation est. · year 1
- Rental income
- $27,975
- − Mortgage interest
- −$6,716
- − Property taxes
- −$1,798
- − Insurance
- −$600
- − Repairs & maintenance
- −$2,238
- − Management
- −$2,238
- − Depreciation
- −$3,488
- Taxable income
- $10,897
- Est. tax owed @ 24.0%
- −$2,615
- After-tax cash flow
- $9,542/yr
For passive investors: Depreciation is non-cash, so a rental often shows a tax loss while cash-flowing — sheltering income. Rental losses are passive: they offset passive income freely, and up to $25,000/yr can offset ordinary (W-2) income if you actively participate and your MAGI is under $100k (phasing out to $0 by $150k); unused losses carry forward. On sale, claimed depreciation is recaptured at up to 25%, and gains may owe capital-gains tax (a 1031 exchange can defer both). Figures are a year-1 estimate at your 24.0% rate — not tax advice; consult a CPA.
Schools (NCES district)
- District
- Houston ISD
- NCES district ID
- 4823640
- Math proficiency
- 27% ▼ -18.00%
- Reading proficiency
- 35% ▼ -6.00%
- Median HH income
- $46,054
- Composite
- 26.63/100
- National rank
- #7173
- State rank
- #593 of 826 in TX
Livability — Houston
- Score
- 74/100
- State rank
- #184
- US rank
- #4771
Category grades
Schools grade is shown separately in the Schools card above.
Census & demographics
- Census place
- Houston, TX
- County
- Harris County · 4,702,590 people
- City population
- 3,226,434
- Metro
- Houston-The Woodlands-Sugar Land, TX
- Population (ZIP)
- 28,728
- Household income
- $35,432
- Rent vs Own
- Severe rent burden
- 3210.0
Population outlook (Harris County) Hauer SSP2
- Today (2025)
- 5,571,493 people
- By 2030
- 6,089,821 · +9.3%
- By 2040
- 7,142,806 · +28.2%
- By 2050
- 8,185,864 · +46.9%
- By 2075
- 10,574,329 · +89.8%
- By 2100
- 12,109,958 · +117.4%
Race, ethnicity, and origin ACS 2023
- Neighborhood character
- Diverse neighborhood (Simpson 0.58)
- Race & ethnicity
- Hispanic / Latino 46% Black 45% Two or more races 15% White 7%
- Hispanic origin (detail)
- Mexican 29%
- Common ancestry
- Italian 1%
- Foreign-born
- 24% · Canada, Jamaica
- Languages at home
- 55% English-only · Spanish 41% French/Haitian/Cajun 2%
Political lean MEDSL · Harris
- 2024 margin
- Lean D (+5.5) · D 52.0% · R 46.4% · Other 1.6%
- 2008→2024 swing
- +3.9pp toward D · 2008: 1.6pp · 2024: 5.5pp
- All cycles
- 2024: D+5.5 2020: D+13.3 2016: D+12.4 2012: D+0.1 2008: D+1.6
Not yet ingested
- Civics
- —
Market trends
- HPI YoY
- ▼ -94.19%
- Current HPI
- 283.7523
- Rent YoY
- ▲ 2.10%
- Metro
- Houston-The Woodlands-Sugar Land, TX
- State GDP YoY
- ▲ 3.95%
- F500 in state
- 110
Industry mix (Fortune 500 HQ in TX)
| Industry | F500 HQs | Revenue |
|---|---|---|
| Energy | 16 | $1,198B |
|
||
| Technology | 5 | $198B |
|
||
| Engineering / Construction | 4 | $72B |
|
||
| Energy Services | 3 | $60B |
|
||
| Utilities | 3 | $41B |
|
||
| Healthcare | 2 | $330B |
|
||
Price history
4 events — show timeline
- 2026-02-19 Pending — HARMLS
- 2025-10-28 Pending — HARMLS
- 2025-10-28 Listed $119,900 HARMLS
- 1988-01-02 Sold (Public Records) — Public Records
Property tax history
+2.4%/yrLatest (2025): $6,528 · +0.4% YoY. Source: county tax records.
Cash-flow waterfall
monthlySold comps — $/sqft
last 12 mo · ≤1 miLoading sold comps…