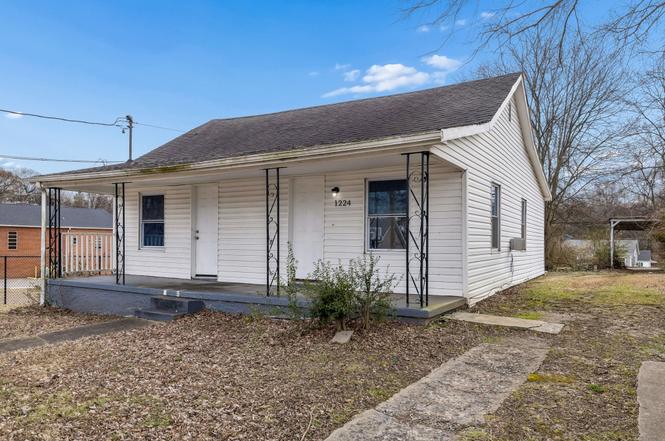
1224 Vine St · Clarksville, TN
Flood risk 1/10 · Minimal
- FEMA flood zone
- X (unshaded)
- Chance of flooding over 30 yrs
- 0.0%
- Est. flood insurance / yr
- $507 – $1,088
Fire risk 3/10 · Minor
- Est. fire insurance / yr
- $949 – $1,763
Heat risk 5/10 · Moderate
- Hot days now (above 108°F)
- 7 days/yr
- Hot days in 30 yrs
- 20 days/yr
Wind risk 4/10 · Minor
- Chance of severe wind over 30 yrs
- 9.0%
Air-quality risk 1/10 · Minimal
- Unhealthy air days now
- 0 days/yr
- Unhealthy air days in 30 yrs
- 0 days/yr
Risk factors via First Street. Map © Google.
Why this score? — see what drove the C+ grade
The composite is a weighted blend of 9 inputs, each scored 0–100. Each bar is that input's sub-score; the figure is the points it added to the 100-point composite (weight × sub-score).
- Cash flow +23.3/30.0
- ARV discount +15.0/15.0
- DSCR +7.5/10.0
- 1% rule +5.5/10.0
- Livability +4.2/5.0
- Rent growth +2.8/5.0
- Schools +2.5/10.0
- Condition / age +2.5/5.0
- Appreciation +0.0/10.0
$125,000
🖨 Deal sheet (PDF) 📄 Offer letter ✓ Due diligence
Listing remarks MLS
Great Investment Opportunity in Clarksville! This 3-bedroom, 1-bath home offers great potential with some updates and repairs. With the right vision, it could even be converted into two units, making it an excellent option for investors or buyers seeking value and versatility.
Key facts
- Detached carport
- No hoa restrictions
- Conveniently located
Tags
Property features AI
Exterior
- Parking: Detached parking; 1 covered space; 1 carport space (carport present); 1 total parking space
- Utilities: Public water; Public sewer; Water available
- Home design: Single family residence; One story; Residential property
- Construction: Vinyl siding; Shingle roof; Existing (previously built)
- Exterior features: Patio; Covered porch
Interior
- Kitchen: Electric oven, Electric range, Refrigerator
- Bedrooms: 3 bedrooms (all on main level)
- Flooring: Wood flooring
- Bathrooms: 1 full bathroom
- Heating & cooling: No heating system specified; No cooling system specified
- Interior features: Electric oven, Electric range, Refrigerator; Wood flooring; No basement
Neighborhood map
What this means for you Summary
Snapshot
- This is a 3-bed/1.0-bath single-family listed at $125k.
Deal economics
- At list price, monthly cash flow is $228 ($3k/yr) — positive.
- The deal already cash-flows at list — no discount required.
- Meets the 1% rule at list price ($1k rent vs $125k).
- Recommended offer: $110k (12.0% below list) — sets the bar for market timing.
- Cap rate 8.5% vs local median 3.5% in Clarksville — top-decile yield for the area; either an underpriced asset or a hidden risk that comps aren't pricing in. Stress-test before assuming the spread holds.
Location & tenants
- Location reads 84/100 on livability (#1 in TN, #798 nationally) — a professional / high-income tenant draw. Strengths: amenities A+, commute A+, cost of living A+; Watch: employment C-, crime D+.
- Montgomery County (urban): math 25% / reading 31% proficiency, ranked #65 of 139 in TN (top 47%) — low school quality limits family demand, transient renter base, plan for 1-2y turnover.
- Zoned schools: Moore Magnet Elementary (math 32% / reading 37%, grade F, #319 of 952 statewide, top 37%, 490 students, 0% FRL); Rossview Middle (math 31% / reading 32%, grade F, #89 of 333 statewide, top 28%, 1,022 students, 0% FRL); Rossview High (math 10% / reading 51%, grade F, #75 of 332 statewide, top 24%, 2,030 students, 0% FRL) — zoned schools average 0% FRL vs 40% district-wide (40 pts lower); this property's tenant base skews higher-income than the district average.
- Market conditions: Rents rising (+1.3%/yr); 608 active listings in the ZIP; 40 comparable units currently listed for rent nearby; rentals at typical pace (median 23d on market — plan ~3-4 weeks tenant-placement turnaround); 2,583 units permitted in Montgomery County in 2024 (617 in 5+ unit buildings).
Forward outlook
- Local home prices are declining (-3.0%/yr); year-one equity from $864 of loan paydown is wiped out by about $4k of value loss. Plan a longer hold.
- Montgomery County population projected at +49% by 2050 — long-run rental-demand tailwind backs the buy-and-hold thesis.
Negotiation context
- It's been on market 122 days — a 12% lower offer ($110k) is reasonable based on typical stale-listing flexibility.
- 3 sale attempts since 7y ago with the ask held roughly flat each time — persistent listings suggest the price (not the market) is what's stuck; bring a comps-based counter.
- Current owner paid $85k; 47% above their basis — modest negotiation headroom, anchor on the comps not their cost.
Risks & watch-outs
- Watch-outs: built in 1940 — expect roof / HVAC / electrical / plumbing capex.
- Climate carrying-cost: extreme-heat days projected 7→20/yr by 2055 (HVAC capex compounding) — expect insurance premiums to compound above CPI over the hold.
Questions for the listing agent
- It's been on market 122 days. Have you received any prior offers? Is the seller open to a 12% concession, seller financing, or rate buy-down credit?
- Built in 1940 — when were the roof, HVAC, electrical panel, plumbing, and water heater last replaced?
- Why hasn't it sold? Are there any deal-killer items the seller is aware of (foundation, flood, title, zoning, code violations)?
- Is there a deadline driving the sale (1031 exchange, divorce, estate, relocation)? That informs how much negotiation room exists.
- Crime grade is D in this area — have there been break-ins, vandalism, or insurance claims at this property in the last 3 years? What carrier currently insures it and at what premium?
- What's the average days-on-market for RENTAL listings here right now (not sales)? A rising rental-DOM trend means longer vacancies and softer asking-rent achievability than the comps imply.
- What's the recent tenant-quality profile in this submarket — average credit score on applications, eviction rate, late-payment / NSF rate, and stable-employment percentage? A property-management company in the area should have these aggregated.
- How much new for-sale + rental construction is in the pipeline within 1–3 miles? Heavy new supply typically softens prices + rents 12–24 months out; constrained supply supports both.
Investment metrics
- 1% rule
- 1.05% ✓
- Cap rate
- 8.49%
- Cash-on-cash
- 7.83%
- DSCR
- 1.35
- GRM
- 7.9
CMA / ARV
- ARV (on-the-fly)
- $187,116
- Comps found
- 12
Show comp detail 12 sales within ~0.75 mi
| Address | Dist | Beds/Ba | Sqft | Sold | Price | $/sf | Match |
|---|---|---|---|---|---|---|---|
| 1144 Cedar St | 0.14mi | 3/1.0 | 1,000 (-1%) | 10mo | $132,500 | $133 | 84 |
| 422 Glenn St | 0.21mi | 2/1.0 (-1) | 1,004 (-0%) | 4mo | $199,900 | $199 | 81 |
| 1208 Poplar St | 0.23mi | 3/1.0 | 1,050 (+4%) | 9mo | $224,400 | $214 | 74 |
| 1119 Dodd St | 0.17mi | 3/1.0 | 1,092 (+8%) | 8mo | $172,000 | $158 | 71 |
| 1331 Poplar Ct | 0.25mi | 3/1.5 | 1,032 (+3%) | 14mo | $190,000 | $184 | 71 |
| 152 Reynolds St | 0.07mi | 3/1.0 | 925 (-8%) | 18mo | $200,000 | $216 | 68 |
| 1216 Vine St | 0.04mi | 2/1.0 (-1) | 864 (-14%) | 2mo | $161,000 | $186 | 68 |
| 1308 Cedar St | 0.11mi | 3/1.0 | 1,126 (+12%) | 8mo | $189,500 | $168 | 68 |
| 1311 Poplar Ct | 0.21mi | 3/1.5 | 1,127 (+12%) | 8mo | $225,000 | $200 | 62 |
| 525 Glenn St | 0.34mi | 4/2.0 (+1) | 1,125 (+12%) | 8mo | $230,000 | $204 | 49 |
| 1032 Coulter St | 0.50mi | 3/1.0 | 1,134 (+13%) | 12mo | $145,000 | $128 | 46 |
| 1206 Talley Dr | 0.73mi | 3/1.0 | 912 (-9%) | 12mo | $135,000 | $148 | 41 |
Match score weights: distance 35% · size 25% · config 20% · recency 20%. Top-matched comps best support the ARV.
Projected returns pro-forma
-3.0% appreciation · 1.32% rent growth · sell at horizon
- IRR
- -6.2%
- Equity multiple
- 0.77×
- Total profit
- $-7,899
- Equity at exit
- $18,638
- IRR
- 1.4%
- Equity multiple
- 1.09×
- Total profit
- $3,153
- Equity at exit
- $10,808
Cash invested: $35,000 (down + closing). Projections, not guarantees.
Landlord ↔ Tenant lean methodology
- Overall (STATE)
- 87 Strongly Landlord-Friendly
- State Tennessee
- 87 Strongly Landlord-Friendly · R+13
- County
- — inherits STATE
- City
- — inherits STATE
ZIP-level market 37040
- Home prices YoY
- -22.0%
- Rents YoY
- 1.3%
- Active inventory
- 608
- Price-to-rent
- 7.9×
Monthly cashflow live
- Estimated rent
- $1,311 high interval (Pro) →
- Mortgage (P&I)
- −$656
- Tax from tax record
- −$99 /mo · $1,191/yr
- Insurance
- −$52
- HOA
- −$0
- Vacancy / Maint / Mgmt
- −$275
- Net cashflow
- $228
Break-even live
Sensitivity live
| Price | -10% $299 | -5% $264 | +0% $228 | +5% $193 | +10% $158 |
|---|---|---|---|---|---|
| Rent | -10% $125 | -5% $177 | +0% $228 | +5% $280 | +10% $332 |
| Rate | -1.0pp $291 | -0.5pp $260 | base $228 | +0.5pp $196 | +1.0pp $163 |
UW: 25.0% down · 7.5% · 30yr · 1.5% tax · 5.0% vac · 8.0% maint · 8.0% mgmt
Financing live
Cash to close
- Down payment
- $31,250
- Closing costs
- $3,750
- Reserves months
- —
- Total cash needed
- —
Loan-product check · same deal, 3 products live
Conventional
25% down · 7.5% · 30yr
- Down + closing
- —
- Monthly P&I
- —
- Monthly cashflow
- —
- DSCR
- —
- Eligible?
- —
Personal DTI + credit; lowest rate.
DSCR
20% down · 8.5% · 30yr
- Down + closing
- —
- Monthly P&I
- —
- Monthly cashflow
- —
- DSCR
- —
- Eligible?
- —
No personal income docs; deal must DSCR.
Hard money
10% down · 12.0% · 12mo
- Down + closing
- —
- Monthly P&I
- —
- Monthly cashflow
- —
- DSCR
- —
- Eligible?
- —
Short-term bridge; refi at stabilization.
Rent comps 40 comps
| Address | Beds | Baths | Sqft | Rent | $/sqft | DOM | Units | Dist |
|---|---|---|---|---|---|---|---|---|
| 1206 Cedar St Clarksville, TN | 2.0 | 1.0 | 810 | $1,100 | $1.36 | 22d | 1 | 0.11mi |
| 1206 Dodd St Clarksville, TN | 3.0 | 2.0 | 1032 | $1,299 | $1.26 | 22d | 1 | 0.17mi |
| 222 N 11th St Clarksville, TN | 3.0 | 1.0 | 1000 | $1,050 | $1.05 | 22d | 1 | 0.38mi |
| 545 12th St Clarksville, TN | 2.0 | 1.0 | 900 | $962 | $1.07 | 22d | 4 | 0.45mi |
| 211 Saint John St Clarksville, TN | 3.0 | 1.0 | 1290 | $1,575 | $1.22 | 15d | 1 | 0.46mi |
| 1221 Madison St Unit 6 Clarksville, TN | 2.0 | 1.0 | 750 | $795 | $1.06 | 22d | 1 | 0.52mi |
| 1221 Madison St Unit 2 Clarksville, TN | 2.0 | 1.0 | 750 | $795 | $1.06 | 15d | 1 | 0.55mi |
| 121 Quarry Point Dr Clarksville, TN | 2.0 | 2.5 | 1225 | $1,395 | $1.14 | 22d | 1 | 0.72mi |
| 117 Quarry Point Dr Clarksville, TN | 2.0 | 2.5 | 1220 | $1,395 | $1.14 | 22d | 1 | 0.72mi |
| 115 Quarry Point Dr Clarksville, TN | 2.0 | 2.5 | 1220 | $1,395 | $1.14 | 22d | 1 | 0.72mi |
| 122 W Point Dr Clarksville, TN | 2.0 | 2.5 | 1216 | $1,425 | $1.17 | 22d | 1 | 0.75mi |
| 335 Greenwood Ave Clarksville, TN | 2.0 | 2.5 | 1117 | $1,245 | $1.11 | 22d | 1 | 0.75mi |
| 610 Commerce St Unit 19 Clarksville, TN | 2.0 | 1.5 | 1050 | $1,100 | $1.05 | 22d | 1 | 0.78mi |
| 101 University Ave Clarksville, TN | 1.0–4.0 | 1.0–4.0 | 850 | $952 | $1.12 | 15d | 10 | 0.78mi |
| 608 Main St Clarksville, TN | 1.0–3.0 | 1.0–3.0 | 1051 | $1,295 | $1.23 | 15d | 7 | 0.80mi |
| 320 S 7th St Unit 330A Clarksville, TN | 3.0 | 2.0 | 1152 | $1,475 | $1.28 | 22d | 1 | 0.81mi |
| 121 Lookout Dr Unit Upstairs Clarksville, TN | 2.0 | 1.0 | 1476 | $1,025 | $0.69 | 15d | 1 | 0.81mi |
| 330 S 7th St Unit B Clarksville, TN | 3.0 | 2.0 | 1152 | $1,475 | $1.28 | 22d | 1 | 0.82mi |
| 528 Main St #8 Clarksville, TN | 2.0 | 1.0 | 750 | $795 | $1.06 | 22d | 1 | 0.86mi |
| 526 Main St Unit 9 Clarksville, TN | 2.0 | 1.0 | 750 | $795 | $1.06 | 22d | 1 | 0.87mi |
| 526 Main St Unit 9 Clarksville, TN | 2.0 | 1.0 | 900 | $795 | $0.88 | 15d | 1 | 0.87mi |
| 180 Clay Ridge Dr Clarksville, TN | 3.0 | 2.5 | 1412 | $1,695 | $1.20 | 22d | 1 | 0.89mi |
| 510 Main St Clarksville, TN | 2.0 | 2.5 | 1341 | $1,350 | $1.01 | 22d | 1 | 0.91mi |
| 518 Madison St Clarksville, TN | 1.0–2.0 | 1.0–2.0 | 719 | $1,995 | $2.77 | 15d | 9 | 0.91mi |
| 1521 Wilma Rudolph Blvd Clarksville, TN | 2.0 | 1.5 | 1180 | $1,319 | $1.12 | 15d | 4 | 0.93mi |
| 625 Greenwood Ave Clarksville, TN | 2.0 | 1.0 | 800 | $1,000 | $1.25 | 22d | 1 | 0.97mi |
| 1523 Nolen Rd Clarksville, TN | 2.0–3.0 | 2.0–3.0 | 1131 | $1,399 | $1.24 | 22d | 3 | 1.01mi |
| 701 Gracey Ave Clarksville, TN | 2.0 | 2.0 | 999 | $990 | $0.99 | 22d | 1 | 1.01mi |
| 330 Main St Clarksville, TN | 3.0 | 2.0 | 976 | $1,895 | $1.94 | 22d | 1 | 1.03mi |
| 251 Forbes Ave Clarksville, TN | 2.0 | 1.0 | 1125 | $1,095 | $0.97 | 22d | 1 | 1.10mi |
| 734 Robb Ave Unit B Clarksville, TN | 2.0 | 1.0 | 900 | $1,025 | $1.14 | 22d | 1 | 1.13mi |
| 1701 Old Trenton Rd Clarksville, TN | 2.0 | 2.5 | 1100 | $1,312 | $1.19 | 15d | 9 | 1.18mi |
| 1494 Golf Club Ln Clarksville, TN | 2.0–3.0 | 2.5–3.0 | 1288 | $1,620 | $1.26 | 15d | 7 | 1.24mi |
| 540 N 2nd St #302 Clarksville, TN | 2.0 | 1.0 | 850 | $900 | $1.06 | 22d | 1 | 1.26mi |
| 451 N 1st St Clarksville, TN | 2.0 | 2.5 | 1250 | $1,695 | $1.36 | 15d | 1 | 1.27mi |
| 919 Martin St Unit B6 Clarksville, TN | 2.0 | 2.5 | 1100 | $1,295 | $1.18 | 22d | 1 | 1.28mi |
| 441 Kelly Ln Clarksville, TN | 2.0–3.0 | 2.0 | 1051 | $1,225 | $1.17 | 22d | 1 | 1.29mi |
| 839 Cumberland Dr Clarksville, TN | 3.0 | 2.5 | 1269 | $1,550 | $1.22 | 15d | 1 | 1.32mi |
| 839 Cumberland Dr Clarksville, TN | 3.0 | 2.5 | 1269 | $1,550 | $1.22 | 22d | 1 | 1.32mi |
| 857 Greenwood Ave Unit A Clarksville, TN | 2.0 | 1.0 | 861 | $995 | $1.16 | 22d | 1 | 1.32mi |
Listing history 23 events
-
2026-06-21days on market $125,000 Active 122 DOM
-
2026-06-18days on market $125,000 Active 119 DOM
-
2026-06-17days on market $125,000 Active 118 DOM
-
2026-06-16days on market $125,000 Active 117 DOM
-
2026-06-15days on market $125,000 Active 116 DOM
-
2026-06-14days on market $125,000 Active 114 DOM
-
2026-06-13days on market $125,000 Active 113 DOM
-
2026-06-10days on market $125,000 Active 111 DOM
-
2026-06-09days on market $125,000 Active 110 DOM
-
2026-06-08days on market $125,000 Active 109 DOM
-
2026-06-07days on market $125,000 Active 108 DOM
-
2026-06-05days on market $125,000 Active 105 DOM
-
2026-06-03days on market $125,000 Active 104 DOM
-
2026-06-02days on market $125,000 Active 103 DOM
-
2026-05-31days on market $125,000 Active 101 DOM
-
2026-05-30days on market $125,000 Active 100 DOM
-
2026-02-19$125,000 Active
-
2026-02-06historical 277-char remark
Show marketing remark (277 chars)
Great Investment Opportunity in Clarksville! This 3-bedroom, 1-bath home offers great potential with some updates and repairs. With the right vision, it could even be converted into two units, making it an excellent option for investors or buyers seeking value and versatility.
-
2025-10-17$185,000 Active 277-char remark
Show marketing remark (277 chars)
Great Investment Opportunity in Clarksville! This 3-bedroom, 1-bath home offers great potential with some updates and repairs. With the right vision, it could even be converted into two units, making it an excellent option for investors or buyers seeking value and versatility.
-
2019-12-16soldstatus $85,000
-
2019-12-13soldstatus $50,000 Closed 445-char remark
Show marketing remark (445 chars)
**The Investors Dream** **Handyman Special** An Amazing Opportunity for the Perfect Rental Home or the Quick Fix and Flip!! Zoning Code R-3 Three Family Residential District. Land lot is from Vine St to Alley in Back. Huge Potential! Conveniently Located, Only Minutes to Campus, Shopping, Dining, & Entertainment! **CASH ONLY!** Property Being Sold As-Is Where-Is, No Warranties Expressed or Implied. The Seller Will Not Make Any Repairs.
-
2019-12-01status Pending 445-char remark
Show marketing remark (445 chars)
**The Investors Dream** **Handyman Special** An Amazing Opportunity for the Perfect Rental Home or the Quick Fix and Flip!! Zoning Code R-3 Three Family Residential District. Land lot is from Vine St to Alley in Back. Huge Potential! Conveniently Located, Only Minutes to Campus, Shopping, Dining, & Entertainment! **CASH ONLY!** Property Being Sold As-Is Where-Is, No Warranties Expressed or Implied. The Seller Will Not Make Any Repairs.
-
2019-11-25$49,900 Active 445-char remark
Show marketing remark (445 chars)
**The Investors Dream** **Handyman Special** An Amazing Opportunity for the Perfect Rental Home or the Quick Fix and Flip!! Zoning Code R-3 Three Family Residential District. Land lot is from Vine St to Alley in Back. Huge Potential! Conveniently Located, Only Minutes to Campus, Shopping, Dining, & Entertainment! **CASH ONLY!** Property Being Sold As-Is Where-Is, No Warranties Expressed or Implied. The Seller Will Not Make Any Repairs.
ⓘ Source: listings_history table (triggers on properties + properties_extension) + one-shot
backfill from property_details.listing_events for pre-trigger history.
Tax reassessment forecast TN · Resets to sale price
- Current annual tax
- $1,191 · $99/mo
- Projected year-2 tax
- $1,191 · $99/mo
- Expected delta
- $0/yr ($0/mo · 0.0%)
ⓘ Screening estimate from a state-policy table — verify with the county assessor before closing.
Climate risk First Street
- Flood 1/10 Low FEMA zone X (unshaded) · 0% chance over 30 yrs
- Wildfire 3/10 Moderate
- Heat 5/10 Major 7 d/yr ≥108°F today · 20 d/yr by 30 yrs out
- Wind 4/10 Moderate 9% chance of damaging wind over 30 yrs
- Air quality 1/10 Low 0 unhealthy d/yr today · 0 by 30 yrs out
Nearby sold comps map
Loading sold comps map…
Walkable amenities ~0.75 mi
Loading nearby amenities…
Taxation est. · year 1
- Rental income
- $15,726
- − Mortgage interest
- −$7,002
- − Property taxes
- −$1,191
- − Insurance
- −$625
- − Repairs & maintenance
- −$1,258
- − Management
- −$1,258
- − Depreciation
- −$3,636
- Taxable income
- $756
- Est. tax owed @ 24.0%
- −$181
- After-tax cash flow
- $2,560/yr
For passive investors: Depreciation is non-cash, so a rental often shows a tax loss while cash-flowing — sheltering income. Rental losses are passive: they offset passive income freely, and up to $25,000/yr can offset ordinary (W-2) income if you actively participate and your MAGI is under $100k (phasing out to $0 by $150k); unused losses carry forward. On sale, claimed depreciation is recaptured at up to 25%, and gains may owe capital-gains tax (a 1031 exchange can defer both). Figures are a year-1 estimate at your 24.0% rate — not tax advice; consult a CPA.
Schools (NCES district)
- District
- Montgomery County
- NCES district ID
- 4703030
- Math proficiency
- 25% ▼ -20.00%
- Reading proficiency
- 31% ▼ -10.00%
- Median HH income
- $50,423
- Composite
- 24.56/100
- National rank
- #7641
- State rank
- #65 of 139 in TN
Livability — Clarksville
- Score
- 84/100
- State rank
- #1
- US rank
- #798
Category grades
Schools grade is shown separately in the Schools card above.
Census & demographics
- Census place
- Clarksville, TN
- County
- Montgomery County · 211,371 people
- City population
- 211,371
- Metro
- Clarksville, TN-KY
- Population (ZIP)
- 64,977
- Household income
- $67,745
- Rent vs Own
- Severe rent burden
- 2670.0
Population outlook (Montgomery County) Hauer SSP2
- Today (2025)
- 236,633 people
- By 2030
- 258,978 · +9.4%
- By 2040
- 305,456 · +29.1%
- By 2050
- 353,147 · +49.2%
- By 2075
- 471,289 · +99.2%
- By 2100
- 564,122 · +138.4%
Race, ethnicity, and origin ACS 2023
- Neighborhood character
- Diverse neighborhood (Simpson 0.61)
- Race & ethnicity
- White 56% Black 25% Two or more races 11% Hispanic / Latino 10% Asian 2%
- Hispanic origin (detail)
- Mexican 6% Puerto Rican 2%
- Common ancestry
- Italian 4% Lithuanian 1% Slovak 1%
- Foreign-born
- 6% · Canada, South Korea
- Languages at home
- 90% English-only · Spanish 5% Other Asian/Pacific 1% Other Indo-European 1%
Political lean MEDSL · Montgomery
- 2024 margin
- R (+18.4) · D 40.0% · R 58.5% · Other 1.5%
- 2008→2024 swing
- -10.5pp toward R · 2008: -7.9pp · 2024: -18.4pp
- All cycles
- 2024: R+18.4 2020: R+12.7 2016: R+18.6 2012: R+10.5 2008: R+7.9
Not yet ingested
- Civics
- —
Market trends
- HPI YoY
- ▼ -75.79%
- Current HPI
- 269.0601
- Rent YoY
- ▲ 1.32%
- Metro
- Clarksville, TN-KY
- State GDP YoY
- ▲ 2.78%
- F500 in state
- 22
Industry mix (Fortune 500 HQ in TN)
| Industry | F500 HQs | Revenue |
|---|---|---|
| Healthcare | 3 | $91B |
|
||
| Retail | 3 | $72B |
|
||
| Transportation / Logistics | 1 | $88B |
|
||
| Paper / Packaging | 1 | $19B |
|
||
| Insurance | 1 | $13B |
|
||
| Energy | 1 | $12B |
|
||
Price history
+150.5% since first listed7 events — show timeline
- 2026-02-19 Listed $125,000 REALTRACS as Distributed by MLS Grid
- 2026-02-06 Listing Removed — REALTRACS as Distributed by MLS Grid
- 2025-10-17 Listed $185,000 REALTRACS as Distributed by MLS Grid
- 2019-12-16 Sold (Public Records) $85,000 Public Records
- 2019-12-13 Sold (MLS) $50,000 REALTRACS as Distributed by MLS Grid
- 2019-12-01 Pending — REALTRACS as Distributed by MLS Grid
- 2019-11-25 Listed $49,900 REALTRACS as Distributed by MLS Grid
Property tax history
+13.8%/yrLatest (2025): $1,191 · +1.4% YoY. Source: county tax records.
Cash-flow waterfall
monthlySold comps — $/sqft
last 12 mo · ≤1 miLoading sold comps…