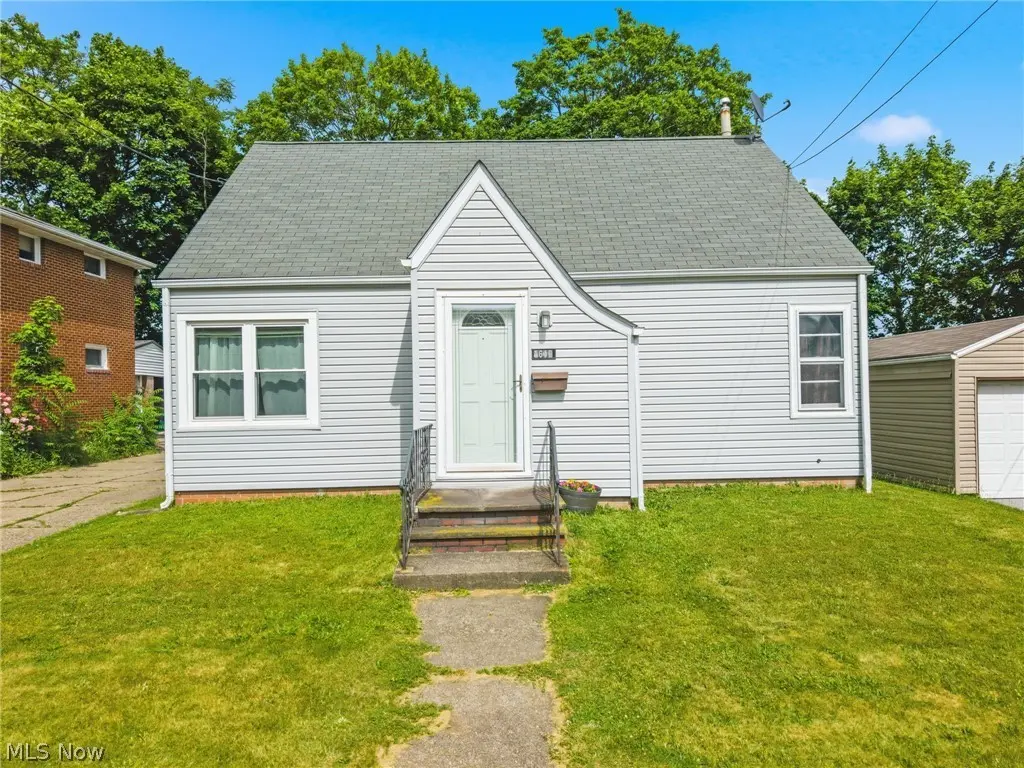
1612 Cherry Ave NE · Canton, OH
Flood risk 1/10 · Minimal
- FEMA flood zone
- X (unshaded)
- Chance of flooding over 30 yrs
- 0.0%
- Est. flood insurance / yr
- $473 – $860
Fire risk 1/10 · Minimal
- Est. fire insurance / yr
- $713 – $1,323
Heat risk 3/10 · Minor
- Hot days now (above 96°F)
- 7 days/yr
- Hot days in 30 yrs
- 17 days/yr
Wind risk 1/10 · Minimal
- Chance of severe wind over 30 yrs
- —
Air-quality risk 2/10 · Minimal
- Unhealthy air days now
- 0 days/yr
- Unhealthy air days in 30 yrs
- 1 days/yr
Risk factors via First Street. Map © Google.
Why this score? — see what drove the D- grade
The composite is a weighted blend of 9 inputs, each scored 0–100. Each bar is that input's sub-score; the figure is the points it added to the 100-point composite (weight × sub-score).
- Cash flow +15.0/30.0
- DSCR +4.6/10.0
- 1% rule +3.8/10.0
- Livability +3.6/5.0
- ARV discount +2.5/15.0
- Rent growth +2.5/5.0
- Condition / age +2.5/5.0
- Schools +1.7/10.0
- Appreciation +0.0/10.0
$110,000
🖨 Deal sheet (PDF) 📄 Offer letter ✓ Due diligence
Listing remarks MLS
* * Check out this well maintained and cared for home! All bedrooms, kitchen, bathroom and living room are on the 1st floor!!!! This home has an attached garage as well so you don't get wet carrying in your groceries! Here are the updates: Kitchen laminate floor 4 years old, Repainted the kitchen cabinets, The furnace and AC 2007, Hot water tank 2016, Every faucet in the bathroom was replaced 2019, new toilet 2019, Garage door opener 6-7 years old, New gutter guards in the back of the house, Roof 10-11 years old and siding. Come check out this cute home that has lots of character, schedule your showing now!! 2 bedrooms on the 1st floor, could be a 3rd bedroom in the basement.
Key facts
- Recent updates
- Attached garage
- Newer hot water tank
Tags
Property features AI
Exterior
- Parking: Attached garage (1 car); Additional parking
- Utilities: Public water; Public sewer
- Home design: Single-story home; Block foundation; Vinyl siding
- Construction: Asbestos shingle roof; Built per public records
- Exterior features: Patio
Interior
- Bedrooms: 2 main-level bedrooms
- Bathrooms: 1 full bathroom (main level)
- Heating & cooling: Forced air gas heating; Central air; Ceiling fans
- Interior features: Full, partially finished basement
- Laundry & utility: Laundry in basement
Neighborhood map
What this means for you Summary
Snapshot
- This is a 2-bed/1.0-bath single-family listed at $110k.
Deal economics
- At list price, monthly cash flow is $34 ($407/yr) — positive.
- The deal already cash-flows at list — no discount required.
- To meet the 1% rule (rent ≥ 1% of price), the offer needs to be $97k (11.7% below list).
- Recommended offer: $97k (11.7% below list) — sets the bar for 1% rule.
- Cap rate 6.7% vs local median 4.9% in Canton — top-decile yield for the area; either an underpriced asset or a hidden risk that comps aren't pricing in. Stress-test before assuming the spread holds.
Location & tenants
- Location reads 71/100 on livability (#441 in OH) — a middle-class / working-renter tenant base. Strengths: commute A+, cost of living A+, housing A; Watch: crime F, employment F.
- Canton City (urban): math 17% / reading 26% proficiency, ranked #627 of 656 in OH (top 96%) — low school quality limits family demand, transient renter base, plan for 1-2y turnover; 76% free/reduced lunch — lower-income household profile, screen leases tightly.
- Zoned schools: Belle Stone Elementary School (324 students, 0% FRL); Crenshaw Middle School (math 10% / reading 19%, grade F, #630 of 654 statewide, top 97%, 774 students, 0% FRL); Mckinley High School (math 8% / reading 29%, grade F, #683 of 781 statewide, top 88%, 2,154 students, 0% FRL) — zoned schools average 0% FRL vs 76% district-wide (76 pts lower); this property's tenant base skews higher-income than the district average.
- Market conditions: 34 active listings in the ZIP; 22 comparable units currently listed for rent nearby; rentals at typical pace (median 23d on market — plan ~3-4 weeks tenant-placement turnaround); 528 units permitted in Stark County in 2024 (84 in 5+ unit buildings).
Forward outlook
- Local home prices are declining (-3.0%/yr); year-one equity from $761 of loan paydown is wiped out by about $3k of value loss. Plan a longer hold.
- Stark County population projected to shrink 8% by 2050 — rents likely to lag national; underwrite the cash flow, not the appreciation.
Negotiation context
- Only 11 days on market — expect competitive offers; lowballing is unlikely to land.
- 5 sale attempts since 24y ago with the ask held roughly flat each time — persistent listings suggest the price (not the market) is what's stuck; bring a comps-based counter.
- Current owner paid $50k; list at $110k implies a 120% gain — meaningful room to come down on a strong offer.
Risks & watch-outs
- Watch-outs: built in 1948 — expect roof / HVAC / electrical / plumbing capex.
Questions for the listing agent
- Built in 1948 — when were the roof, HVAC, electrical panel, plumbing, and water heater last replaced?
- Is there a deadline driving the sale (1031 exchange, divorce, estate, relocation)? That informs how much negotiation room exists.
- Crime grade is F in this area — have there been break-ins, vandalism, or insurance claims at this property in the last 3 years? What carrier currently insures it and at what premium?
- The area grade is low — what's the realistic commute time and amenity access for the typical tenant pool here? Any planned neighborhood developments (good or bad) we should know about?
- What's the average days-on-market for RENTAL listings here right now (not sales)? A rising rental-DOM trend means longer vacancies and softer asking-rent achievability than the comps imply.
- What's the recent tenant-quality profile in this submarket — average credit score on applications, eviction rate, late-payment / NSF rate, and stable-employment percentage? A property-management company in the area should have these aggregated.
- How much new for-sale + rental construction is in the pipeline within 1–3 miles? Heavy new supply typically softens prices + rents 12–24 months out; constrained supply supports both.
Investment metrics
- 1% rule
- 0.88% ✗
- Cap rate
- 6.66%
- Cash-on-cash
- 1.32%
- DSCR
- 1.06
- GRM
- 9.4
CMA / ARV
- ARV (on-the-fly)
- $98,968
- Comps found
- 12
Show comp detail 12 sales within ~0.75 mi
| Address | Dist | Beds/Ba | Sqft | Sold | Price | $/sf | Match |
|---|---|---|---|---|---|---|---|
| 1629 Gibbs Ave NE | 0.24mi | 3/1.0 (+1) | 1,152 (+4%) | 1mo | $75,000 | $65 | 77 |
| 601 Melrose Pl NE | 0.22mi | 3/1.0 (+1) | 1,158 (+4%) | 2mo | $75,000 | $65 | 76 |
| 1311 18th St NE | 0.45mi | 3/1.0 (+1) | 1,100 (-1%) | 1mo | $125,000 | $114 | 71 |
| 1446 Downing Ct NE | 0.21mi | 3/1.0 (+1) | 1,248 (+12%) | 1mo | $10,000 | $8 | 64 |
| 1115 21st St NE | 0.49mi | 3/1.0 (+1) | 1,053 (-5%) | 0mo | $125,000 | $119 | 63 |
| 1003 Sherlock Pl NE | 0.37mi | 3/1.0 (+1) | 1,008 (-9%) | 2mo | $80,000 | $79 | 60 |
| 1624 May Pl NE | 0.65mi | 2/1.0 | 1,222 (+10%) | 3mo | $108,150 | $89 | 51 |
| 1227 Worley Ave NW | 0.74mi | 3/2.0 (+1) | 1,092 (-2%) | 3mo | $120,000 | $110 | 51 |
| 1729 Frazer Ave NW | 0.52mi | 3/1.0 (+1) | 1,248 (+12%) | 1mo | $195,000 | $156 | 50 |
| 1161 Spring Ave NE | 0.47mi | 3/2.0 (+1) | 1,250 (+12%) | 3mo | $25,000 | $20 | 46 |
| 1525 14th St NE | 0.61mi | 3/1.0 (+1) | 1,264 (+14%) | 2mo | $21,900 | $17 | 42 |
| 1607 18th St NE | 0.63mi | 3/1.0 (+1) | 1,276 (+15%) | 3mo | $118,000 | $92 | 38 |
Match score weights: distance 35% · size 25% · config 20% · recency 20%. Top-matched comps best support the ARV.
Projected returns pro-forma
-3.0% appreciation · 3.0% rent growth · sell at horizon
- IRR
- -14.2%
- Equity multiple
- 0.49×
- Total profit
- $-15,668
- Equity at exit
- $16,401
- IRR
- -5.4%
- Equity multiple
- 0.65×
- Total profit
- $-10,873
- Equity at exit
- $9,511
Cash invested: $30,800 (down + closing). Projections, not guarantees.
Landlord ↔ Tenant lean methodology
- Overall (STATE)
- 73 Landlord-Friendly
- State Ohio
- 73 Landlord-Friendly · R+6
- County
- — inherits STATE
- City
- — inherits STATE
ZIP-level market 44714
- Home prices YoY
- -34.6%
- Active inventory
- 34
- Price-to-rent
- 9.4×
Monthly cashflow live
- Estimated rent
- $971 high interval (Pro) →
- Mortgage (P&I)
- −$577
- Tax from tax record
- −$110 /mo · $1,325/yr
- Insurance
- −$46
- HOA
- −$0
- Vacancy / Maint / Mgmt
- −$204
- Net cashflow
- $34
Break-even live
Sensitivity live
| Price | -10% $96 | -5% $65 | +0% $34 | +5% $3 | +10% $-28 |
|---|---|---|---|---|---|
| Rent | -10% $-43 | -5% $-4 | +0% $34 | +5% $72 | +10% $111 |
| Rate | -1.0pp $89 | -0.5pp $62 | base $34 | +0.5pp $5 | +1.0pp $-24 |
UW: 25.0% down · 7.5% · 30yr · 1.5% tax · 5.0% vac · 8.0% maint · 8.0% mgmt
Financing live
Cash to close
- Down payment
- $27,500
- Closing costs
- $3,300
- Reserves months
- —
- Total cash needed
- —
Loan-product check · same deal, 3 products live
Conventional
25% down · 7.5% · 30yr
- Down + closing
- —
- Monthly P&I
- —
- Monthly cashflow
- —
- DSCR
- —
- Eligible?
- —
Personal DTI + credit; lowest rate.
DSCR
20% down · 8.5% · 30yr
- Down + closing
- —
- Monthly P&I
- —
- Monthly cashflow
- —
- DSCR
- —
- Eligible?
- —
No personal income docs; deal must DSCR.
Hard money
10% down · 12.0% · 12mo
- Down + closing
- —
- Monthly P&I
- —
- Monthly cashflow
- —
- DSCR
- —
- Eligible?
- —
Short-term bridge; refi at stabilization.
Rent comps 22 comps
| Address | Beds | Baths | Sqft | Rent | $/sqft | DOM | Units | Dist |
|---|---|---|---|---|---|---|---|---|
| 1613 Spring Ave NE Canton, OH | 3.0 | 1.0 | 1320 | $1,095 | $0.83 | 23d | 1 | 0.05mi |
| 1629 Spring Ave NE Unit Na Canton, OH | 2.0 | 1.0 | 1100 | $836 | $0.76 | 23d | 1 | 0.07mi |
| 123 17th St NW Canton, OH | 2.0 | 1.0–1.5 | 766 | $1,050 | $1.37 | 15d | 1 | 0.21mi |
| 1220 Market Ave N Unit 4 Canton, OH | 3.0 | 1.0 | 1400 | $1,100 | $0.79 | 45d | 1 | 0.43mi |
| 1238 Logan Ave NW Apt 2 Canton, OH | 1.0 | 1.0 | 700 | $650 | $0.93 | 45d | 1 | 0.45mi |
| 1307 Woodland Ave NW Unit 2 Canton, OH | 2.0 | 1.0 | 973 | $675 | $0.69 | 45d | 1 | 0.53mi |
| 1524 Parkhill Pl NE Canton, OH | 3.0 | 1.0 | 856 | $995 | $1.16 | 45d | 1 | 0.57mi |
| 1206 Lawrence Rd NE Apt 3 Canton, OH | 2.0 | 1.0 | 900 | $950 | $1.06 | 23d | 1 | 0.62mi |
| 1212 Shorb Ave NW #1 Canton, OH | 2.0 | 1.0 | 832 | $850 | $1.02 | 45d | 1 | 0.77mi |
| 1008 14th St NW Canton, OH | 3.0 | 1.5 | 1100 | $898 | $0.82 | 23d | 1 | 0.78mi |
| 2018 Maple Ave NE Canton, OH | 2.0 | 1.0 | 1206 | $950 | $0.79 | 15d | 1 | 0.80mi |
| 1103 19th St NW Unit 1103 Canton, OH | 1.0 | 1.0 | 981 | $750 | $0.76 | 45d | 1 | 0.88mi |
| 1216 14th St NW Canton, OH | 3.0 | 1.0 | 1352 | $1,100 | $0.81 | 23d | 1 | 0.94mi |
| 1224 15th St NW Unit 1 Canton, OH | 2.0 | 1.0 | 900 | $749 | $0.83 | 23d | 1 | 0.95mi |
| 1029 23rd St NW Canton, OH | 3.0 | 1.0 | 1356 | $1,500 | $1.11 | 15d | 1 | 0.99mi |
| 1421 Piper Ct NW Canton, OH | 3.0 | 1.5 | 1311 | $995 | $0.76 | 23d | 1 | 1.01mi |
| 1335 14th St NW Unit 4 Canton, OH | 1.0 | 1.0 | 700 | $675 | $0.96 | 15d | 1 | 1.05mi |
| 2213 17th St NE Canton, OH | 2.0 | 1.0 | 1132 | $1,100 | $0.97 | 46d | 1 | 1.11mi |
| 1016 2nd St NW Canton, OH | 1.0–3.0 | 1.0–2.0 | 916 | $748 | $0.82 | 15d | 20 | 1.30mi |
| 200 High Ave SW Canton, OH | 1.0 | 1.0 | 750 | $700 | $0.93 | 15d | 3 | 1.33mi |
| 1511 2nd St NE Canton, OH | 3.0 | 1.0 | 1129 | $1,250 | $1.11 | 45d | 1 | 1.34mi |
| 1906 6th St NE Unit 1906-002 Canton, OH | 3.0 | 1.0 | 906 | $1,000 | $1.10 | 15d | 1 | 1.42mi |
Listing history 8 events
-
2026-06-21days on market $110,000 Active 11 DOM
-
2026-06-18days on market $110,000 Active 8 DOM
-
2026-06-17days on market $110,000 Active 7 DOM
-
2026-06-16days on market $110,000 Active 6 DOM
-
2026-06-15days on market $110,000 Active 5 DOM
-
2026-06-14days on market $110,000 Active 3 DOM
-
2026-06-13remarks 699-char remark
-
2026-06-13$110,000 Active 2 DOM
ⓘ Source: listings_history table (triggers on properties + properties_extension) + one-shot
backfill from property_details.listing_events for pre-trigger history.
Tax reassessment forecast OH · Partial reset (capped growth)
- Current annual tax
- $1,325 · $110/mo
- Projected year-2 tax
- $1,521 · $127/mo
- Expected delta
- +$195/yr (+$16/mo · 14.7%)
ⓘ Screening estimate from a state-policy table — verify with the county assessor before closing.
Climate risk First Street
- Flood 1/10 Low FEMA zone X (unshaded) · 0% chance over 30 yrs
- Wildfire 1/10 Low
- Heat 3/10 Moderate 7 d/yr ≥96°F today · 17 d/yr by 30 yrs out
- Wind 1/10 Low
- Air quality 2/10 Low 0 unhealthy d/yr today · 1 by 30 yrs out
Nearby sold comps map
Loading sold comps map…
Walkable amenities ~0.75 mi
Loading nearby amenities…
Taxation est. · year 1
- Rental income
- $11,651
- − Mortgage interest
- −$6,162
- − Property taxes
- −$1,325
- − Insurance
- −$550
- − Repairs & maintenance
- −$932
- − Management
- −$932
- − Depreciation
- −$3,200
- Taxable loss
- −$1,450
- Est. tax savings @ 24.0%
- +$348
- After-tax cash flow
- $755/yr
For passive investors: Depreciation is non-cash, so a rental often shows a tax loss while cash-flowing — sheltering income. Rental losses are passive: they offset passive income freely, and up to $25,000/yr can offset ordinary (W-2) income if you actively participate and your MAGI is under $100k (phasing out to $0 by $150k); unused losses carry forward. On sale, claimed depreciation is recaptured at up to 25%, and gains may owe capital-gains tax (a 1031 exchange can defer both). Figures are a year-1 estimate at your 24.0% rate — not tax advice; consult a CPA.
Schools (NCES district)
- District
- Canton City
- NCES district ID
- 3904371
- Math proficiency
- 17% ▼ -17.00%
- Reading proficiency
- 26% ▼ -12.00%
- Median HH income
- $28,825
- Composite
- 17.1/100
- National rank
- #9116
- State rank
- #627 of 656 in OH
Livability — Canton
- Score
- 71/100
- State rank
- #441
- US rank
- #7259
Category grades
Schools grade is shown separately in the Schools card above.
Census & demographics
- Census place
- Canton, OH
- County
- Stark County · 272,865 people
- City population
- 103,614
- Metro
- Canton-Massillon, OH
- Population (ZIP)
- 10,210
- Household income
- $55,905
- Rent vs Own
- Severe rent burden
- 207.0
Population outlook (Stark County) Hauer SSP2
- Today (2025)
- 373,708 people
- By 2030
- 371,245 · -0.7%
- By 2040
- 361,331 · -3.3%
- By 2050
- 345,290 · -7.6%
- By 2075
- 302,669 · -19.0%
- By 2100
- 238,870 · -36.1%
Race, ethnicity, and origin ACS 2023
- Neighborhood character
- Predominantly White (72%)
- Race & ethnicity
- White 72% Black 20% Two or more races 7% Hispanic / Latino 5%
- Common ancestry
- Italian 6% Romanian 2% Slovak 1%
- Foreign-born
- 3% · Canada
- Languages at home
- 95% English-only · Spanish 4% Other Indo-European 1%
Political lean MEDSL · Stark
- 2024 margin
- Strong R (+21.9) · D 38.6% · R 60.5%
- 2008→2024 swing
- -27.4pp toward R · 2008: 5.5pp · 2024: -21.9pp
- All cycles
- 2024: R+21.9 2020: R+18.5 2016: R+17.4 2012: R+0.4 2008: D+5.5
Not yet ingested
- Civics
- —
Market trends
- HPI YoY
- ▼ -110.96%
- Current HPI
- 209.5637
- Rent YoY
- —
- Metro
- Canton-Massillon, OH
- State GDP YoY
- ▲ 1.98%
- F500 in state
- 48
Industry mix (Fortune 500 HQ in OH)
| Industry | F500 HQs | Revenue |
|---|---|---|
| Insurance | 3 | $145B |
|
||
| Industrial Machinery | 3 | $49B |
|
||
| Financial Services | 3 | $24B |
|
||
| Consumer Goods | 2 | $93B |
|
||
| Aerospace / Defense | 2 | $47B |
|
||
| Utilities | 2 | $33B |
|
||
Price history
+103.7% since first listed15 events — show timeline
- 2026-06-11 Listed $110,000 MLSNOW
- 2019-11-22 Sold (Public Records) $49,900 Public Records
- 2019-11-22 Sold (MLS) $49,900 MLSNOW
- 2019-11-07 Pending — MLSNOW
- 2019-10-24 Contingent — MLSNOW
- 2019-09-30 Price Changed $49,900 MLSNOW
- 2019-09-21 Listed $54,900 MLSNOW
- 2004-03-17 Sold (Public Records) $38,000 Public Records
- 2004-03-16 Sold (MLS) $38,000 MLSNOW
- 2003-10-31 Listed $46,000 MLSNOW
- 2003-08-11 Listing Removed — MLSNOW
- 2003-04-11 Listed $58,500 MLSNOW
- 2003-03-05 Listing Removed — MLSNOW
- 2002-11-05 Listed $58,500 MLSNOW
- 2000-07-25 Sold (Public Records) $54,000 Public Records
Property tax history
+3.2%/yrLatest (2024): $1,325 · +46.1% YoY. Source: county tax records.
Cash-flow waterfall
monthlySold comps — $/sqft
last 12 mo · ≤1 miLoading sold comps…