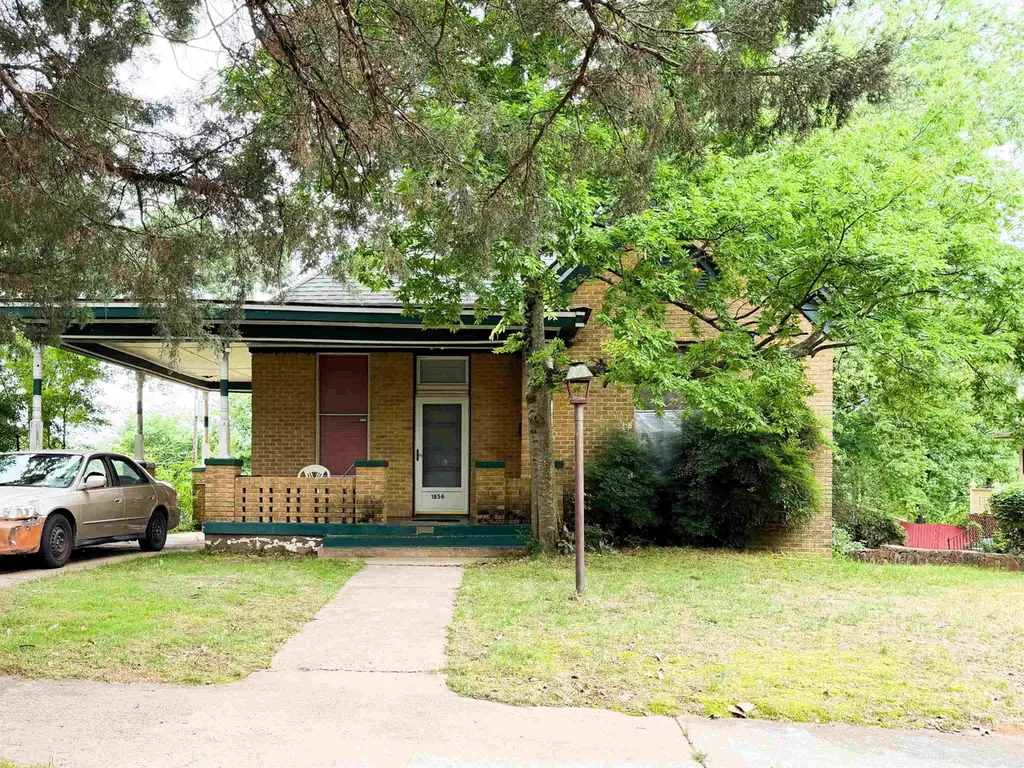
1856 S Cross St · Little Rock, AR
Flood risk 1/10 · Minimal
- FEMA flood zone
- X (unshaded)
- Chance of flooding over 30 yrs
- 0.0%
- Est. flood insurance / yr
- $507 – $1,088
Fire risk 1/10 · Minimal
- Est. fire insurance / yr
- $1,499 – $2,785
Heat risk 7/10 · Major
- Hot days now (above 110°F)
- 7 days/yr
- Hot days in 30 yrs
- 19 days/yr
Wind risk 4/10 · Minor
- Chance of severe wind over 30 yrs
- 9.0%
Air-quality risk 2/10 · Minimal
- Unhealthy air days now
- 1 days/yr
- Unhealthy air days in 30 yrs
- 1 days/yr
Risk factors via First Street. Map © Google.
Why this score? — see what drove the B+ grade
The composite is a weighted blend of 9 inputs, each scored 0–100. Each bar is that input's sub-score; the figure is the points it added to the 100-point composite (weight × sub-score).
- Cash flow +30.0/30.0
- ARV discount +15.0/15.0
- DSCR +10.0/10.0
- 1% rule +9.9/10.0
- Livability +3.7/5.0
- Rent growth +3.3/5.0
- Condition / age +2.5/5.0
- Schools +2.1/10.0
- Appreciation +0.0/10.0
$95,000
🖨 Deal sheet (PDF) 📄 Offer letter ✓ Due diligence
Listing remarks
Opportunity awaits at 1856 South Cross in Little Rock! This 3-bedroom home is packed with early 20th century character and ready for someone with vision to bring it back to life. Featuring soaring 12-foot ceilings and the kind of architectural charm that’s hard to find in newer construction, this property offers incredible potential for investors, contractors, or anyone looking for their next flip project. With the right updates and restoration, this home could truly shine while preserving its historic appeal. Conveniently located near downtown amenities, dining, and major thoroughfares, this is a chance to transform a classic property into something special.
Key facts
- Architectural charm
- Historic appeal
- 12 foot ceilings
Tags
Property features AI
Finance
- Other: Approximate lot size: 7,405 sq ft (0.17 acre)
- Financial info: Financing available: Conventional loan or cash
Exterior
- Parking: Carport for 2 cars
- Utilities: Public water; Municipal electric service (Entergy)
- Home design: Single-family property; Approx. 1,650 square feet
- Construction: Composition roof; Crawl space foundation
- Exterior features: Brick exterior; Deck; Porch; Partially fenced yard; Paved road access; Level lot; Inside city limits
Interior
- Kitchen: Free-standing stove
- Flooring: Carpet; Vinyl
- Bathrooms: 2 full bathrooms
- Heating & cooling: Window air conditioning units; Electric space heater
- Interior features: Washer connection and electric dryer connection; Sheetrock walls/ceilings
- Laundry & utility: Laundry room; Washer connection and electric dryer connection
Neighborhood map
What this means for you Summary
Snapshot
- This is a 3-bed/2.0-bath single-family listed at $95k.
Deal economics
- At list price, monthly cash flow is $522 ($6k/yr) — positive.
- The deal already cash-flows at list — no discount required.
- Meets the 1% rule at list price ($1k rent vs $95k).
- Recommended offer: $94k (1.5% below list) — sets the bar for market timing.
- Cap rate 12.9% vs local median 4.1% in Little Rock — top-decile yield for the area; either an underpriced asset or a hidden risk that comps aren't pricing in. Stress-test before assuming the spread holds.
Location & tenants
- Location reads 73/100 on livability (#22 in AR) — a middle-class / working-renter tenant base. Strengths: commute A+, cost of living A+, housing A+; Watch: crime F.
- Little Rock School District (urban): math 23% / reading 26% proficiency, ranked #183 of 238 in AR (top 77%) — low school quality limits family demand, transient renter base, plan for 1-2y turnover; 69% free/reduced lunch — lower-income household profile, screen leases tightly.
- Zoned schools: Washington Elementary School (math 12% / reading 8%, grade F, #429 of 454 statewide, top 96%, 319 students, 97% FRL); Dunbar Magnet Middle School (math 6% / reading 13%, grade F, #196 of 201 statewide, top 98%, 320 students, 90% FRL); Central High School (math 32% / reading 42%, grade F, #64 of 292 statewide, top 26%, 2,338 students, 53% FRL).
- Market conditions: Rents rising (+3.4%/yr); 126 active listings in the ZIP; 40 comparable units currently listed for rent nearby; rentals lingering (median 46d on market — plan ~5-8 weeks vacancy on turnover, expect pricing pressure); 50% of comp listings sitting > 30 days — soft ceiling on asking rent; 1,006 units permitted in Pulaski County in 2024 (0 in 5+ unit buildings).
- This rent runs 33% of the median local income ($52k/yr) — at the standard rent-burdened threshold; future hikes will face affordability resistance.
Forward outlook
- Local home prices are declining (-3.0%/yr); year-one equity from $657 of loan paydown is wiped out by about $3k of value loss. Plan a longer hold.
- Pulaski County population projected at +6% by 2050 — modest demand growth; plan on rents tracking national, not racing it.
- At projected returns (-3.0% appreciation + 3.4% rent growth), your $27k cash investment doubles in ~6 years — after that, you're playing with house money.
Negotiation context
- It's been on market 23 days — a 2% lower offer ($94k) is reasonable based on typical stale-listing flexibility.
Risks & watch-outs
- Watch-outs: built in 1920 — expect roof / HVAC / electrical / plumbing capex.
- Climate carrying-cost: extreme-heat days projected 7→19/yr by 2055 (HVAC capex compounding) — expect insurance premiums to compound above CPI over the hold.
Questions for the listing agent
- Built in 1920 — when were the roof, HVAC, electrical panel, plumbing, and water heater last replaced?
- Is there a deadline driving the sale (1031 exchange, divorce, estate, relocation)? That informs how much negotiation room exists.
- Crime grade is F in this area — have there been break-ins, vandalism, or insurance claims at this property in the last 3 years? What carrier currently insures it and at what premium?
- What's the average days-on-market for RENTAL listings here right now (not sales)? A rising rental-DOM trend means longer vacancies and softer asking-rent achievability than the comps imply.
- What's the recent tenant-quality profile in this submarket — average credit score on applications, eviction rate, late-payment / NSF rate, and stable-employment percentage? A property-management company in the area should have these aggregated.
- How much new for-sale + rental construction is in the pipeline within 1–3 miles? Heavy new supply typically softens prices + rents 12–24 months out; constrained supply supports both.
Investment metrics
- 1% rule
- 1.49% ✓
- Cap rate
- 12.89%
- Cash-on-cash
- 23.54%
- DSCR
- 2.05
- GRM
- 5.6
CMA / ARV
- ARV (on-the-fly)
- $175,602
- Comps found
- 12
Show comp detail 12 sales within ~0.75 mi
| Address | Dist | Beds/Ba | Sqft | Sold | Price | $/sf | Match |
|---|---|---|---|---|---|---|---|
| 1609 W Charles Bussey Ave | 0.26mi | 3/2.0 | 1,562 (+0%) | 6mo | $30,000 | $19 | 82 |
| 1515 W 19th St | 0.19mi | 3/2.0 | 1,675 (+8%) | 2mo | $44,000 | $26 | 76 |
| 1608 S Cross St | 0.23mi | 2/2.5 (-1) | 1,581 (+2%) | 5mo | $172,000 | $109 | 75 |
| 2023 S Izard St | 0.29mi | 3/2.0 | 1,665 (+7%) | 1mo | $193,000 | $116 | 74 |
| 1806 S State St | 0.28mi | 3/1.0 | 1,464 (-6%) | 3mo | $105,000 | $72 | 70 |
| 2411 S Schiller | 0.65mi | 3/2.0 | 1,547 (-0%) | 2mo | $240,000 | $155 | 68 |
| 1908 S Gaines St | 0.35mi | 2/2.0 (-1) | 1,605 (+3%) | 9mo | $320,000 | $199 | 66 |
| 1872 S Gaines St | 0.35mi | 2/2.0 (-1) | 1,410 (-9%) | 5mo | $64,500 | $46 | 59 |
| 1509 W 19th St | 0.18mi | 2/1.0 (-1) | 1,352 (-13%) | 7mo | $50,000 | $37 | 55 |
| 315 W 22nd St | 0.65mi | 3/2.0 | 1,717 (+10%) | 2mo | $231,925 | $135 | 51 |
| 1417 Wolfe St | 0.49mi | 2/1.0 (-1) | 1,374 (-12%) | 2mo | $155,000 | $113 | 47 |
| 2018 Center St | 0.64mi | 2/1.0 (-1) | 1,422 (-8%) | 9mo | $170,000 | $120 | 40 |
Match score weights: distance 35% · size 25% · config 20% · recency 20%. Top-matched comps best support the ARV.
Projected returns pro-forma
-3.0% appreciation · 3.36% rent growth · sell at horizon
- IRR
- 17.0%
- Equity multiple
- 1.69×
- Total profit
- $18,344
- Equity at exit
- $14,165
- IRR
- 25.8%
- Equity multiple
- 3.29×
- Total profit
- $60,834
- Equity at exit
- $8,214
Cash invested: $26,600 (down + closing). Projections, not guarantees.
Landlord ↔ Tenant lean methodology
- Overall (STATE)
- 92 Strongly Landlord-Friendly
- State Arkansas
- 92 Strongly Landlord-Friendly · R+14
- County
- — inherits STATE
- City
- — inherits STATE
ZIP-level market 72206
- Rents YoY
- 3.4%
- Active inventory
- 126
- Price-to-rent
- 5.6×
Monthly cashflow live
- Estimated rent
- $1,414 high interval (Pro) →
- Mortgage (P&I)
- −$498
- Tax from tax record
- −$57 /mo · $688/yr
- Insurance
- −$40
- HOA
- −$0
- Vacancy / Maint / Mgmt
- −$297
- Net cashflow
- $522
Break-even live
Sensitivity live
| Price | -10% $576 | -5% $549 | +0% $522 | +5% $495 | +10% $468 |
|---|---|---|---|---|---|
| Rent | -10% $410 | -5% $466 | +0% $522 | +5% $578 | +10% $634 |
| Rate | -1.0pp $570 | -0.5pp $546 | base $522 | +0.5pp $497 | +1.0pp $472 |
UW: 25.0% down · 7.5% · 30yr · 1.5% tax · 5.0% vac · 8.0% maint · 8.0% mgmt
Financing live
Cash to close
- Down payment
- $23,750
- Closing costs
- $2,850
- Reserves months
- —
- Total cash needed
- —
Loan-product check · same deal, 3 products live
Conventional
25% down · 7.5% · 30yr
- Down + closing
- —
- Monthly P&I
- —
- Monthly cashflow
- —
- DSCR
- —
- Eligible?
- —
Personal DTI + credit; lowest rate.
DSCR
20% down · 8.5% · 30yr
- Down + closing
- —
- Monthly P&I
- —
- Monthly cashflow
- —
- DSCR
- —
- Eligible?
- —
No personal income docs; deal must DSCR.
Hard money
10% down · 12.0% · 12mo
- Down + closing
- —
- Monthly P&I
- —
- Monthly cashflow
- —
- DSCR
- —
- Eligible?
- —
Short-term bridge; refi at stabilization.
Rent comps 40 comps
| Address | Beds | Baths | Sqft | Rent | $/sqft | DOM | Units | Dist |
|---|---|---|---|---|---|---|---|---|
| 1903 Marshall St Little Rock, AR | 3.0 | 2.0 | 1152 | $1,200 | $1.04 | 25d | 1 | 0.27mi |
| 1906 S State St Little Rock, AR | 2.0 | 2.0 | 1160 | $1,895 | $1.63 | 45d | 1 | 0.28mi |
| 1908 S State St Little Rock, AR | 2.0 | 2.0 | 1160 | $1,650 | $1.42 | 45d | 1 | 0.28mi |
| 1209 W 22nd St Little Rock, AR | 4.0 | 2.0 | 1104 | $1,850 | $1.68 | 45d | 1 | 0.29mi |
| 1515 Wolfe St Little Rock, AR | 3.0 | 2.0 | 1386 | $1,100 | $0.79 | 25d | 1 | 0.44mi |
| 2113 W 19th St Little Rock, AR | 2.0 | 1.0 | 1703 | $1,300 | $0.76 | 45d | 1 | 0.57mi |
| 2610 S Izard St Little Rock, AR | 3.0 | 2.0 | 1136 | $1,150 | $1.01 | 45d | 1 | 0.62mi |
| 2616 S Izard St Little Rock, AR | 4.0 | 2.0 | 1223 | $1,595 | $1.30 | 45d | 1 | 0.64mi |
| 1500 Center St Unit 5 Little Rock, AR | 2.0 | 1.5 | 1100 | $1,295 | $1.18 | 45d | 1 | 0.66mi |
| 313 W 23rd St Little Rock, AR | 3.0 | 2.0 | 1134 | $925 | $0.82 | 25d | 1 | 0.69mi |
| 2323 S Spring St Little Rock, AR | 3.0 | 2.0 | 1070 | $1,100 | $1.03 | 45d | 1 | 0.71mi |
| 2604 Broadway St Little Rock, AR | 4.0 | 2.0 | 1223 | $1,595 | $1.30 | 25d | 1 | 0.75mi |
| 1212 Center St Little Rock, AR | 2.0 | 2.0 | 1200 | $1,750 | $1.46 | 25d | 1 | 0.76mi |
| 2200 Dennison St Little Rock, AR | 3.0 | 1.5 | 1080 | $1,000 | $0.93 | 45d | 1 | 0.77mi |
| 926 W 29th St Little Rock, AR | 3.0 | 1.0 | 1229 | $1,050 | $0.85 | 25d | 1 | 0.78mi |
| 2712 Broadway St Little Rock, AR | 3.0 | 3.0 | 2021 | $1,695 | $0.84 | 45d | 1 | 0.81mi |
| 201 E 17th St Little Rock, AR | 2.0 | 1.5 | 1124 | $1,550 | $1.38 | 16d | 1 | 0.84mi |
| 1123 Thayer St Little Rock, AR | 4.0 | 2.0 | 1223 | $1,595 | $1.30 | 25d | 1 | 0.96mi |
| 1401 Cumberland St Little Rock, AR | 3.0 | 1.0 | 1566 | $1,250 | $0.80 | 45d | 1 | 0.97mi |
| 1401 Cumberland St Little Rock, AR | 3.0 | 1.0 | 1566 | $1,295 | $0.83 | 16d | 1 | 0.97mi |
| 2900 Center St Little Rock, AR | 3.0 | 1.0 | 1456 | $1,050 | $0.72 | 45d | 1 | 0.98mi |
| 1004 Scott St Unit 1 Little Rock, AR | 2.0 | 1.0 | 1398 | $1,395 | $1.00 | 25d | 1 | 1.01mi |
| 2318 Rock St Little Rock, AR | 2.0 | 2.0 | 1358 | $2,300 | $1.69 | 45d | 1 | 1.03mi |
| 717 W 32nd St Unit A and B Little Rock, AR | 3.0 | 2.5 | 1300 | $1,550 | $1.19 | 16d | 1 | 1.03mi |
| 3222 Bishop St Unit B Little Rock, AR | 3.0 | 2.0 | 1200 | $1,300 | $1.08 | 25d | 1 | 1.07mi |
| 2803 W Daisy L Gatson Bates Dr Little Rock, AR | 4.0 | 2.0 | 1138 | $1,495 | $1.31 | 45d | 1 | 1.09mi |
| 421 W 32nd St Little Rock, AR | 4.0 | 2.0 | 1223 | $1,550 | $1.27 | 20d | 1 | 1.11mi |
| 3015 Main St Little Rock, AR | 4.0 | 2.0 | 1658 | $2,350 | $1.42 | 45d | 1 | 1.14mi |
| 2900 W 15th St Little Rock, AR | 3.0 | 1.0 | 1337 | $950 | $0.71 | 45d | 1 | 1.15mi |
| 2708 Rock St Little Rock, AR | 3.0 | 1.0 | 1114 | $875 | $0.79 | 23d | 1 | 1.15mi |
| 606 E 21st St Little Rock, AR | 3.0 | 2.0 | 1652 | $1,600 | $0.97 | 20d | 1 | 1.16mi |
| 1822 Booker St Little Rock, AR | 3.0 | 2.0 | 1076 | $1,195 | $1.11 | 25d | 1 | 1.17mi |
| 324 S Schiller St Little Rock, AR | 3.0 | 2.0 | 1352 | $1,995 | $1.48 | 25d | 1 | 1.20mi |
| 1820 Johnson St Little Rock, AR | 4.0 | 2.0 | 1223 | $1,550 | $1.27 | 20d | 1 | 1.23mi |
| 1626 S Brown St Little Rock, AR | 3.0 | 2.0 | 1386 | $995 | $0.72 | 45d | 1 | 1.36mi |
| 3109 W 11th St Little Rock, AR | 3.0 | 2.0 | 1055 | $1,295 | $1.23 | 45d | 1 | 1.37mi |
| 212 Rice St Little Rock, AR | 3.0 | 2.0 | 1442 | $1,795 | $1.24 | 20d | 1 | 1.38mi |
| 3214 W 13th St Little Rock, AR | 3.0 | 2.0 | 1264 | $1,095 | $0.87 | 45d | 1 | 1.40mi |
| 2220 S Martin St Little Rock, AR | 2.0 | 1.0 | 1143 | $900 | $0.79 | 25d | 1 | 1.43mi |
| 3401 W 17th St Little Rock, AR | 3.0 | 2.0 | 1370 | $1,400 | $1.02 | 45d | 1 | 1.43mi |
Listing history 12 events
-
2026-06-13statusdays on market $95,000 Under Contract 23 DOM
-
2026-06-10days on market $95,000 Active 21 DOM
-
2026-06-09days on market $95,000 Active 20 DOM
-
2026-06-08days on market $95,000 Active 19 DOM
-
2026-06-07days on market $95,000 Active 18 DOM
-
2026-06-05days on market $95,000 Active 15 DOM
-
2026-06-03days on market $95,000 Active 14 DOM
-
2026-06-02days on market $95,000 Active 13 DOM
-
2026-06-01days on market $95,000 Active 12 DOM
-
2026-05-31days on market $95,000 Active 11 DOM
-
2026-05-31days on market $95,000 Active 10 DOM
-
2026-05-20$95,000 New Listing
ⓘ Source: listings_history table (triggers on properties + properties_extension) + one-shot
backfill from property_details.listing_events for pre-trigger history.
Tax reassessment forecast AR · Resets to sale price
- Current annual tax
- $688 · $57/mo
- Projected year-2 tax
- $688 · $57/mo
- Expected delta
- $0/yr ($0/mo · 0.0%)
ⓘ Screening estimate from a state-policy table — verify with the county assessor before closing.
Climate risk First Street
- Flood 1/10 Low FEMA zone X (unshaded) · 0% chance over 30 yrs
- Wildfire 1/10 Low
- Heat 7/10 Severe 7 d/yr ≥110°F today · 19 d/yr by 30 yrs out
- Wind 4/10 Moderate 9% chance of damaging wind over 30 yrs
- Air quality 2/10 Low 1 unhealthy d/yr today · 1 by 30 yrs out
Nearby sold comps map
Loading sold comps map…
Walkable amenities ~0.75 mi
Loading nearby amenities…
Taxation est. · year 1
- Rental income
- $16,967
- − Mortgage interest
- −$5,321
- − Property taxes
- −$688
- − Insurance
- −$475
- − Repairs & maintenance
- −$1,357
- − Management
- −$1,357
- − Depreciation
- −$2,764
- Taxable income
- $5,004
- Est. tax owed @ 24.0%
- −$1,201
- After-tax cash flow
- $5,062/yr
For passive investors: Depreciation is non-cash, so a rental often shows a tax loss while cash-flowing — sheltering income. Rental losses are passive: they offset passive income freely, and up to $25,000/yr can offset ordinary (W-2) income if you actively participate and your MAGI is under $100k (phasing out to $0 by $150k); unused losses carry forward. On sale, claimed depreciation is recaptured at up to 25%, and gains may owe capital-gains tax (a 1031 exchange can defer both). Figures are a year-1 estimate at your 24.0% rate — not tax advice; consult a CPA.
Schools (NCES district)
- District
- Little Rock School District
- NCES district ID
- 0509000
- Math proficiency
- 23% ▼ -12.00%
- Reading proficiency
- 26% ▼ -8.00%
- Median HH income
- $43,346
- Composite
- 21.0/100
- National rank
- #8457
- State rank
- #183 of 238 in AR
Livability — Little Rock
- Score
- 73/100
- State rank
- #22
- US rank
- #5295
Category grades
Schools grade is shown separately in the Schools card above.
Census & demographics
- Census place
- Little Rock, AR
- County
- Pulaski County · 372,764 people
- City population
- 218,896
- Metro
- Little Rock-North Little Rock-Conway, AR
- Population (ZIP)
- 22,667
- Household income
- $52,132
- Rent vs Own
- Severe rent burden
- 623.0
Population outlook (Pulaski County) Hauer SSP2
- Today (2025)
- 415,378 people
- By 2030
- 423,720 · +2.0%
- By 2040
- 435,182 · +4.8%
- By 2050
- 440,904 · +6.1%
- By 2075
- 445,521 · +7.3%
- By 2100
- 419,173 · +0.9%
Race, ethnicity, and origin ACS 2023
- Neighborhood character
- Diverse neighborhood (Simpson 0.59)
- Race & ethnicity
- Black 48% White 43% Two or more races 6% Hispanic / Latino 5%
- Hispanic origin (detail)
- Mexican 4%
- Common ancestry
- Iranian 1% Italian 1% Lithuanian 1%
- Foreign-born
- 1% · Canada
- Languages at home
- 94% English-only · Spanish 5%
Political lean MEDSL · Pulaski
- 2024 margin
- Strong D (+22.1) · D 59.8% · R 37.7% · Other 2.5%
- 2008→2024 swing
- +10.6pp toward D · 2008: 11.6pp · 2024: 22.1pp
- All cycles
- 2024: D+22.1 2020: D+22.5 2016: D+17.9 2012: D+11.4 2008: D+11.6
Not yet ingested
- Civics
- —
Market trends
- HPI YoY
- ▼ -88.64%
- Current HPI
- 158.3601
- Rent YoY
- ▲ 3.36%
- Metro
- Little Rock-North Little Rock-Conway, AR
- State GDP YoY
- ▲ 3.80%
- F500 in state
- 10
Industry mix (Fortune 500 HQ in AR)
| Industry | F500 HQs | Revenue |
|---|---|---|
| Retail | 1 | $681B |
|
||
| Food / Agriculture | 1 | $53B |
|
||
| Retail / Energy | 1 | $22B |
|
||
| Transportation / Logistics | 1 | $12B |
|
||
| Energy | 1 | $4B |
|
||
Price history
2 events — show timeline
- 2026-06-12 Pending — CARMLS
- 2026-05-20 Listed $95,000 CARMLS
Property tax history
-0.5%/yrLatest (2025): $688 · +4.3% YoY. Source: county tax records.
Cash-flow waterfall
monthlySold comps — $/sqft
last 12 mo · ≤1 miLoading sold comps…