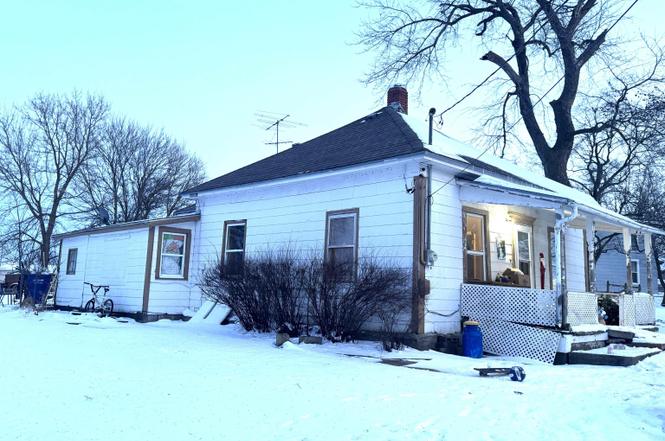
830 Locust St · Nortonville, KS
Flood risk 1/10 · Minimal
- FEMA flood zone
- X (unshaded)
- Chance of flooding over 30 yrs
- 0.0%
- Est. flood insurance / yr
- $507 – $1,088
Fire risk 1/10 · Minimal
- Est. fire insurance / yr
- $1,154 – $2,142
Heat risk 4/10 · Minor
- Hot days now (above 108°F)
- 7 days/yr
- Hot days in 30 yrs
- 17 days/yr
Wind risk 2/10 · Minimal
- Chance of severe wind over 30 yrs
- —
Air-quality risk 2/10 · Minimal
- Unhealthy air days now
- 1 days/yr
- Unhealthy air days in 30 yrs
- 1 days/yr
Risk factors via First Street. Map © Google.
Why this score? — see what drove the A- grade
The composite is a weighted blend of 9 inputs, each scored 0–100. Each bar is that input's sub-score; the figure is the points it added to the 100-point composite (weight × sub-score).
- Cash flow +30.0/30.0
- 1% rule +10.0/10.0
- DSCR +10.0/10.0
- Appreciation +10.0/10.0
- ARV discount +7.5/15.0
- Schools +4.0/10.0
- Livability +3.6/5.0
- Rent growth +2.5/5.0
- Condition / age +2.5/5.0
$50,000
🖨 Deal sheet (PDF) 📄 Offer letter ✓ Due diligence
Listing remarks
Set on a spacious lot in a quiet small town, the character of this cozy home is ready for a thoughtful revival. In true bungalow style, intimate rooms and a practical layout are the bones of this fixer upper. The large lot surrounding the home adds to its appeal, offering room for gardens, a cozy patio, or simply space to enjoy quiet mornings and peaceful evenings. Located in a friendly small town this property offers a slower pace with great schools and community life. Here's your chance to restore original charm, add modern comforts, bringing life to a beloved bungalow making it your own, add to rental portfolio or flip project for new owners to create memories!
Key facts
- Spacious lot
- Bungalow style
- Cozy patio
Tags
Property features AI
Exterior
- Parking: Attached or detached garage with 1 garage space
- Home design: Single-family residence; Single house; Residential property
- Exterior features: Lot approximately 0.34 acres; Located in the Nortonville subdivision
Interior
- Bathrooms: One full bathroom
- Interior features: 1 full bathroom
Neighborhood map
What this means for you Summary
Snapshot
- This is a 2-bed/1.0-bath single-family listed at $50k.
Deal economics
- At list price, monthly cash flow is $347 ($4k/yr) — positive.
- The deal already cash-flows at list — no discount required.
- Meets the 1% rule at list price ($888 rent vs $50k).
- Recommended offer: $44k (12.0% below list) — sets the bar for market timing.
Location & tenants
- Location reads 71/100 on livability (#129 in KS) — a middle-class / working-renter tenant base. Strengths: crime A+, cost of living A+, housing A+; Watch: amenities F, commute F.
- Jefferson County North (rural): math 42% / reading 44% proficiency, ranked #34 of 280 in KS (top 12%) — families likely to look elsewhere, expect single-tenant / working-renter base with shorter leases.
- Zoned schools: Jefferson Co North High (math 30% / reading 50%, grade F, #20 of 327 statewide, top 6%, 115 students, 35% FRL).
- Market conditions: 2 active listings in the ZIP; 61 units permitted in Jefferson County in 2024 (0 in 5+ unit buildings).
Forward outlook
- In year one you build about $5k of equity ($346 loan paydown + $5k appreciation (10.0% local appreciation)).
- Jefferson County population projected at -12% by 2050 — secular population decline; favor cash flow + early exit over multi-decade hold.
- At projected returns (10.0% appreciation + 3.0% rent growth), your $14k cash investment doubles in ~2 years — after that, you're playing with house money.
- By year 6, paydown + projected appreciation supports a ~$31k cash-out refi (75% LTV) — recoverable capital for the next deal without selling this one.
Negotiation context
- It's been on market 142 days — a 12% lower offer ($44k) is reasonable based on typical stale-listing flexibility.
Risks & watch-outs
- Watch-outs: built in 1920 — expect roof / HVAC / electrical / plumbing capex.
Questions for the listing agent
- It's been on market 142 days. Have you received any prior offers? Is the seller open to a 12% concession, seller financing, or rate buy-down credit?
- Built in 1920 — when were the roof, HVAC, electrical panel, plumbing, and water heater last replaced?
- Why hasn't it sold? Are there any deal-killer items the seller is aware of (foundation, flood, title, zoning, code violations)?
- Is there a deadline driving the sale (1031 exchange, divorce, estate, relocation)? That informs how much negotiation room exists.
- Schools are D-rated, which usually means shorter tenancies and higher turnover. Who's the typical renter profile here, and what's been the actual vacancy rate?
- What's the average days-on-market for RENTAL listings here right now (not sales)? A rising rental-DOM trend means longer vacancies and softer asking-rent achievability than the comps imply.
- What's the recent tenant-quality profile in this submarket — average credit score on applications, eviction rate, late-payment / NSF rate, and stable-employment percentage? A property-management company in the area should have these aggregated.
- How much new for-sale + rental construction is in the pipeline within 1–3 miles? Heavy new supply typically softens prices + rents 12–24 months out; constrained supply supports both.
Investment metrics
- 1% rule
- 1.78% ✓
- Cap rate
- 14.62%
- Cash-on-cash
- 29.75%
- DSCR
- 2.32
- GRM
- 4.7
CMA / ARV
- ARV (on-the-fly)
- $106,056
- Comps found
- 2
Show comp detail 2 sales within ~0.75 mi
| Address | Dist | Beds/Ba | Sqft | Sold | Price | $/sf | Match |
|---|---|---|---|---|---|---|---|
| 409 Elm St | 0.34mi | 2/1.0 | 1,014 (+3%) | 7mo | $110,000 | $108 | 73 |
| 220 Locust St | 0.46mi | 2/1.0 | 888 (-10%) | 23mo | $32,500 | $37 | 43 |
Match score weights: distance 35% · size 25% · config 20% · recency 20%. Top-matched comps best support the ARV.
Projected returns pro-forma
10.0% appreciation · 3.0% rent growth · sell at horizon
- IRR
- 46.9%
- Equity multiple
- 4.53×
- Total profit
- $49,359
- Equity at exit
- $45,044
- IRR
- 40.8%
- Equity multiple
- 10.14×
- Total profit
- $128,007
- Equity at exit
- $97,139
Cash invested: $14,000 (down + closing). Projections, not guarantees.
Landlord ↔ Tenant lean methodology
- Overall (STATE)
- 83 Strongly Landlord-Friendly
- State Kansas
- 83 Strongly Landlord-Friendly · R+10
- County
- — inherits STATE
- City
- — inherits STATE
ZIP-level market 66060
- Home prices YoY
- 4.9%
- Active inventory
- 2
- Price-to-rent
- 4.7×
Monthly cashflow live
- Estimated rent
- $888 medium interval (Pro) →
- Mortgage (P&I)
- −$262
- Tax from tax record
- −$72 /mo · $860/yr
- Insurance
- −$21
- HOA
- −$0
- Vacancy / Maint / Mgmt
- −$187
- Net cashflow
- $347
Break-even live
Sensitivity live
| Price | -10% $375 | -5% $361 | +0% $347 | +5% $333 | +10% $319 |
|---|---|---|---|---|---|
| Rent | -10% $277 | -5% $312 | +0% $347 | +5% $382 | +10% $417 |
| Rate | -1.0pp $372 | -0.5pp $360 | base $347 | +0.5pp $334 | +1.0pp $321 |
UW: 25.0% down · 7.5% · 30yr · 1.5% tax · 5.0% vac · 8.0% maint · 8.0% mgmt
Financing live
Cash to close
- Down payment
- $12,500
- Closing costs
- $1,500
- Reserves months
- —
- Total cash needed
- —
Loan-product check · same deal, 3 products live
Conventional
25% down · 7.5% · 30yr
- Down + closing
- —
- Monthly P&I
- —
- Monthly cashflow
- —
- DSCR
- —
- Eligible?
- —
Personal DTI + credit; lowest rate.
DSCR
20% down · 8.5% · 30yr
- Down + closing
- —
- Monthly P&I
- —
- Monthly cashflow
- —
- DSCR
- —
- Eligible?
- —
No personal income docs; deal must DSCR.
Hard money
10% down · 12.0% · 12mo
- Down + closing
- —
- Monthly P&I
- —
- Monthly cashflow
- —
- DSCR
- —
- Eligible?
- —
Short-term bridge; refi at stabilization.
Listing history 24 events
-
2026-06-19days on market $50,000 Active 142 DOM
-
2026-06-18days on market $50,000 Active 141 DOM
-
2026-06-17days on market $50,000 Active 140 DOM
-
2026-06-16days on market $50,000 Active 139 DOM
-
2026-06-15days on market $50,000 Active 138 DOM
-
2026-06-14days on market $50,000 Active 136 DOM
-
2026-06-12days on market $50,000 Active 135 DOM
-
2026-06-09days on market $50,000 Active 132 DOM
-
2026-06-08days on market $50,000 Active 131 DOM
-
2026-06-07days on market $50,000 Active 130 DOM
-
2026-06-05days on market $50,000 Active 128 DOM
-
2026-06-04days on market $50,000 Active 126 DOM
-
2026-06-02days on market $50,000 Active 125 DOM
-
2026-06-01days on market $50,000 Active 124 DOM
-
2026-05-31days on market $50,000 Active 123 DOM
-
2026-05-31days on market $50,000 Active 122 DOM
-
2026-04-28price $50,000
-
2026-03-05price $55,000
-
2026-02-16price $60,000
-
2026-01-28$64,000 Active
-
2013-07-02soldstatus
-
2007-08-01soldstatus $45,000
-
2003-10-01soldstatus $12,000
-
2003-07-01soldstatus $12,000
ⓘ Source: listings_history table (triggers on properties + properties_extension) + one-shot
backfill from property_details.listing_events for pre-trigger history.
Tax reassessment forecast KS · Resets to sale price
- Current annual tax
- $860 · $72/mo
- Projected year-2 tax
- $860 · $72/mo
- Expected delta
- $0/yr ($0/mo · 0.0%)
ⓘ Screening estimate from a state-policy table — verify with the county assessor before closing.
Climate risk First Street
- Flood 1/10 Low FEMA zone X (unshaded) · 0% chance over 30 yrs
- Wildfire 1/10 Low
- Heat 4/10 Moderate 7 d/yr ≥108°F today · 17 d/yr by 30 yrs out
- Wind 2/10 Low
- Air quality 2/10 Low 1 unhealthy d/yr today · 1 by 30 yrs out
Nearby sold comps map
Loading sold comps map…
Walkable amenities ~0.75 mi
Loading nearby amenities…
Taxation est. · year 1
- Rental income
- $10,660
- − Mortgage interest
- −$2,801
- − Property taxes
- −$860
- − Insurance
- −$250
- − Repairs & maintenance
- −$853
- − Management
- −$853
- − Depreciation
- −$1,455
- Taxable income
- $3,590
- Est. tax owed @ 24.0%
- −$862
- After-tax cash flow
- $3,304/yr
For passive investors: Depreciation is non-cash, so a rental often shows a tax loss while cash-flowing — sheltering income. Rental losses are passive: they offset passive income freely, and up to $25,000/yr can offset ordinary (W-2) income if you actively participate and your MAGI is under $100k (phasing out to $0 by $150k); unused losses carry forward. On sale, claimed depreciation is recaptured at up to 25%, and gains may owe capital-gains tax (a 1031 exchange can defer both). Figures are a year-1 estimate at your 24.0% rate — not tax advice; consult a CPA.
Schools (NCES district)
- District
- Jefferson County North
- NCES district ID
- 2013020
- Math proficiency
- 42% ▼ -4.00%
- Reading proficiency
- 44% ▬ 0.00%
- Median HH income
- $54,710
- Composite
- 39.73/100
- National rank
- #8001
- State rank
- #34 of 280 in KS
Livability — Nortonville
- Score
- 71/100
- State rank
- #129
- US rank
- #6597
Category grades
Schools grade is shown separately in the Schools card above.
Census & demographics
- Census place
- Nortonville, KS
- City population
- 1,255
- Population (ZIP)
- 1,255
Population outlook (Jefferson County) Hauer SSP2
- Today (2025)
- 18,534 people
- By 2030
- 18,165 · -2.0%
- By 2040
- 17,247 · -6.9%
- By 2050
- 16,257 · -12.3%
- By 2075
- 14,493 · -21.8%
- By 2100
- 12,298 · -33.6%
Race, ethnicity, and origin ACS 2023
- Neighborhood character
- Predominantly White (98%)
- Race & ethnicity
- White 98% Two or more races 2%
- Common ancestry
- Lithuanian 4% Iranian 3% Danish 2%
- Foreign-born
- 0%
- Languages at home
- 96% English-only · Spanish 4%
Political lean MEDSL · Jefferson
- 2024 margin
- Solid R (+36.9) · D 30.5% · R 67.4% · Other 2.0%
- 2008→2024 swing
- -18.2pp toward R · 2008: -18.7pp · 2024: -36.9pp
- All cycles
- 2024: R+36.9 2020: R+32.2 2016: R+32.3 2012: R+22.8 2008: R+18.7
Not yet ingested
- Civics
- —
Market trends
- HPI YoY
- ▲ 11.68%
- Current HPI
- 248.6445
- Rent YoY
- —
- Metro
- —
- State GDP YoY
- —
- F500 in state
- 0
Price history
+316.7% since first listed8 events — show timeline
- 2026-04-28 Price Changed $50,000 Sunflower MLS as distributed by MLS GRID
- 2026-03-05 Price Changed $55,000 Sunflower MLS as distributed by MLS GRID
- 2026-02-16 Price Changed $60,000 Sunflower MLS as distributed by MLS GRID
- 2026-01-28 Listed $64,000 Sunflower MLS as distributed by MLS GRID
- 2013-07-02 Sold (Public Records) — Public Records
- 2007-08-01 Sold (Public Records) $45,000 Public Records
- 2003-10-01 Sold (Public Records) $12,000 Public Records
- 2003-07-01 Sold (Public Records) $12,000 Public Records
Property tax history
+8.0%/yrLatest (2025): $860 · +11.0% YoY. Source: county tax records.
Cash-flow waterfall
monthlySold comps — $/sqft
last 12 mo · ≤1 miLoading sold comps…