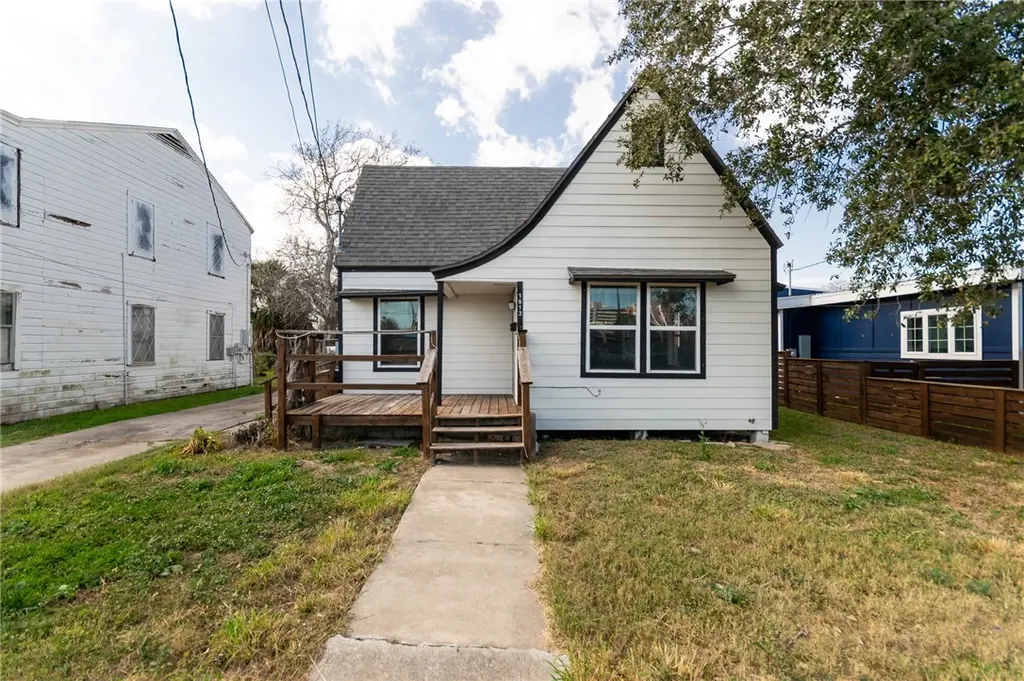
1613 6th St · Corpus Christi, TX
Flood risk 1/10 · Minimal
- FEMA flood zone
- X (unshaded)
- Chance of flooding over 30 yrs
- 0.0%
- Est. flood insurance / yr
- $507 – $1,088
Fire risk 1/10 · Minimal
- Est. fire insurance / yr
- $1,222 – $2,270
Heat risk 10/10 · Severe
- Hot days now (above 107°F)
- 7 days/yr
- Hot days in 30 yrs
- 26 days/yr
Wind risk 9/10 · Severe
- Chance of severe wind over 30 yrs
- 99.0%
Air-quality risk 1/10 · Minimal
- Unhealthy air days now
- 0 days/yr
- Unhealthy air days in 30 yrs
- 0 days/yr
Risk factors via First Street. Map © Google.
Why this score? — see what drove the C+ grade
The composite is a weighted blend of 9 inputs, each scored 0–100. Each bar is that input's sub-score; the figure is the points it added to the 100-point composite (weight × sub-score).
- Cash flow +22.1/30.0
- ARV discount +15.0/15.0
- DSCR +7.1/10.0
- 1% rule +6.1/10.0
- Livability +3.9/5.0
- Rent growth +3.0/5.0
- Schools +2.8/10.0
- Condition / age +2.5/5.0
- Appreciation +0.0/10.0
$149,900
🖨 Deal sheet (PDF) 📄 Offer letter ✓ Due diligence
Listing remarks MLS
Check out this updated 3-bedroom, 2-bath home offering over 1,600 square feet of updated living space just minutes from Ocean Drive. This move-in ready property features a split-bedroom layout for added privacy, recent flooring throughout, and abundant natural light from updated windows. The roof was replaced in 2022, giving you peace of mind for years to come. Some images in this listing have been virtually staged.
Key facts
- Split-bedroom layout
- Recent flooring
- Updated windows
Tags
Neighborhood map
What this means for you Summary
Snapshot
- This is a 3-bed/2.0-bath single-family listed at $150k.
Deal economics
- At list price, monthly cash flow is $240 ($3k/yr) — positive.
- The deal already cash-flows at list — no discount required.
- Meets the 1% rule at list price ($2k rent vs $150k).
- Recommended offer: $132k (12.0% below list) — sets the bar for market timing.
- Cap rate 8.2% vs local median 3.6% in Corpus Christi — top-decile yield for the area; either an underpriced asset or a hidden risk that comps aren't pricing in. Stress-test before assuming the spread holds.
Location & tenants
- Location reads 78/100 on livability (#66 in TX, #2,404 nationally) — a middle-class / working-renter tenant base. Strengths: commute A+, cost of living A+, housing A+; Watch: crime F.
- Corpus Christi ISD (urban): math 31% / reading 35% proficiency, ranked #562 of 826 in TX (top 68%) — families likely to look elsewhere, expect single-tenant / working-renter base with shorter leases; 63% free/reduced lunch — lower-income household profile, screen leases tightly.
- Zoned schools: Windsor Park G/T (math 85% / reading 90%, grade A+, #6 of 4,322 statewide, top 0%, 609 students, 29% FRL); Adkins Middle (math 40% / reading 39%, grade F, #660 of 1,662 statewide, top 41%, 956 students, 48% FRL); Ray H S (math 49% / reading 47%, grade D, #571 of 1,632 statewide, top 36%, 1,640 students, 69% FRL).
- Zoned-school proficiency averages 58% at this address vs 33% district-wide (+25 pts) — the actual schools serving this property are materially stronger than the Corpus Christi ISD average implies; a family-tenant draw the district grade alone would hide.
- Market conditions: Rents rising (+1.9%/yr); 146 active listings in the ZIP; 23 comparable units currently listed for rent nearby; rentals lingering (median 45d on market — plan ~5-8 weeks vacancy on turnover, expect pricing pressure); 57% of comp listings sitting > 30 days — soft ceiling on asking rent; 1,397 units permitted in Nueces County in 2024 (47 in 5+ unit buildings).
Forward outlook
- Local home prices are declining (-3.0%/yr); year-one equity from $1k of loan paydown is wiped out by about $4k of value loss. Plan a longer hold.
- Nueces County population projected at +36% by 2050 — long-run rental-demand tailwind backs the buy-and-hold thesis.
Negotiation context
- It's been on market 129 days — a 12% lower offer ($132k) is reasonable based on typical stale-listing flexibility.
- 3 sale attempts since 4y ago; this cycle's ask has dropped $50k (25%) from the opening price — seller is motivated, your offer sets the floor, not the list.
- Current owner paid $40k; list at $150k implies a 275% gain — meaningful room to come down on a strong offer.
Risks & watch-outs
- Watch-outs: built in 1930 — expect roof / HVAC / electrical / plumbing capex.
- Climate carrying-cost: severe wind risk, 99% chance of damaging wind over 30y; extreme-heat days projected 7→26/yr by 2055 (HVAC capex compounding) — expect insurance premiums to compound above CPI over the hold.
Questions for the listing agent
- It's been on market 129 days. Have you received any prior offers? Is the seller open to a 12% concession, seller financing, or rate buy-down credit?
- Built in 1930 — when were the roof, HVAC, electrical panel, plumbing, and water heater last replaced?
- Why hasn't it sold? Are there any deal-killer items the seller is aware of (foundation, flood, title, zoning, code violations)?
- Is there a deadline driving the sale (1031 exchange, divorce, estate, relocation)? That informs how much negotiation room exists.
- Crime grade is F in this area — have there been break-ins, vandalism, or insurance claims at this property in the last 3 years? What carrier currently insures it and at what premium?
- What's the average days-on-market for RENTAL listings here right now (not sales)? A rising rental-DOM trend means longer vacancies and softer asking-rent achievability than the comps imply.
- What's the recent tenant-quality profile in this submarket — average credit score on applications, eviction rate, late-payment / NSF rate, and stable-employment percentage? A property-management company in the area should have these aggregated.
- How much new for-sale + rental construction is in the pipeline within 1–3 miles? Heavy new supply typically softens prices + rents 12–24 months out; constrained supply supports both.
Investment metrics
- 1% rule
- 1.11% ✓
- Cap rate
- 8.22%
- Cash-on-cash
- 6.87%
- DSCR
- 1.31
- GRM
- 7.5
CMA / ARV
- ARV (median comp)
- $210,768
- List price
- $149,900
- Delta
- -24.13%
- Verdict
- UNDERPRICED
- Comps
- 20 within 1.0 mi
Show comp detail 12 sales within ~0.75 mi
| Address | Dist | Beds/Ba | Sqft | Sold | Price | $/sf | Match |
|---|---|---|---|---|---|---|---|
| 3301 Willies Landing Dr | 0.38mi | 3/2.5 | 1,700 (+1%) | 4mo | $321,757 | $189 | 76 |
| 3321 Willies Landing Dr | 0.38mi | 3/2.5 | 1,700 (+1%) | 7mo | $305,642 | $180 | 74 |
| 406 Naples St | 0.35mi | 3/2.0 | 1,731 (+2%) | 10mo | $175,000 | $101 | 72 |
| 331 Cole | 0.25mi | 3/2.0 | 1,557 (-8%) | 8mo | $225,000 | $145 | 69 |
| 505 Del Mar Blvd | 0.36mi | 4/2.0 (+1) | 1,868 (+10%) | 6mo | $317,000 | $170 | 55 |
| 305 Southern St | 0.52mi | 3/2.0 | 1,538 (-9%) | 8mo | $349,900 | $228 | 54 |
| 1725 15th St | 0.42mi | 3/2.5 | 1,447 (-14%) | 2mo | $190,000 | $131 | 53 |
| 433 Atlantic St | 0.44mi | 2/2.0 (-1) | 1,498 (-11%) | 6mo | $299,990 | $200 | 50 |
| 1437 14th St | 0.49mi | 3/1.0 | 1,525 (-10%) | 9mo | $175,999 | $115 | 49 |
| 441 Atlantic St | 0.45mi | 2/1.0 (-1) | 1,500 (-11%) | 8mo | $299,500 | $200 | 44 |
| 426 Southern St | 0.47mi | 3/1.0 | 1,460 (-14%) | 9mo | $279,900 | $192 | 44 |
| 713 Louisiana Ave | 0.73mi | 3/2.0 | 1,933 (+14%) | 8mo | $249,000 | $129 | 36 |
Match score weights: distance 35% · size 25% · config 20% · recency 20%. Top-matched comps best support the ARV.
Projected returns pro-forma
-3.0% appreciation · 1.87% rent growth · sell at horizon
- IRR
- -7.0%
- Equity multiple
- 0.74×
- Total profit
- $-10,798
- Equity at exit
- $22,351
- IRR
- 1.1%
- Equity multiple
- 1.07×
- Total profit
- $3,011
- Equity at exit
- $12,961
Cash invested: $41,972 (down + closing). Projections, not guarantees.
Landlord ↔ Tenant lean methodology
- Overall (STATE)
- 87 Strongly Landlord-Friendly
- State Texas
- 87 Strongly Landlord-Friendly · R+5
- County
- — inherits STATE
- City
- — inherits STATE
ZIP-level market 78404
- Rents YoY
- 1.9%
- Active inventory
- 146
- Price-to-rent
- 7.5×
Monthly cashflow live
- Estimated rent
- $1,664 high interval (Pro) →
- Mortgage (P&I)
- −$786
- Tax from tax record
- −$226 /mo · $2,709/yr
- Insurance
- −$62
- HOA
- −$0
- Vacancy / Maint / Mgmt
- −$349
- Net cashflow
- $240
Break-even live
Sensitivity live
| Price | -10% $325 | -5% $283 | +0% $240 | +5% $198 | +10% $156 |
|---|---|---|---|---|---|
| Rent | -10% $109 | -5% $175 | +0% $240 | +5% $306 | +10% $372 |
| Rate | -1.0pp $316 | -0.5pp $279 | base $240 | +0.5pp $202 | +1.0pp $162 |
UW: 25.0% down · 7.5% · 30yr · 1.5% tax · 5.0% vac · 8.0% maint · 8.0% mgmt
Financing live
Cash to close
- Down payment
- $37,475
- Closing costs
- $4,497
- Reserves months
- —
- Total cash needed
- —
Loan-product check · same deal, 3 products live
Conventional
25% down · 7.5% · 30yr
- Down + closing
- —
- Monthly P&I
- —
- Monthly cashflow
- —
- DSCR
- —
- Eligible?
- —
Personal DTI + credit; lowest rate.
DSCR
20% down · 8.5% · 30yr
- Down + closing
- —
- Monthly P&I
- —
- Monthly cashflow
- —
- DSCR
- —
- Eligible?
- —
No personal income docs; deal must DSCR.
Hard money
10% down · 12.0% · 12mo
- Down + closing
- —
- Monthly P&I
- —
- Monthly cashflow
- —
- DSCR
- —
- Eligible?
- —
Short-term bridge; refi at stabilization.
Rent comps 23 comps
| Address | Beds | Baths | Sqft | Rent | $/sqft | DOM | Units | Dist |
|---|---|---|---|---|---|---|---|---|
| 426 Palmero St Corpus Christi, TX | 3.0 | 2.0 | 1720 | $1,350 | $0.78 | 45d | 1 | 0.09mi |
| 1539 10th St Unit 1 Corpus Christi, TX | 2.0 | 1.0 | 1944 | $1,225 | $0.63 | 45d | 1 | 0.29mi |
| 1117 Ocean Dr Unit B Corpus Christi, TX | 2.0 | 1.0 | 1543 | $3,000 | $1.94 | 45d | 1 | 0.48mi |
| 417 Southern St Corpus Christi, TX | 4.0 | 2.5 | 2028 | $2,350 | $1.16 | 45d | 1 | 0.49mi |
| 1802 16th St Unit B Corpus Christi, TX | 3.0 | 1.0 | 1575 | $1,000 | $0.63 | 45d | 1 | 0.50mi |
| 522 Hancock Ave Unit 1-319 Corpus Christi, TX | 2.0 | 2.0 | 1133 | $1,625 | $1.43 | 22d | 1 | 0.56mi |
| 813 Furman Ave Apt 1 Corpus Christi, TX | 3.0 | 2.0 | 1430 | $1,475 | $1.03 | 15d | 1 | 0.57mi |
| 522 Hancock Ave Corpus Christi, TX | 1.0–2.0 | 1.0–2.0 | 915 | $2,000 | $2.18 | 15d | 10 | 0.58mi |
| 455 Louisiana Ave Corpus Christi, TX | 2.0 | 1.0 | 1528 | $3,000 | $1.96 | 22d | 1 | 0.58mi |
| 1628 18th St Corpus Christi, TX | 2.0 | 1.0 | 1112 | $1,000 | $0.90 | 45d | 1 | 0.59mi |
| 823 S Water St Corpus Christi, TX | 2.0 | 2.0 | 1243 | $2,000 | $1.61 | 15d | 1 | 0.65mi |
| 802 S Carancahua St Corpus Christi, TX | 2.0 | 1.0–2.0 | 869 | $1,770 | $2.04 | 15d | 68 | 0.67mi |
| 801 S Alameda St Unit A Corpus Christi, TX | 2.0 | 1.0 | 1760 | $900 | $0.51 | 45d | 1 | 0.67mi |
| 1107 14th St Corpus Christi, TX | 4.0 | 1.5 | 1520 | $1,300 | $0.86 | 45d | 1 | 0.69mi |
| 1525 S 19th St Unit B Corpus Christi, TX | 3.0 | 2.0 | 1062 | $2,100 | $1.98 | 15d | 1 | 0.70mi |
| 2622 Cloyde St Corpus Christi, TX | 2.0 | 1.0 | 1693 | $1,150 | $0.68 | 45d | 1 | 0.82mi |
| 1722 Trenton Dr Corpus Christi, TX | 4.0 | 2.0 | 1432 | $2,100 | $1.47 | 15d | 1 | 1.11mi |
| 2901 S Staples St Unit B Corpus Christi, TX | 2.0 | 1.0 | 2236 | $900 | $0.40 | 45d | 1 | 1.14mi |
| 2402 Segrest St Corpus Christi, TX | 2.0 | 1.0 | 1120 | $825 | $0.74 | 22d | 1 | 1.14mi |
| 110 Josephine St Corpus Christi, TX | 3.0 | 2.0 | 1050 | $2,000 | $1.90 | 45d | 1 | 1.20mi |
| 3102 Santa Fe St Corpus Christi, TX | 1.0–2.0 | 1.0–2.0 | 922 | $1,095 | $1.19 | 45d | 1 | 1.23mi |
| 225 Watson St Corpus Christi, TX | 3.0 | 1.0 | 1472 | $1,295 | $0.88 | 45d | 1 | 1.44mi |
| 1405 Annapolis Dr Corpus Christi, TX | 3.0 | 1.5 | 1502 | $2,000 | $1.33 | 15d | 1 | 1.50mi |
Listing history 26 events
-
2026-06-21pricedays on market $149,900 Active 129 DOM
-
2026-06-18days on market $159,900 Active 126 DOM
-
2026-06-17days on market $159,900 Active 125 DOM
-
2026-06-16days on market $159,900 Active 124 DOM
-
2026-06-15days on market $159,900 Active 123 DOM
-
2026-06-14days on market $159,900 Active 121 DOM
-
2026-06-10days on market $159,900 Active 118 DOM
-
2026-06-09days on market $159,900 Active 117 DOM
-
2026-06-08days on market $159,900 Active 116 DOM
-
2026-06-07days on market $159,900 Active 115 DOM
-
2026-06-05days on market $159,900 Active 112 DOM
-
2026-06-03days on market $159,900 Active 111 DOM
-
2026-06-02days on market $159,900 Active 110 DOM
-
2026-06-01days on market $159,900 Active 109 DOM
-
2026-05-31days on market $159,900 Active 108 DOM
-
2026-05-30days on market $159,900 Active 107 DOM
-
2026-05-12price $159,900 419-char remark
Show marketing remark (419 chars)
Check out this updated 3-bedroom, 2-bath home offering over 1,600 square feet of updated living space just minutes from Ocean Drive. This move-in ready property features a split-bedroom layout for added privacy, recent flooring throughout, and abundant natural light from updated windows. The roof was replaced in 2022, giving you peace of mind for years to come. Some images in this listing have been virtually staged.
-
2026-04-15price $165,000 419-char remark
Show marketing remark (419 chars)
Check out this updated 3-bedroom, 2-bath home offering over 1,600 square feet of updated living space just minutes from Ocean Drive. This move-in ready property features a split-bedroom layout for added privacy, recent flooring throughout, and abundant natural light from updated windows. The roof was replaced in 2022, giving you peace of mind for years to come. Some images in this listing have been virtually staged.
-
2026-03-26price $175,000 419-char remark
Show marketing remark (419 chars)
Check out this updated 3-bedroom, 2-bath home offering over 1,600 square feet of updated living space just minutes from Ocean Drive. This move-in ready property features a split-bedroom layout for added privacy, recent flooring throughout, and abundant natural light from updated windows. The roof was replaced in 2022, giving you peace of mind for years to come. Some images in this listing have been virtually staged.
-
2026-03-03price $185,000 419-char remark
Show marketing remark (419 chars)
Check out this updated 3-bedroom, 2-bath home offering over 1,600 square feet of updated living space just minutes from Ocean Drive. This move-in ready property features a split-bedroom layout for added privacy, recent flooring throughout, and abundant natural light from updated windows. The roof was replaced in 2022, giving you peace of mind for years to come. Some images in this listing have been virtually staged.
-
2026-02-12$199,900 Active 419-char remark
Show marketing remark (419 chars)
Check out this updated 3-bedroom, 2-bath home offering over 1,600 square feet of updated living space just minutes from Ocean Drive. This move-in ready property features a split-bedroom layout for added privacy, recent flooring throughout, and abundant natural light from updated windows. The roof was replaced in 2022, giving you peace of mind for years to come. Some images in this listing have been virtually staged.
-
2025-07-02price $239,900
-
2025-05-17$249,900 Active
-
2022-11-16soldstatus
-
2022-06-25$216,000
-
2002-07-26soldstatus $40,000
ⓘ Source: listings_history table (triggers on properties + properties_extension) + one-shot
backfill from property_details.listing_events for pre-trigger history.
Tax reassessment forecast TX · Resets to sale price
- Current annual tax
- $2,709 · $226/mo
- Projected year-2 tax
- $2,743 · $229/mo
- Expected delta
- +$34/yr (+$3/mo · 1.3%)
ⓘ Screening estimate from a state-policy table — verify with the county assessor before closing.
Climate risk First Street
- Flood 1/10 Low FEMA zone X (unshaded) · 0% chance over 30 yrs
- Wildfire 1/10 Low
- Heat 10/10 Extreme 7 d/yr ≥107°F today · 26 d/yr by 30 yrs out
- Wind 9/10 Extreme 99% chance of damaging wind over 30 yrs
- Air quality 1/10 Low 0 unhealthy d/yr today · 0 by 30 yrs out
Nearby sold comps map
Loading sold comps map…
Walkable amenities ~0.75 mi
Loading nearby amenities…
Taxation est. · year 1
- Rental income
- $19,971
- − Mortgage interest
- −$8,397
- − Property taxes
- −$2,709
- − Insurance
- −$750
- − Repairs & maintenance
- −$1,598
- − Management
- −$1,598
- − Depreciation
- −$4,361
- Taxable income
- $560
- Est. tax owed @ 24.0%
- −$134
- After-tax cash flow
- $2,751/yr
For passive investors: Depreciation is non-cash, so a rental often shows a tax loss while cash-flowing — sheltering income. Rental losses are passive: they offset passive income freely, and up to $25,000/yr can offset ordinary (W-2) income if you actively participate and your MAGI is under $100k (phasing out to $0 by $150k); unused losses carry forward. On sale, claimed depreciation is recaptured at up to 25%, and gains may owe capital-gains tax (a 1031 exchange can defer both). Figures are a year-1 estimate at your 24.0% rate — not tax advice; consult a CPA.
Schools (NCES district)
- District
- Corpus Christi ISD
- NCES district ID
- 4815270
- Math proficiency
- 31% ▼ -18.00%
- Reading proficiency
- 35% ▼ -7.00%
- Median HH income
- $45,672
- Composite
- 28.27/100
- National rank
- #6793
- State rank
- #562 of 826 in TX
Livability — Corpus Christi
- Score
- 78/100
- State rank
- #66
- US rank
- #2404
Category grades
Schools grade is shown separately in the Schools card above.
Census & demographics
- Census place
- Corpus Christi, TX
- County
- Nueces County · 296,836 people
- City population
- 296,836
- Metro
- Corpus Christi, TX
- Population (ZIP)
- 12,635
- Household income
- $61,280
- Rent vs Own
- Severe rent burden
- 596.0
Population outlook (Nueces County) Hauer SSP2
- Today (2025)
- 418,037 people
- By 2030
- 447,123 · +7.0%
- By 2040
- 505,911 · +21.0%
- By 2050
- 567,522 · +35.8%
- By 2075
- 729,686 · +74.6%
- By 2100
- 847,087 · +102.6%
Race, ethnicity, and origin ACS 2023
- Neighborhood character
- Majority Hispanic (62%)
- Race & ethnicity
- Hispanic / Latino 62% White 32% Two or more races 29% Black 4%
- Hispanic origin (detail)
- Mexican 56%
- Common ancestry
- Slovak 3% Italian 2% Lithuanian 1%
- Foreign-born
- 9% · Canada
- Languages at home
- 61% English-only · Spanish 39%
Political lean MEDSL · Nueces
- 2024 margin
- R (+11.5) · D 43.8% · R 55.3%
- 2008→2024 swing
- -7.1pp toward R · 2008: -4.4pp · 2024: -11.5pp
- All cycles
- 2024: R+11.5 2020: R+2.9 2016: R+1.5 2012: R+3.2 2008: R+4.4
Not yet ingested
- Civics
- —
Market trends
- HPI YoY
- ▼ -211.10%
- Current HPI
- 177.4759
- Rent YoY
- ▲ 1.87%
- Metro
- Corpus Christi, TX
- State GDP YoY
- ▲ 3.95%
- F500 in state
- 110
Industry mix (Fortune 500 HQ in TX)
| Industry | F500 HQs | Revenue |
|---|---|---|
| Energy | 16 | $1,198B |
|
||
| Technology | 5 | $198B |
|
||
| Engineering / Construction | 4 | $72B |
|
||
| Energy Services | 3 | $60B |
|
||
| Utilities | 3 | $41B |
|
||
| Healthcare | 2 | $330B |
|
||
Price history
+299.8% since first listed10 events — show timeline
- 2026-05-12 Price Changed $159,900 CBMLS
- 2026-04-15 Price Changed $165,000 CBMLS
- 2026-03-26 Price Changed $175,000 CBMLS
- 2026-03-03 Price Changed $185,000 CBMLS
- 2026-02-12 Listed $199,900 CBMLS
- 2025-07-02 Price Changed $239,900 CBMLS
- 2025-05-17 Listed $249,900 CBMLS
- 2022-11-16 Sold (Public Records) — Public Records
- 2022-06-25 Listed $216,000 CBMLS
- 2002-07-26 Sold (Public Records) $40,000 Public Records
Property tax history
+6.3%/yrLatest (2025): $2,709 · +22.1% YoY. Source: county tax records.
Cash-flow waterfall
monthlySold comps — $/sqft
last 12 mo · ≤1 miLoading sold comps…