 🏷️ Likely Rental
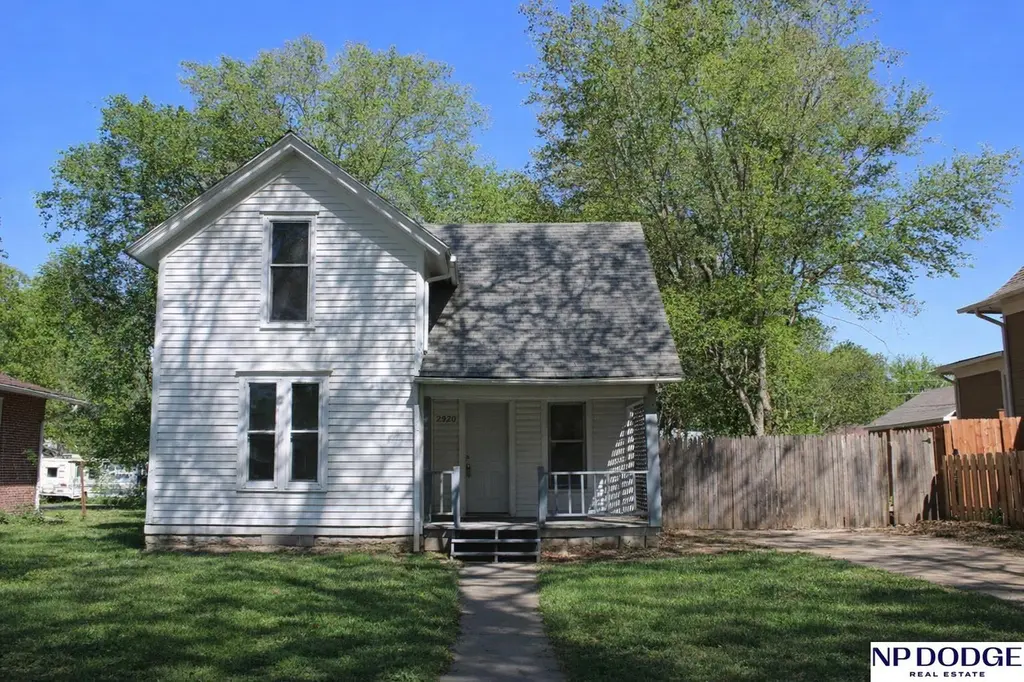
2932 N 50th St · Lincoln, NE
Flood risk 1/10 · Minimal
- FEMA flood zone
- X (unshaded)
- Chance of flooding over 30 yrs
- 0.0%
- Est. flood insurance / yr
- $473 – $860
Fire risk 2/10 · Minimal
- Est. fire insurance / yr
- $1,161 – $2,155
Heat risk 3/10 · Minor
- Hot days now (above 104°F)
- 7 days/yr
- Hot days in 30 yrs
- 16 days/yr
Wind risk 2/10 · Minimal
- Chance of severe wind over 30 yrs
- —
Air-quality risk 1/10 · Minimal
- Unhealthy air days now
- 0 days/yr
- Unhealthy air days in 30 yrs
- 0 days/yr
Risk factors via First Street. Map © Google.
Why this score? — see what drove the C- grade
The composite is a weighted blend of 9 inputs, each scored 0–100. Each bar is that input's sub-score; the figure is the points it added to the 100-point composite (weight × sub-score).
- ARV discount +15.0/15.0
- Cash flow +14.2/30.0
- Schools +4.4/10.0
- DSCR +4.3/10.0
- Livability +4.2/5.0
- 1% rule +4.0/10.0
- Rent growth +2.6/5.0
- Condition / age +2.5/5.0
- Appreciation +0.0/10.0
$140,000
🖨 Deal sheet (PDF) 📄 Offer letter ✓ Due diligence
Listing remarks
1.5-Story Near Wesleyan University Just blocks from campus, this updated home is move-in ready. The exterior needs a lot of love and has been priced to reflect that. Fresh interior paint, new countertops, and updated flooring, this home features 4 bedrooms, 1.5 baths, and a spacious fenced backyard with alley access. Previously leased at $975/month before improvements, this property is a smart opportunity with plenty of potential. To be sold AS-IS and will be part of a 1031 exchange. Seller prefers Charter Title.
Key facts
- Alley access
- Updated flooring
- 7,107 sq ft lot
Tags
Property features AI
Exterior
- Parking: No garage
- Utilities: Public water; Public sewer
- Home design: Single family residence; One and one-half stories; Built in 1920; Not new / not a model
- Construction: Block foundation; Composition roof
- Exterior features: Front porch; Full privacy fencing; Alley access; Lot up to 1/4 acre (approx. 140 x 50)
Interior
- Kitchen: Range; Refrigerator; Dishwasher
- Bedrooms: Master bedroom on main floor (13 x 13); Additional bedrooms on 2nd floor
- Flooring: Carpet; Vinyl
- Bathrooms: Two bathrooms total — one full and one half; one on the main level
- Heating & cooling: Natural gas heating with forced air and radiant components; Central air and window unit(s) for cooling
- Interior features: Ceiling fan(s)
Neighborhood map
What this means for you Summary
Snapshot
- This is a 3-bed/2.0-bath single-family listed at $140k.
Deal economics
- At list price, monthly cash flow is $23 ($275/yr) — positive.
- The deal already cash-flows at list — no discount required.
- To meet the 1% rule (rent ≥ 1% of price), the offer needs to be $126k (9.8% below list).
- Recommended offer: $126k (9.8% below list) — sets the bar for 1% rule.
- Cap rate 6.5% vs local median 3.0% in Lincoln — top-decile yield for the area; either an underpriced asset or a hidden risk that comps aren't pricing in. Stress-test before assuming the spread holds.
Location & tenants
- Location reads 85/100 on livability (#5 in NE, #545 nationally) — a professional / high-income tenant draw. Strengths: amenities A+, cost of living A+, housing A+; Watch: crime D+.
- Lincoln Public Schools (urban): math 50% / reading 53% proficiency, ranked #59 of 111 in NE (top 53%) — acceptable for families but not a draw, mixed tenant base, ~2y average lease.
- Zoned schools: Huntington Elementary School (math 22% / reading 32%, grade F, #438 of 502 statewide, top 88%, 372 students, 0% FRL); Dawes Middle School (math 32% / reading 38%, grade F, #103 of 128 statewide, top 80%, 405 students, 48% FRL); Lincoln Northeast High School (math 34% / reading 36%, grade F, #207 of 261 statewide, top 79%, 1,812 students, 62% FRL) — zoned schools at 37% FRL track the district average.
- Zoned-school proficiency averages 32% at this address vs 52% district-wide (-19 pts) — the specific schools serving this property underperform the Lincoln Public Schools average; the district grade overstates school quality for this exact location.
- Market conditions: Rents flat; 65 active listings in the ZIP; 29 comparable units currently listed for rent nearby; rentals at typical pace (median 24d on market — plan ~3-4 weeks tenant-placement turnaround); 1,940 units permitted in Lancaster County in 2024 (895 in 5+ unit buildings).
Forward outlook
- Local home prices are declining (-3.0%/yr); year-one equity from $968 of loan paydown is wiped out by about $4k of value loss. Plan a longer hold.
- Lancaster County population projected at +37% by 2050 — long-run rental-demand tailwind backs the buy-and-hold thesis.
Negotiation context
- It's been on market 42 days — a 3% lower offer ($136k) is reasonable based on typical stale-listing flexibility.
- 8 sale attempts since 15y ago with the ask held roughly flat each time — persistent listings suggest the price (not the market) is what's stuck; bring a comps-based counter.
- Current owner paid $71k; list at $140k implies a 97% gain — meaningful room to come down on a strong offer.
Risks & watch-outs
- Watch-outs: built in 1920 — expect roof / HVAC / electrical / plumbing capex.
Questions for the listing agent
- It's been on market 42 days. Have you received any prior offers? Is the seller open to a 10% concession, seller financing, or rate buy-down credit?
- Built in 1920 — when were the roof, HVAC, electrical panel, plumbing, and water heater last replaced?
- Is there a deadline driving the sale (1031 exchange, divorce, estate, relocation)? That informs how much negotiation room exists.
- Schools are A-rated — typically a magnet for longer-tenancy family renters. What's the average tenant stay here, and is there a school-zone premium baked into asking?
- Crime grade is D in this area — have there been break-ins, vandalism, or insurance claims at this property in the last 3 years? What carrier currently insures it and at what premium?
- What's the average days-on-market for RENTAL listings here right now (not sales)? A rising rental-DOM trend means longer vacancies and softer asking-rent achievability than the comps imply.
- What's the recent tenant-quality profile in this submarket — average credit score on applications, eviction rate, late-payment / NSF rate, and stable-employment percentage? A property-management company in the area should have these aggregated.
- How much new for-sale + rental construction is in the pipeline within 1–3 miles? Heavy new supply typically softens prices + rents 12–24 months out; constrained supply supports both.
Investment metrics
- 1% rule
- 0.90% ✗
- Cap rate
- 6.49%
- Cash-on-cash
- 0.70%
- DSCR
- 1.03
- GRM
- 9.2
CMA / ARV
- ARV (median comp)
- $204,429
- List price
- $140,000
- Delta
- -31.52%
- Verdict
- UNDERPRICED
- Comps
- 20 within 1.0 mi
Show comp detail 12 sales within ~0.75 mi
| Address | Dist | Beds/Ba | Sqft | Sold | Price | $/sf | Match |
|---|---|---|---|---|---|---|---|
| 4625 Greenwood St | 0.26mi | 3/2.0 | 1,206 (+1%) | 2mo | $183,000 | $152 | 84 |
| 5125 Greenwood St | 0.13mi | 3/1.0 | 1,120 (-6%) | 6mo | $205,000 | $183 | 75 |
| 5327 Knox St | 0.28mi | 3/1.0 | 1,122 (-6%) | 2mo | $159,000 | $142 | 71 |
| 5140 Judson St | 0.28mi | 2/2.0 (-1) | 1,128 (-5%) | 2mo | $117,500 | $104 | 71 |
| 5035 Knox St | 0.17mi | 3/2.0 | 1,050 (-12%) | 3mo | $194,900 | $186 | 70 |
| 5626 Judson St | 0.46mi | 2/1.5 (-1) | 1,168 (-2%) | 3mo | $223,500 | $191 | 66 |
| 5649 Judson St | 0.47mi | 3/1.0 | 1,138 (-4%) | 3mo | $200,000 | $176 | 64 |
| 5701 Gladstone St | 0.52mi | 2/1.5 (-1) | 1,175 (-1%) | 3mo | $210,000 | $179 | 64 |
| 3418 N 58th St | 0.60mi | 2/2.0 (-1) | 1,175 (-1%) | 6mo | $210,000 | $179 | 60 |
| 5735 Judson St | 0.52mi | 2/1.5 (-1) | 1,128 (-5%) | 2mo | $235,000 | $208 | 58 |
| 5220 Gladstone St | 0.34mi | 2/1.5 (-1) | 1,070 (-10%) | 3mo | $190,000 | $178 | 58 |
| 3225 N 56th St | 0.39mi | 3/2.0 | 1,367 (+15%) | 4mo | $236,000 | $173 | 54 |
Match score weights: distance 35% · size 25% · config 20% · recency 20%. Top-matched comps best support the ARV.
Projected returns pro-forma
-3.0% appreciation · 0.56% rent growth · sell at horizon
- IRR
- -18.0%
- Equity multiple
- 0.38×
- Total profit
- $-24,229
- Equity at exit
- $20,874
- IRR
- -15.8%
- Equity multiple
- 0.21×
- Total profit
- $-30,949
- Equity at exit
- $12,105
Cash invested: $39,200 (down + closing). Projections, not guarantees.
Landlord ↔ Tenant lean methodology
- Overall (STATE)
- 83 Strongly Landlord-Friendly
- State Nebraska
- 83 Strongly Landlord-Friendly · R+13
- County
- — inherits STATE
- City
- — inherits STATE
ZIP-level market 68504
- Rents YoY
- 0.6%
- Active inventory
- 65
- Price-to-rent
- 9.2×
Monthly cashflow live
- Estimated rent
- $1,262 high interval (Pro) →
- Mortgage (P&I)
- −$734
- Tax from tax record
- −$182 /mo · $2,183/yr
- Insurance
- −$58
- HOA
- −$0
- Vacancy / Maint / Mgmt
- −$265
- Net cashflow
- $23
Break-even live
Sensitivity live
| Price | -10% $102 | -5% $63 | +0% $23 | +5% $-17 | +10% $-56 |
|---|---|---|---|---|---|
| Rent | -10% $-77 | -5% $-27 | +0% $23 | +5% $73 | +10% $123 |
| Rate | -1.0pp $93 | -0.5pp $59 | base $23 | +0.5pp $-13 | +1.0pp $-50 |
UW: 25.0% down · 7.5% · 30yr · 1.5% tax · 5.0% vac · 8.0% maint · 8.0% mgmt
Financing live
Cash to close
- Down payment
- $35,000
- Closing costs
- $4,200
- Reserves months
- —
- Total cash needed
- —
Loan-product check · same deal, 3 products live
Conventional
25% down · 7.5% · 30yr
- Down + closing
- —
- Monthly P&I
- —
- Monthly cashflow
- —
- DSCR
- —
- Eligible?
- —
Personal DTI + credit; lowest rate.
DSCR
20% down · 8.5% · 30yr
- Down + closing
- —
- Monthly P&I
- —
- Monthly cashflow
- —
- DSCR
- —
- Eligible?
- —
No personal income docs; deal must DSCR.
Hard money
10% down · 12.0% · 12mo
- Down + closing
- —
- Monthly P&I
- —
- Monthly cashflow
- —
- DSCR
- —
- Eligible?
- —
Short-term bridge; refi at stabilization.
Rent comps 29 comps
| Address | Beds | Baths | Sqft | Rent | $/sqft | DOM | Units | Dist |
|---|---|---|---|---|---|---|---|---|
| 2742 N 48th St Unit 03 Lincoln, NE | 2.0 | 1.0 | 769 | $895 | $1.16 | 46d | 1 | 0.18mi |
| 3202 N 48th St Unit 2 Lincoln, NE | 2.0 | 1.0 | 950 | $1,050 | $1.11 | 23d | 1 | 0.23mi |
| 4602 Saint Paul Ave Unit 3 Lincoln, NE | 4.0 | 1.0 | 1344 | $1,550 | $1.15 | 16d | 1 | 0.32mi |
| 4715 Gladstone St Lincoln, NE | 2.0 | 1.0 | 806 | $1,025 | $1.27 | 16d | 1 | 0.35mi |
| 4711 Gladstone St Lincoln, NE | 2.0 | 1.0 | 806 | $1,025 | $1.27 | 16d | 1 | 0.35mi |
| 2405 N 50th St Apt 4 Lincoln, NE | 2.0 | 1.0 | 740 | $850 | $1.15 | 16d | 1 | 0.38mi |
| 4411 Baldwin Ave Lincoln, NE | 3.0 | 1.0 | 764 | $1,600 | $2.09 | 23d | 1 | 0.48mi |
| 4630 Leighton Ave Lincoln, NE | 2.0 | 1.0–2.0 | 781 | $2,141 | $2.74 | 16d | 21 | 0.49mi |
| 2334 N 44th St Unit 19 Lincoln, NE | 2.0 | 2.0 | 1035 | $1,075 | $1.04 | 23d | 1 | 0.55mi |
| 5301 Benton St Unit 5307 Lincoln, NE | 3.0 | 2.0 | 720 | $1,295 | $1.80 | 46d | 1 | 0.56mi |
| 2635 N 42nd St Apt 2 Lincoln, NE | 2.0 | 1.0 | 700 | $900 | $1.29 | 46d | 1 | 0.60mi |
| 2635 N 42nd St Apt 3 Lincoln, NE | 2.0 | 1.0 | 700 | $900 | $1.29 | 16d | 1 | 0.60mi |
| 3609 N 60th St Unit 7 Lincoln, NE | 2.0 | 1.0 | 724 | $795 | $1.10 | 46d | 1 | 0.79mi |
| 3811 Baldwin Ave Lincoln, NE | 1.0–3.0 | 1.0–2.0 | 1015 | $1,489 | $1.47 | 16d | 14 | 0.85mi |
| 4800 Holdrege St Lincoln, NE | 2.0 | 1.0–2.0 | 806 | $1,625 | $2.01 | 16d | 88 | 0.95mi |
| 4904 Holdrege St Lincoln, NE | 2.0 | 1.0 | 1282 | $1,299 | $1.01 | 46d | 1 | 0.95mi |
| 4529 Holdrege St Lincoln, NE | 3.0 | 2.0 | 1100 | $1,250 | $1.14 | 46d | 1 | 1.03mi |
| 4630 Starr St Unit 4630 Lincoln, NE | 3.0 | 1.0 | 1460 | $1,250 | $0.86 | 46d | 1 | 1.04mi |
| 4910 Dudley St Unit 2 Lincoln, NE | 3.0 | 2.0 | 1073 | $1,250 | $1.16 | 23d | 1 | 1.07mi |
| 2840 N Cotner Blvd Unit 1 Lincoln, NE | 3.0 | 1.0 | 1450 | $1,425 | $0.98 | 46d | 1 | 1.09mi |
| 4650 Orchard St Lincoln, NE | 1.0–2.0 | 1.0 | 742 | $825 | $1.11 | 46d | 1 | 1.13mi |
| 4444 N 60th St Lincoln, NE | 2.0 | 1.0 | 1248 | $1,440 | $1.15 | 16d | 1 | 1.29mi |
| 2701 N 70th St Lincoln, NE | 1.0–2.0 | 1.0–1.5 | 886 | $960 | $1.08 | 16d | 1 | 1.30mi |
| 1025 N 63rd St Lincoln, NE | 1.0–3.0 | 1.0–2.0 | 1157 | $1,590 | $1.37 | 16d | 7 | 1.34mi |
| 2125 Griffith St Lincoln, NE | 3.0 | 1.0 | 1014 | $1,495 | $1.47 | 46d | 1 | 1.37mi |
| 3405 Holdrege St Unit 308 Lincoln, NE | 2.0 | 1.0 | 826 | $995 | $1.20 | 23d | 1 | 1.43mi |
| 3331 Holdrege St Unit 12 Lincoln, NE | 2.0 | 1.0 | 996 | $995 | $1.00 | 46d | 1 | 1.47mi |
| 5101 Vine St Lincoln, NE | 1.0–2.0 | 1.0–2.0 | 886 | $1,370 | $1.55 | 16d | 18 | 1.48mi |
| 6433 Platte Ave Lincoln, NE | 2.0 | 1.0 | 1386 | $1,995 | $1.44 | 23d | 1 | 1.48mi |
Listing history 35 events
-
2026-06-21days on market $140,000 Active 42 DOM
-
2026-06-18days on market $140,000 Active 39 DOM
-
2026-06-17days on market $140,000 Active 38 DOM
-
2026-06-16days on market $140,000 Active 37 DOM
-
2026-06-15days on market $140,000 Active 36 DOM
-
2026-06-14days on market $140,000 Active 34 DOM
-
2026-06-10days on market $140,000 Active 31 DOM
-
2026-06-09days on market $140,000 Active 30 DOM
-
2026-06-08days on market $140,000 Active 29 DOM
-
2026-06-07days on market $140,000 Active 28 DOM
-
2026-06-05days on market $140,000 Active 25 DOM
-
2026-06-03days on market $140,000 Active 24 DOM
-
2026-06-02days on market $140,000 Active 23 DOM
-
2026-06-01days on market $140,000 Active 22 DOM
-
2026-05-31days on market $140,000 Active 21 DOM
-
2026-05-30days on market $140,000 Active 20 DOM
-
2026-05-18status Back On Market 522-char remark
-
2026-05-05status Pending 522-char remark
-
2026-04-27$140,000 New 522-char remark
-
2026-02-18historical
-
2025-12-04$170,000 New
-
2025-08-25historical
-
2025-06-27$160,000 New
-
2025-06-03historical
-
2025-05-15status Active
-
2025-04-16historical
-
2025-03-12price $140,000
-
2025-02-24$150,000 New
-
2024-01-13historical $975
-
2023-12-02$975
-
2011-12-01soldstatus $71,000
-
2011-11-30soldstatus $77,000
-
2011-11-21historical
-
2011-07-22$77,000
-
2006-05-19soldstatus $74,000
ⓘ Source: listings_history table (triggers on properties + properties_extension) + one-shot
backfill from property_details.listing_events for pre-trigger history.
Tax reassessment forecast NE · Resets to sale price
- Current annual tax
- $2,183 · $182/mo
- Projected year-2 tax
- $2,422 · $202/mo
- Expected delta
- +$239/yr (+$20/mo · 10.9%)
ⓘ Screening estimate from a state-policy table — verify with the county assessor before closing.
Climate risk First Street
- Flood 1/10 Low FEMA zone X (unshaded) · 0% chance over 30 yrs
- Wildfire 2/10 Low
- Heat 3/10 Moderate 7 d/yr ≥104°F today · 16 d/yr by 30 yrs out
- Wind 2/10 Low
- Air quality 1/10 Low 0 unhealthy d/yr today · 0 by 30 yrs out
Nearby sold comps map
Loading sold comps map…
Walkable amenities ~0.75 mi
Loading nearby amenities…
Taxation est. · year 1
- Rental income
- $15,150
- − Mortgage interest
- −$7,842
- − Property taxes
- −$2,183
- − Insurance
- −$700
- − Repairs & maintenance
- −$1,212
- − Management
- −$1,212
- − Depreciation
- −$4,073
- Taxable loss
- −$2,072
- Est. tax savings @ 24.0%
- +$497
- After-tax cash flow
- $772/yr
For passive investors: Depreciation is non-cash, so a rental often shows a tax loss while cash-flowing — sheltering income. Rental losses are passive: they offset passive income freely, and up to $25,000/yr can offset ordinary (W-2) income if you actively participate and your MAGI is under $100k (phasing out to $0 by $150k); unused losses carry forward. On sale, claimed depreciation is recaptured at up to 25%, and gains may owe capital-gains tax (a 1031 exchange can defer both). Figures are a year-1 estimate at your 24.0% rate — not tax advice; consult a CPA.
Schools (NCES district)
- District
- Lincoln Public Schools
- NCES district ID
- 3172840
- Math proficiency
- 50% ▼ -6.00%
- Reading proficiency
- 53% ▼ -3.00%
- Median HH income
- $50,273
- Composite
- 44.05/100
- National rank
- #2880
- State rank
- #59 of 111 in NE
Livability — Lincoln
- Score
- 85/100
- State rank
- #5
- US rank
- #545
Category grades
Schools grade is shown separately in the Schools card above.
Census & demographics
- Census place
- Lincoln, NE
- County
- Lancaster County · 291,509 people
- City population
- 291,509
- Metro
- Lincoln, NE
- Population (ZIP)
- 17,278
- Household income
- $56,213
- Rent vs Own
- Severe rent burden
- 1076.0
Population outlook (Lancaster County) Hauer SSP2
- Today (2025)
- 352,806 people
- By 2030
- 377,899 · +7.1%
- By 2040
- 428,582 · +21.5%
- By 2050
- 483,103 · +36.9%
- By 2075
- 632,390 · +79.2%
- By 2100
- 759,513 · +115.3%
Race, ethnicity, and origin ACS 2023
- Neighborhood character
- Predominantly White (71%)
- Race & ethnicity
- White 71% Hispanic / Latino 9% Two or more races 9% Black 7% Asian 5% Native American 1%
- Hispanic origin (detail)
- Mexican 7%
- Common ancestry
- Romanian 4% Lithuanian 2% Portuguese 2%
- Foreign-born
- 10% · Canada, South Korea, Vietnam
- Languages at home
- 86% English-only · Spanish 4% Other Indo-European 4% Arabic 2%
Political lean MEDSL · Lancaster
- 2024 margin
- Toss-up / Even · D 51.4% · R 47.1% · Other 1.5%
- 2008→2024 swing
- -0.7pp no change · 2008: 5.0pp · 2024: 4.3pp
- All cycles
- 2024: D+4.3 2020: D+7.8 2016: D+0.1 2012: R+1.0 2008: D+5.0
Not yet ingested
- Civics
- —
Market trends
- HPI YoY
- ▼ -157.10%
- Current HPI
- 246.8013
- Rent YoY
- ▲ 0.56%
- Metro
- Lincoln, NE
- State GDP YoY
- ▲ 0.68%
- F500 in state
- 2
Industry mix (Fortune 500 HQ in NE)
| Industry | F500 HQs | Revenue |
|---|---|---|
| Conglomerate | 1 | $371B |
|
||
Price history
+89.2% since first listed19 events — show timeline
- 2026-05-18 Relisted — GPRMLS
- 2026-05-05 Pending — GPRMLS
- 2026-04-27 Listed $140,000 GPRMLS
- 2026-02-18 Listing Removed — GPRMLS
- 2025-12-04 Listed $170,000 GPRMLS
- 2025-08-25 Listing Removed — GPRMLS
- 2025-06-27 Listed $160,000 GPRMLS
- 2025-06-03 Listing Removed — GPRMLS
- 2025-05-15 Relisted — GPRMLS
- 2025-04-16 Listing Removed — GPRMLS
- 2025-03-12 Price Changed $140,000 GPRMLS
- 2025-02-24 Listed $150,000 GPRMLS
- 2024-01-13 Rental Removed $975 APPFOLIO
- 2023-12-02 Listed for Rent $975 APPFOLIO
- 2011-12-01 Sold (Public Records) $71,000 Public Records
- 2011-11-30 Sold (MLS) $77,000 GPRMLS
- 2011-11-21 Listing Removed — GPRMLS
- 2011-07-22 Listed $77,000 GPRMLS
- 2006-05-19 Sold (Public Records) $74,000 Public Records
Property tax history
+3.4%/yrLatest (2025): $2,183 · +3.4% YoY. Source: county tax records.
Cash-flow waterfall
monthlySold comps — $/sqft
last 12 mo · ≤1 miLoading sold comps…