110 3rd St · Plainview, TN
Flood risk 1/10 · Minimal
- FEMA flood zone
- X (unshaded)
- Chance of flooding over 30 yrs
- 0.0%
- Est. flood insurance / yr
- $507 – $1,088
Fire risk 6/10 · Moderate
- Est. fire insurance / yr
- $949 – $1,763
Heat risk 5/10 · Moderate
- Hot days now (above 102°F)
- 7 days/yr
- Hot days in 30 yrs
- 19 days/yr
Wind risk 2/10 · Minimal
- Chance of severe wind over 30 yrs
- 1.0%
Air-quality risk 4/10 · Minor
- Unhealthy air days now
- 3 days/yr
- Unhealthy air days in 30 yrs
- 5 days/yr
Risk factors via First Street. Map © Google.
Why this score? — see what drove the C grade
The composite is a weighted blend of 9 inputs, each scored 0–100. Each bar is that input's sub-score; the figure is the points it added to the 100-point composite (weight × sub-score).
- Cash flow +24.2/30.0
- DSCR +7.8/10.0
- ARV discount +7.5/15.0
- 1% rule +6.3/10.0
- Livability +3.0/5.0
- Rent growth +2.5/5.0
- Condition / age +2.5/5.0
- Schools +1.4/10.0
- Appreciation +0.0/10.0
$155,000
🖨 Deal sheet 📄 Offer letter ✓ Due diligence
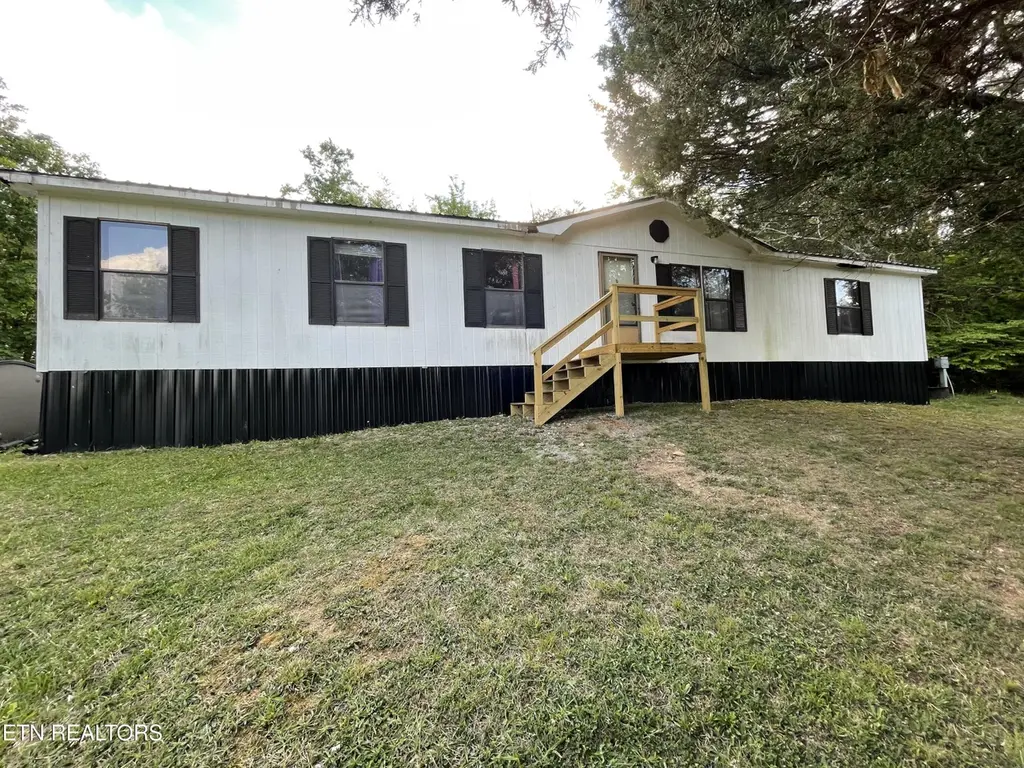
Listing remarks
Welcome home to peaceful living. This home features a new roof, new front deck and new deck boards on the side deck. Sitting on half an acre, you'll have plenty of room to sprawl out and LOW taxes with no city tax. New underpinning and strap down piers were installed. Newer water heater available for new buyer to hook up. Whether a first time buyer, investor or family, this home is ready for you to make it your own.
Key facts
- Low taxes
- New deck boards
- New roof
Tags
Property features AI
Exterior
- Parking: Main level parking
- Utilities: Public sewer
- Home design: Not attached to another unit; Building area reported as 1,536 (owner-provided)
- Construction: Construction materials: Other
- Exterior features: Level and rolling-slope lot; Country and city views; Construction: Other
Interior
- Kitchen: Refrigerator; Self-cleaning oven
- Flooring: Laminate; Carpet
- Bathrooms: 2 full bathrooms
- Heating & cooling: Central heating (Propane and Electric); Central cooling; Ceiling fan(s)
- Interior features: Pantry; 8 total rooms
- Laundry & utility: Washer; Dryer
Neighborhood map
What this means for you Summary
Snapshot
- This is a 3-bed/2.0-bath other listed at $155k.
Deal economics
- At list price, monthly cash flow is $308 ($4k/yr) — positive.
- The deal already cash-flows at list — no discount required.
- Meets the 1% rule at list price ($2k rent vs $155k).
- Recommended offer: $150k (3.0% below list) — sets the bar for market timing.
Location & tenants
- Location reads 60/100 on livability (#265 in TN) — a middle-class / working-renter tenant base. Strengths: crime A+, cost of living A+, housing A+; Watch: employment D+, schools F, amenities F.
- Union County (rural): math 14% / reading 19% proficiency, ranked #127 of 139 in TN (top 91%) — low school quality limits family demand, transient renter base, plan for 1-2y turnover.
- Market conditions: 4 active listings in the ZIP; 1 comparable units currently listed for rent nearby; 134 units permitted in Union County in 2024 (0 in 5+ unit buildings).
- This rent runs 32% of the median local income ($65k/yr) — at the standard rent-burdened threshold; future hikes will face affordability resistance.
Forward outlook
- Local home prices are declining (-3.0%/yr); year-one equity from $1k of loan paydown is wiped out by about $5k of value loss. Plan a longer hold.
- Union County population projected at -12% by 2050 — secular population decline; favor cash flow + early exit over multi-decade hold.
Negotiation context
- It's been on market 36 days — a 3% lower offer ($150k) is reasonable based on typical stale-listing flexibility.
- Current owner paid $10k; list at $155k implies a 1450% gain — meaningful room to come down on a strong offer.
Risks & watch-outs
- Climate carrying-cost: major wildfire risk; extreme-heat days projected 7→19/yr by 2055 (HVAC capex compounding) — expect insurance premiums to compound above CPI over the hold.
Questions for the listing agent
- It's been on market 36 days. Have you received any prior offers? Is the seller open to a 3% concession, seller financing, or rate buy-down credit?
- Is there a deadline driving the sale (1031 exchange, divorce, estate, relocation)? That informs how much negotiation room exists.
- Schools are F-rated, which usually means shorter tenancies and higher turnover. Who's the typical renter profile here, and what's been the actual vacancy rate?
- What's the average days-on-market for RENTAL listings here right now (not sales)? A rising rental-DOM trend means longer vacancies and softer asking-rent achievability than the comps imply.
- What's the recent tenant-quality profile in this submarket — average credit score on applications, eviction rate, late-payment / NSF rate, and stable-employment percentage? A property-management company in the area should have these aggregated.
- How much new for-sale + rental construction is in the pipeline within 1–3 miles? Heavy new supply typically softens prices + rents 12–24 months out; constrained supply supports both.
Investment metrics
- 1% rule
- 1.13% ✓
- Cap rate
- 8.68%
- Cash-on-cash
- 8.51%
- DSCR
- 1.38
- GRM
- 7.4
CMA / ARV
No comps found within radius.
Projected returns pro-forma
-3.0% appreciation · 3.0% rent growth · sell at horizon
- IRR
- -3.4%
- Equity multiple
- 0.87×
- Total profit
- $-5,486
- Equity at exit
- $23,111
- IRR
- 6.3%
- Equity multiple
- 1.47×
- Total profit
- $20,573
- Equity at exit
- $13,402
Cash invested: $43,400 (down + closing). Projections, not guarantees.
Landlord ↔ Tenant lean methodology
- Overall (STATE)
- 87 Strongly Landlord-Friendly
- State Tennessee
- 87 Strongly Landlord-Friendly · R+13
- County
- — inherits STATE
- City
- — inherits STATE
ZIP-level market 37721
- Home prices YoY
- -14.1%
- Active inventory
- 4
- Price-to-rent
- 7.4×
Monthly cashflow live
- Estimated rent
- $1,746 medium interval (Pro) →
- Mortgage (P&I)
- −$813
- Tax est. 1.5%
- −$194 /mo · $2,325/yr
- Insurance
- −$65
- HOA
- −$0
- Vacancy / Maint / Mgmt
- −$367
- Net cashflow
- $308
Break-even live
UW: 25.0% down · 7.5% · 30yr · 1.5% tax · 5.0% vac · 8.0% maint · 8.0% mgmt
Financing live
Cash to close
- Down payment
- $38,750
- Closing costs
- $4,650
- Reserves months
- —
- Total cash needed
- —
Loan-product check · same deal, 3 products live
Conventional
25% down · 7.5% · 30yr
- Down + closing
- —
- Monthly P&I
- —
- Monthly cashflow
- —
- DSCR
- —
- Eligible?
- —
Personal DTI + credit; lowest rate.
DSCR
20% down · 8.5% · 30yr
- Down + closing
- —
- Monthly P&I
- —
- Monthly cashflow
- —
- DSCR
- —
- Eligible?
- —
No personal income docs; deal must DSCR.
Hard money
10% down · 12.0% · 12mo
- Down + closing
- —
- Monthly P&I
- —
- Monthly cashflow
- —
- DSCR
- —
- Eligible?
- —
Short-term bridge; refi at stabilization.
Rent comps 1 comps
| Address | Beds | Baths | Sqft | Rent | $/sqft | DOM | Units | Dist |
|---|---|---|---|---|---|---|---|---|
| 220 Monday Rd Lot 18 Corryton, TN | 3.0 | 2.0 | 980 | $565 | $0.58 | 23d | 1 | 0.30mi |
Listing history 17 events
-
2026-06-18days on market $155,000 Active 36 DOM
-
2026-06-17days on market $155,000 Active 35 DOM
-
2026-06-16days on market $155,000 Active 34 DOM
-
2026-06-15pricedays on market $155,000 Active 33 DOM
-
2026-06-14days on market $165,000 Active 31 DOM
-
2026-06-10days on market $165,000 Active 28 DOM
-
2026-06-09days on market $165,000 Active 27 DOM
-
2026-06-08days on market $165,000 Active 26 DOM
-
2026-06-07days on market $165,000 Active 25 DOM
-
2026-06-05days on market $165,000 Active 22 DOM
-
2026-06-03days on market $165,000 Active 21 DOM
-
2026-06-02days on market $165,000 Active 20 DOM
-
2026-06-01days on market $165,000 Active 19 DOM
-
2026-05-31days on market $165,000 Active 18 DOM
-
2026-05-31days on market $165,000 Active 17 DOM
-
2026-05-13$165,000 Active
-
1989-06-15soldstatus $10,000
ⓘ Source: listings_history table (triggers on properties + properties_extension) + one-shot
backfill from property_details.listing_events for pre-trigger history.
Climate risk First Street
- Flood 1/10 Low FEMA zone X (unshaded) · 0% chance over 30 yrs
- Wildfire 6/10 Major
- Heat 5/10 Major 7 d/yr ≥102°F today · 19 d/yr by 30 yrs out
- Wind 2/10 Low 100% chance of damaging wind over 30 yrs
- Air quality 4/10 Moderate 3 unhealthy d/yr today · 5 by 30 yrs out
Nearby sold comps map
Loading sold comps map…
Walkable amenities ~0.75 mi
Loading nearby amenities…
Taxation est. · year 1
- Rental income
- $20,946
- − Mortgage interest
- −$8,682
- − Property taxes
- −$2,325
- − Insurance
- −$775
- − Repairs & maintenance
- −$1,676
- − Management
- −$1,676
- − Depreciation
- −$4,509
- Taxable income
- $1,303
- Est. tax owed @ 24.0%
- −$313
- After-tax cash flow
- $3,381/yr
For passive investors: Depreciation is non-cash, so a rental often shows a tax loss while cash-flowing — sheltering income. Rental losses are passive: they offset passive income freely, and up to $25,000/yr can offset ordinary (W-2) income if you actively participate and your MAGI is under $100k (phasing out to $0 by $150k); unused losses carry forward. On sale, claimed depreciation is recaptured at up to 25%, and gains may owe capital-gains tax (a 1031 exchange can defer both). Figures are a year-1 estimate at your 24.0% rate — not tax advice; consult a CPA.
Schools (NCES district)
- District
- Union County
- NCES district ID
- 4704290
- Math proficiency
- 14% ▼ -7.00%
- Reading proficiency
- 19% ▼ -5.00%
- Median HH income
- $35,598
- Composite
- 13.62/100
- National rank
- #9507
- State rank
- #127 of 139 in TN
Livability — Plainview
- Score
- 60/100
- State rank
- #265
- US rank
- #18557
Category grades
Schools grade is shown separately in the Schools card above.
Census & demographics
- Census place
- Plainview, TN
- County
- Knox County · 473,959 people
- Metro
- Knoxville, TN
- Population (ZIP)
- 14,306
- Household income
- $64,892
- Rent vs Own
- Severe rent burden
- 105.0
Population outlook (Union County) Hauer SSP2
- Today (2025)
- 19,073 people
- By 2030
- 18,888 · -1.0%
- By 2040
- 18,090 · -5.2%
- By 2050
- 16,693 · -12.5%
- By 2075
- 12,894 · -32.4%
- By 2100
- 8,564 · -55.1%
Race, ethnicity, and origin ACS 2023
- Neighborhood character
- Predominantly White (93%)
- Race & ethnicity
- White 93% Two or more races 2% Hispanic / Latino 1% Black 1%
- Common ancestry
- Lithuanian 2% Serbian 2% Slovak 1%
- Foreign-born
- 1%
- Languages at home
- 99% English-only · Spanish 1%
Political lean MEDSL · Union
- 2024 margin
- Solid R (+71.2) · D 14.0% · R 85.2%
- 2008→2024 swing
- -29.9pp toward R · 2008: -41.2pp · 2024: -71.2pp
- All cycles
- 2024: R+71.2 2020: R+68.4 2016: R+64.7 2012: R+48.2 2008: R+41.2
Not yet ingested
- Civics
- —
Market trends
- HPI YoY
- ▼ -54.41%
- Current HPI
- 332.2944
- Rent YoY
- —
- Metro
- Knoxville, TN
- State GDP YoY
- ▲ 2.78%
- F500 in state
- 22
Industry mix (Fortune 500 HQ in TN)
| Industry | F500 HQs | Revenue |
|---|---|---|
| Healthcare | 3 | $91B |
|
||
| Retail | 3 | $72B |
|
||
| Transportation / Logistics | 1 | $88B |
|
||
| Paper / Packaging | 1 | $19B |
|
||
| Insurance | 1 | $13B |
|
||
| Energy | 1 | $12B |
|
||
Price history
+1550.0% since first listed2 events — show timeline
- 2026-05-13 Listed $165,000 Knoxville MLS
- 1989-06-15 Sold (Public Records) $10,000 Public Records
Property tax history
+1.0%/yrLatest (2025): $154 · +0.0% YoY. Source: county tax records.
Cash-flow waterfall
monthlySold comps — $/sqft
last 12 mo · ≤1 miLoading sold comps…