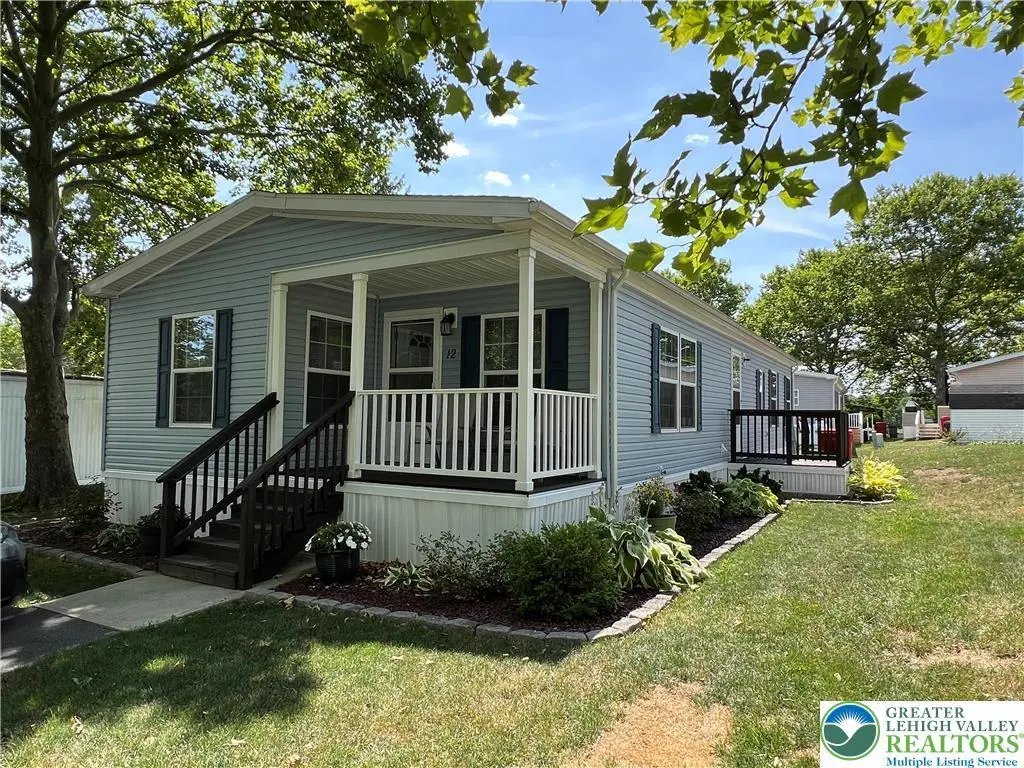
12 Springridge Rd · Moore, PA
Flood risk 1/10 · Minimal
- FEMA flood zone
- X (unshaded)
- Chance of flooding over 30 yrs
- 0.0%
- Est. flood insurance / yr
- $507 – $1,088
Fire risk 1/10 · Minimal
- Est. fire insurance / yr
- $511 – $949
Heat risk 4/10 · Minor
- Hot days now (above 98°F)
- 7 days/yr
- Hot days in 30 yrs
- 15 days/yr
Wind risk 4/10 · Minor
- Chance of severe wind over 30 yrs
- 16.0%
Air-quality risk 2/10 · Minimal
- Unhealthy air days now
- 1 days/yr
- Unhealthy air days in 30 yrs
- 3 days/yr
Risk factors via First Street. Map © Google.
Why this score? — see what drove the C grade
The composite is a weighted blend of 9 inputs, each scored 0–100. Each bar is that input's sub-score; the figure is the points it added to the 100-point composite (weight × sub-score).
- Cash flow +27.7/30.0
- DSCR +9.8/10.0
- 1% rule +7.7/10.0
- Schools +4.4/10.0
- Rent growth +2.5/5.0
- Livability +2.5/5.0
- Condition / age +2.5/5.0
- ARV discount +0.0/15.0
- Appreciation +0.0/10.0
$145,000
🖨 Deal sheet 📄 Offer letter ✓ Due diligence
Listing remarks MLS
Welcome to your new home in Hickory Hills Mobile home park. This is a like new 2019 Eagel river manufacturered home with all the modern comfort and amentities. There is a master bedroom wiht a large walk in closet, additioanl closet and the master bathroom has 2 closets and a step in shower and spacious vanity with additional stroage! The Other 2 bedroom are wall to wall carpeting, one has a walk in closet and the other a spacious closet as well. The living room and dining room payout is open concept and the area is fully visible fro the bar at the kitchen counter. The kitchen is a eat in kitchen with Black appliances. It is a electric stove, microwave, and refrigerator and a pantry. Sit and relax on the front covered, freshly stained deck and enjy the perrenials that surround the home. There is also a shed for your outdoor storage needs. Monthly Lot Rent of $883 covers water, sewer, trash and main road maintenance. Hickory Hills offers a spacious clubhouse, inground pool and many parks and a pond. Call Today!
Key facts
- Covered porch
- Pond
- Utility shed
Tags
Property features AI
Finance
- HOA & community: Monthly association fee; Sidewalks in the community
Exterior
- Parking: Two-car garage; Off-street parking
- Utilities: 100 amp electrical service with circuit breakers; Community/co-op water; Community/co-op sewer
- Home design: Single-story home
- Construction: Vinyl and wood siding; Spray foam insulation; Asphalt/fiberglass roof
- Exterior features: Deck; In-ground pool; Propane tank (leased); Mobile home on property; Backs to common grounds; Flat lot; Private paved road frontage
Interior
- Kitchen: Electric cooktop; Electric oven; Microwave; Refrigerator
- Bedrooms: Two bedrooms on the first floor
- Flooring: Carpet; Laminate; Resilient flooring; Vinyl
- Bathrooms: Two full bathrooms
- Heating & cooling: Forced air heating (propane); Central air conditioning; Ceiling fans
- Interior features: Dining area and separate/formal dining room; Eat-in kitchen; Mud room; Utility room; Walk-in closet(s); Storm door(s)
- Laundry & utility: Washer; Dryer; Propane water heater
Neighborhood map
What this means for you Summary
Snapshot
- This is a 3-bed/1.5-bath manufactured listed at $145k.
Deal economics
- At list price, monthly cash flow is $439 ($5k/yr) — positive.
- The deal already cash-flows at list — no discount required.
- Meets the 1% rule at list price ($2k rent vs $145k).
Location & tenants
- Location reads: area grade C — affects rentability + tenant quality, not the cash-flow math above.
- Northampton Area SD (suburban): math 47% / reading 54% proficiency, ranked #153 of 539 in PA (top 28%) — acceptable for families but not a draw, mixed tenant base, ~2y average lease.
- Market conditions: 62 active listings in the ZIP; 567 units permitted in Northampton County in 2024 (151 in 5+ unit buildings).
Forward outlook
- Local home prices are declining (-3.0%/yr); year-one equity from $1k of loan paydown is wiped out by about $4k of value loss. Plan a longer hold.
- At projected returns (-3.0% appreciation + 3.0% rent growth), your $41k cash investment doubles in ~9 years — after that, you're playing with house money.
Negotiation context
- Only 9 days on market — expect competitive offers; lowballing is unlikely to land.
- 5 sale attempts since 19y ago with the ask held roughly flat each time — persistent listings suggest the price (not the market) is what's stuck; bring a comps-based counter.
Questions for the listing agent
- Is there a deadline driving the sale (1031 exchange, divorce, estate, relocation)? That informs how much negotiation room exists.
- What's the average days-on-market for RENTAL listings here right now (not sales)? A rising rental-DOM trend means longer vacancies and softer asking-rent achievability than the comps imply.
- What's the recent tenant-quality profile in this submarket — average credit score on applications, eviction rate, late-payment / NSF rate, and stable-employment percentage? A property-management company in the area should have these aggregated.
- How much new for-sale + rental construction is in the pipeline within 1–3 miles? Heavy new supply typically softens prices + rents 12–24 months out; constrained supply supports both.
Investment metrics
- 1% rule
- 1.27% ✓
- Cap rate
- 9.93%
- Cash-on-cash
- 12.98%
- DSCR
- 1.58
- GRM
- 6.6
CMA / ARV
- ARV (on-the-fly)
- $103,032
- Comps found
- 8
Show comp detail 8 sales within ~0.75 mi
| Address | Dist | Beds/Ba | Sqft | Sold | Price | $/sf | Match |
|---|---|---|---|---|---|---|---|
| 4 Hickory Hills Dr | 0.24mi | 2/2.0 (-1) | 1,287 (+1%) | 8mo | $135,000 | $105 | 73 |
| 18 Valley View Rd | 0.16mi | 3/2.0 | 1,344 (+6%) | 13mo | $95,000 | $71 | 70 |
| 15 Brookside Dr | 0.08mi | 3/2.0 | 1,380 (+8%) | 22mo | $92,500 | $67 | 62 |
| 12 Spruce Ct | 0.14mi | 2/2.0 (-1) | 1,152 (-9%) | 11mo | $94,900 | $82 | 61 |
| 63 Hickory Hills Dr | 0.13mi | 3/2.0 | 1,176 (-8%) | 22mo | $135,000 | $115 | 61 |
| 11 Longridge Ct | 0.38mi | 3/2.0 | 1,368 (+8%) | 8mo | $75,000 | $55 | 61 |
| 53 Sycamore Dr | 0.41mi | 3/2.0 | 1,344 (+6%) | 20mo | $105,000 | $78 | 52 |
| 548 Moorestown Dr | 0.38mi | 2/1.0 (-1) | 1,168 (-8%) | 22mo | $95,000 | $81 | 43 |
Match score weights: distance 35% · size 25% · config 20% · recency 20%. Top-matched comps best support the ARV.
Projected returns pro-forma
-3.0% appreciation · 3.0% rent growth · sell at horizon
- IRR
- 2.9%
- Equity multiple
- 1.11×
- Total profit
- $4,507
- Equity at exit
- $21,620
- IRR
- 12.5%
- Equity multiple
- 1.99×
- Total profit
- $40,083
- Equity at exit
- $12,537
Cash invested: $40,600 (down + closing). Projections, not guarantees.
Landlord ↔ Tenant lean methodology
- Overall (STATE)
- 62 Landlord-Friendly
- State Pennsylvania
- 62 Landlord-Friendly · EVEN
- County
- — inherits STATE
- City
- — inherits STATE
ZIP-level market 18014
- Active inventory
- 62
- Price-to-rent
- 6.6×
Monthly cashflow live
- Estimated rent
- $1,841 medium interval (Pro) →
- Mortgage (P&I)
- −$760
- Tax from tax record
- −$195 /mo · $2,335/yr
- Insurance
- −$60
- HOA
- −$0
- Vacancy / Maint / Mgmt
- −$387
- Net cashflow
- $439
Break-even live
UW: 25.0% down · 7.5% · 30yr · 1.5% tax · 5.0% vac · 8.0% maint · 8.0% mgmt
Financing live
Cash to close
- Down payment
- $36,250
- Closing costs
- $4,350
- Reserves months
- —
- Total cash needed
- —
Loan-product check · same deal, 3 products live
Conventional
25% down · 7.5% · 30yr
- Down + closing
- —
- Monthly P&I
- —
- Monthly cashflow
- —
- DSCR
- —
- Eligible?
- —
Personal DTI + credit; lowest rate.
DSCR
20% down · 8.5% · 30yr
- Down + closing
- —
- Monthly P&I
- —
- Monthly cashflow
- —
- DSCR
- —
- Eligible?
- —
No personal income docs; deal must DSCR.
Hard money
10% down · 12.0% · 12mo
- Down + closing
- —
- Monthly P&I
- —
- Monthly cashflow
- —
- DSCR
- —
- Eligible?
- —
Short-term bridge; refi at stabilization.
Listing history 7 events
-
2026-06-18days on market $145,000 Active 9 DOM
-
2026-06-17days on market $145,000 Active 8 DOM
-
2026-06-16days on market $145,000 Active 7 DOM
-
2026-06-15days on market $145,000 Active 6 DOM
-
2026-06-14days on market $145,000 Active 4 DOM
-
2026-06-10remarks 699-char remark
-
2026-06-10$145,000 Active 1 DOM
ⓘ Source: listings_history table (triggers on properties + properties_extension) + one-shot
backfill from property_details.listing_events for pre-trigger history.
Tax reassessment forecast PA · Partial reset (capped growth)
- Current annual tax
- $2,335 · $195/mo
- Projected year-2 tax
- $2,335 · $195/mo
- Expected delta
- $0/yr ($0/mo · 0.0%)
ⓘ Screening estimate from a state-policy table — verify with the county assessor before closing.
Climate risk First Street
- Flood 1/10 Low FEMA zone X (unshaded) · 0% chance over 30 yrs
- Wildfire 1/10 Low
- Heat 4/10 Moderate 7 d/yr ≥98°F today · 15 d/yr by 30 yrs out
- Wind 4/10 Moderate 16% chance of damaging wind over 30 yrs
- Air quality 2/10 Low 1 unhealthy d/yr today · 3 by 30 yrs out
Nearby sold comps map
Loading sold comps map…
Walkable amenities ~0.75 mi
Loading nearby amenities…
Taxation est. · year 1
- Rental income
- $22,094
- − Mortgage interest
- −$8,122
- − Property taxes
- −$2,335
- − Insurance
- −$725
- − Repairs & maintenance
- −$1,768
- − Management
- −$1,768
- − Depreciation
- −$4,218
- Taxable income
- $3,158
- Est. tax owed @ 24.0%
- −$758
- After-tax cash flow
- $4,511/yr
For passive investors: Depreciation is non-cash, so a rental often shows a tax loss while cash-flowing — sheltering income. Rental losses are passive: they offset passive income freely, and up to $25,000/yr can offset ordinary (W-2) income if you actively participate and your MAGI is under $100k (phasing out to $0 by $150k); unused losses carry forward. On sale, claimed depreciation is recaptured at up to 25%, and gains may owe capital-gains tax (a 1031 exchange can defer both). Figures are a year-1 estimate at your 24.0% rate — not tax advice; consult a CPA.
Schools (NCES district)
- District
- Northampton Area SD
- NCES district ID
- 4217370
- Math proficiency
- 47% ▼ -1.00%
- Reading proficiency
- 54% ▼ -13.00%
- Median HH income
- $62,326
- Composite
- 44.35/100
- National rank
- #2822
- State rank
- #153 of 539 in PA
Livability — Moore
No livability data for this city. (Only ~50 U.S. cities are tracked.)
Census & demographics
- Population (ZIP)
- 12,474
Population outlook (Northampton County) Hauer SSP2
- Today (2025)
- 312,227 people
- By 2030
- 314,769 · +0.8%
- By 2040
- 316,914 · +1.5%
- By 2050
- 318,037 · +1.9%
- By 2075
- 334,003 · +7.0%
- By 2100
- 344,696 · +10.4%
Race, ethnicity, and origin ACS 2023
- Neighborhood character
- Predominantly White (88%)
- Race & ethnicity
- White 88% Hispanic / Latino 6% Two or more races 4% Black 3%
- Hispanic origin (detail)
- Puerto Rican 3%
- Common ancestry
- Romanian 4% Polish 3% Danish 3%
- Foreign-born
- 2% · Canada
- Languages at home
- 95% English-only · Spanish 3% Other Indo-European 1%
Political lean MEDSL · Northampton
- 2024 margin
- Toss-up / Even · D 48.6% · R 50.4%
- 2008→2024 swing
- -14.1pp toward R · 2008: 12.3pp · 2024: -1.8pp
- All cycles
- 2024: R+1.8 2020: D+0.7 2016: R+3.8 2012: D+4.6 2008: D+12.3
Not yet ingested
- Civics
- —
Market trends
- HPI YoY
- ▼ -145.54%
- Current HPI
- 212.4688
- Rent YoY
- —
- Metro
- —
- State GDP YoY
- ▲ 1.68%
- F500 in state
- 34
Industry mix (Fortune 500 HQ in PA)
| Industry | F500 HQs | Revenue |
|---|---|---|
| Healthcare | 2 | $309B |
|
||
| Insurance | 2 | $27B |
|
||
| Telecommunications / Media | 1 | $124B |
|
||
| Industrial Distribution | 1 | $22B |
|
||
| Financial Services | 1 | $20B |
|
||
| Chemicals / Materials | 1 | $18B |
|
||
Price history
+195.9% since first listed10 events — show timeline
- 2026-06-09 Listed $145,000 GLVRMLS
- 2024-08-21 Listing Removed — GLVRMLS
- 2024-08-21 Sold (MLS) $135,000 GLVRMLS
- 2024-07-10 Pending — GLVRMLS
- 2024-07-03 Listed $135,000 GLVRMLS
- 2008-07-11 Listing Removed — GLVRMLS
- 2008-03-10 Listed $21,000 GLVRMLS
- 2007-12-20 Listing Removed — GLVRMLS
- 2007-06-21 Listed $49,000 PMAR
- 2007-06-21 Listed $49,000 GLVRMLS
Property tax history
+1.0%/yrLatest (2026): $2,335 · +3.0% YoY. Source: county tax records.
Cash-flow waterfall
monthlySold comps — $/sqft
last 12 mo · ≤1 miLoading sold comps…