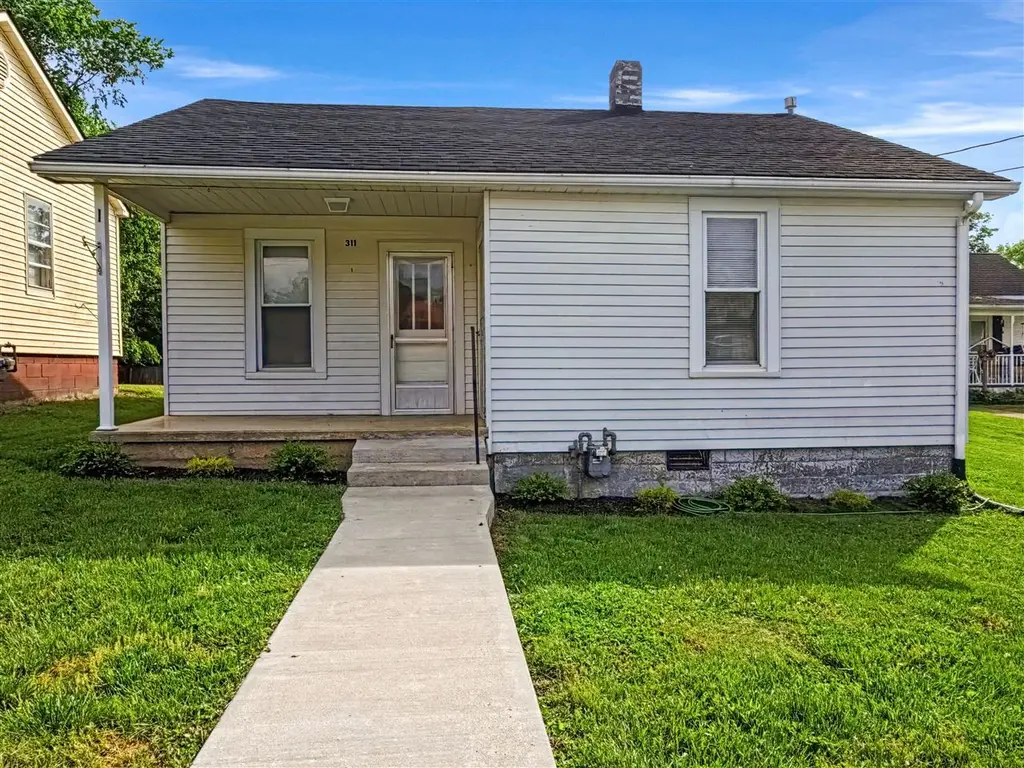
311 W Washington St · Munfordville, KY
Flood risk 1/10 · Minimal
- FEMA flood zone
- X (unshaded)
- Chance of flooding over 30 yrs
- 0.0%
- Est. flood insurance / yr
- $507 – $1,088
Fire risk 3/10 · Minor
- Est. fire insurance / yr
- $839 – $1,559
Heat risk 6/10 · Moderate
- Hot days now (above 107°F)
- 7 days/yr
- Hot days in 30 yrs
- 20 days/yr
Wind risk 3/10 · Minor
- Chance of severe wind over 30 yrs
- 5.0%
Air-quality risk 2/10 · Minimal
- Unhealthy air days now
- 0 days/yr
- Unhealthy air days in 30 yrs
- 1 days/yr
Risk factors via First Street. Map © Google.
Why this score? — see what drove the D+ grade
The composite is a weighted blend of 9 inputs, each scored 0–100. Each bar is that input's sub-score; the figure is the points it added to the 100-point composite (weight × sub-score).
- ARV discount +15.0/15.0
- Appreciation +10.0/10.0
- Cash flow +9.2/30.0
- Livability +3.6/5.0
- DSCR +2.6/10.0
- Rent growth +2.5/5.0
- Condition / age +2.5/5.0
- Schools +2.4/10.0
- 1% rule +1.6/10.0
$130,000
🖨 Deal sheet (PDF) 📄 Offer letter ✓ Due diligence
Listing remarks MLS
Completely refreshed and perfectly positioned-311 West Washington Street delivers easy living in a prime Munfordville location. this 2-bed, 1-bath home has been fully remodeled with attention to detail, including new kitchen cabinetry, a stunning bathroom upgrade, and two split units installed just 6 months ago for efficient comfort. The exterior shines with a newly built back patio and updates landscaping, creating a low-maintenance outdoor retreat. Enjoy the unbeatable walkability-just a short stroll to the town square, Stovall Park, Munfordville Elementary, and nearby shopping. Call today to schedule a private tour!
Key facts
- Fully remodeled
- Updated landscaping
- 4,356 sq ft lot
Tags
Property features AI
Finance
- Other
- Lot is cleared with sidewalksLot dimensions approximately 50 x 200Lot area about 0.1 acreBuilding area reported as 840 (source: Other)
- HOA & community
- No association fee
Exterior
- Utilities
- Electricity connected
- Home design
- Single-family residenceColonial / Traditional style1 story
- Construction
- Aluminum sidingShingle roofYear built not specified
- Exterior features
- No exterior features listed
Interior
- Kitchen
- Kitchen on the first floor
- Bedrooms
- 2 bedrooms, both on the first floorPrimary bedroom on the first floor
- Bathrooms
- 1 full bathroom
- Heating & cooling
- MiniSplit/ductless heatingCooling present
- Interior features
- Total of 4 roomsLiving room on the first floorNo basement
- Laundry & utility
- First-floor laundry
Neighborhood map
What this means for you Summary
Snapshot
- This is a 2-bed/1.0-bath single-family listed at $130k.
Deal economics
- At list price, monthly cash flow is $-97 ($-1k/yr) — negative.
- To cash-flow at today's rent, offer at most $113k (13.2% below list).
- To meet the 1% rule (rent ≥ 1% of price), the offer needs to be $85k (34.3% below list).
- Recommended offer: $85k (34.3% below list) — sets the bar for 1% rule.
- Cap rate 5.4% vs local median 2.8% in Munfordville — top-decile yield for the area; either an underpriced asset or a hidden risk that comps aren't pricing in. Stress-test before assuming the spread holds.
Location & tenants
- Location reads 72/100 on livability (#128 in KY) — a middle-class / working-renter tenant base. Strengths: crime A+, cost of living A+, health & safety A+; Watch: amenities F, commute F, employment F.
- Hart County (rural): math 21% / reading 38% proficiency, ranked #119 of 165 in KY (top 72%) — low school quality limits family demand, transient renter base, plan for 1-2y turnover.
- Zoned schools: Munfordville Elementary School (math 27% / reading 44%, grade F, #293 of 676 statewide, top 44%, 492 students, 64% FRL); Hart County High School (math 22% / reading 32%, grade F, #158 of 254 statewide, top 68%, 679 students, 55% FRL).
- Market conditions: 45 active listings in the ZIP; 79 units permitted in Hart County in 2024 (60 in 5+ unit buildings).
Forward outlook
- In year one you build about $14k of equity ($899 loan paydown + $13k appreciation (10.0% local appreciation)).
- By year 3, paydown + projected appreciation supports a ~$35k cash-out refi (75% LTV) — recoverable capital for the next deal without selling this one.
Negotiation context
- It's been on market 49 days — a 3% lower offer ($126k) is reasonable based on typical stale-listing flexibility.
- 2 sale attempts; this cycle's ask has dropped $25k (16%) from the opening price — seller is motivated, your offer sets the floor, not the list.
- Current owner paid $44k; list at $130k implies a 195% gain — meaningful room to come down on a strong offer.
Risks & watch-outs
- Climate carrying-cost: extreme-heat days projected 7→20/yr by 2055 (HVAC capex compounding) — expect insurance premiums to compound above CPI over the hold.
Questions for the listing agent
- What do current leases actually rent for vs. the listed asking? Can we see a recent rent roll and the last 12 months of T-12 income?
- It's been on market 49 days. Have you received any prior offers? Is the seller open to a 34% concession, seller financing, or rate buy-down credit?
- Is there a deadline driving the sale (1031 exchange, divorce, estate, relocation)? That informs how much negotiation room exists.
- Schools are F-rated, which usually means shorter tenancies and higher turnover. Who's the typical renter profile here, and what's been the actual vacancy rate?
- The area grade is low — what's the realistic commute time and amenity access for the typical tenant pool here? Any planned neighborhood developments (good or bad) we should know about?
- What's the average days-on-market for RENTAL listings here right now (not sales)? A rising rental-DOM trend means longer vacancies and softer asking-rent achievability than the comps imply.
- What's the recent tenant-quality profile in this submarket — average credit score on applications, eviction rate, late-payment / NSF rate, and stable-employment percentage? A property-management company in the area should have these aggregated.
- How much new for-sale + rental construction is in the pipeline within 1–3 miles? Heavy new supply typically softens prices + rents 12–24 months out; constrained supply supports both.
Investment metrics
- 1% rule
- 0.66% ✗
- Cap rate
- 5.40%
- Cash-on-cash
- -3.20%
- DSCR
- 0.86
- GRM
- 12.7
CMA / ARV
- ARV (on-the-fly)
- $157,920
- Comps found
- 2
Show comp detail 2 sales within ~0.75 mi
| Address | Dist | Beds/Ba | Sqft | Sold | Price | $/sf | Match |
|---|---|---|---|---|---|---|---|
| 312 N West St | 0.05mi | 2/1.0 | 744 (-11%) | 8mo | $122,000 | $164 | 72 |
| 509 W Back St | 0.27mi | 2/1.0 | 928 (+10%) | 2mo | $174,450 | $188 | 68 |
Match score weights: distance 35% · size 25% · config 20% · recency 20%. Top-matched comps best support the ARV.
Projected returns pro-forma
10.0% appreciation · 3.0% rent growth · sell at horizon
- IRR
- 22.0%
- Equity multiple
- 2.77×
- Total profit
- $64,549
- Equity at exit
- $117,114
- IRR
- 19.8%
- Equity multiple
- 6.35×
- Total profit
- $194,824
- Equity at exit
- $252,561
Cash invested: $36,400 (down + closing). Projections, not guarantees.
Landlord ↔ Tenant lean methodology
- Overall (STATE)
- 83 Strongly Landlord-Friendly
- State Kentucky
- 83 Strongly Landlord-Friendly · R+16
- County
- — inherits STATE
- City
- — inherits STATE
ZIP-level market 42765
- Home prices YoY
- 26.8%
- Active inventory
- 45
- Price-to-rent
- 12.7×
Monthly cashflow live
- Estimated rent
- $854 medium interval (Pro) →
- Mortgage (P&I)
- −$682
- Tax from tax record
- −$36 /mo · $433/yr
- Insurance
- −$54
- HOA
- −$0
- Lot rent
- −$0
- Vacancy / Maint / Mgmt
- −$179
- Net cashflow
- $-97
Break-even live
Sensitivity live
| Price | -10% $-24 | -5% $-60 | +0% $-97 | +5% $-134 | +10% $-171 |
|---|---|---|---|---|---|
| Rent | -10% $-165 | -5% $-131 | +0% $-97 | +5% $-63 | +10% $-30 |
| Rate | -1.0pp $-32 | -0.5pp $-64 | base $-97 | +0.5pp $-131 | +1.0pp $-165 |
UW: 25.0% down · 7.5% · 30yr · 1.5% tax · 5.0% vac · 8.0% maint · 8.0% mgmt
Financing live
Cash to close
- Down payment
- $32,500
- Closing costs
- $3,900
- Reserves months
- —
- Total cash needed
- —
Loan-product check · same deal, 3 products live
Conventional
25% down · 7.5% · 30yr
- Down + closing
- —
- Monthly P&I
- —
- Monthly cashflow
- —
- DSCR
- —
- Eligible?
- —
Personal DTI + credit; lowest rate.
DSCR
20% down · 8.5% · 30yr
- Down + closing
- —
- Monthly P&I
- —
- Monthly cashflow
- —
- DSCR
- —
- Eligible?
- —
No personal income docs; deal must DSCR.
Hard money
10% down · 12.0% · 12mo
- Down + closing
- —
- Monthly P&I
- —
- Monthly cashflow
- —
- DSCR
- —
- Eligible?
- —
Short-term bridge; refi at stabilization.
Listing history 23 events
-
2026-06-22days on market $130,000 Active 49 DOM
-
2026-06-21days on market $130,000 Active 48 DOM
-
2026-06-21days on market $130,000 Active 47 DOM
-
2026-06-18price $130,000 Active 45 DOM
-
2026-06-18days on market $140,000 Active 45 DOM
-
2026-06-17days on market $140,000 Active 44 DOM
-
2026-06-16days on market $140,000 Active 43 DOM
-
2026-06-15days on market $140,000 Active 42 DOM
-
2026-06-13days on market $140,000 Active 40 DOM
-
2026-06-12days on market $140,000 Active 39 DOM
-
2026-06-09days on market $140,000 Active 36 DOM
-
2026-06-08days on market $140,000 Active 35 DOM
-
2026-06-07days on market $140,000 Active 34 DOM
-
2026-06-05days on market $140,000 Active 32 DOM
-
2026-06-04days on market $140,000 Active 30 DOM
-
2026-06-02days on market $140,000 Active 29 DOM
-
2026-06-01days on market $140,000 Active 28 DOM
-
2026-05-31days on market $140,000 Active 27 DOM
-
2026-05-31days on market $140,000 Active 26 DOM
-
2026-05-04$155,000 Active 626-char remark
Show marketing remark (626 chars)
Completely refreshed and perfectly positioned-311 West Washington Street delivers easy living in a prime Munfordville location. this 2-bed, 1-bath home has been fully remodeled with attention to detail, including new kitchen cabinetry, a stunning bathroom upgrade, and two split units installed just 6 months ago for efficient comfort. The exterior shines with a newly built back patio and updates landscaping, creating a low-maintenance outdoor retreat. Enjoy the unbeatable walkability-just a short stroll to the town square, Stovall Park, Munfordville Elementary, and nearby shopping. Call today to schedule a private tour!
-
2026-05-04$155,000 Active
Show marketing remark (626 chars)
Completely refreshed and perfectly positioned-311 West Washington Street delivers easy living in a prime Munfordville location. this 2-bed, 1-bath home has been fully remodeled with attention to detail, including new kitchen cabinetry, a stunning bathroom upgrade, and two split units installed just 6 months ago for efficient comfort. The exterior shines with a newly built back patio and updates landscaping, creating a low-maintenance outdoor retreat. Enjoy the unbeatable walkability-just a short stroll to the town square, Stovall Park, Munfordville Elementary, and nearby shopping. Call today to schedule a private tour!
-
2001-07-01soldstatus $44,000
-
1997-07-01soldstatus $25,145
ⓘ Source: listings_history table (triggers on properties + properties_extension) + one-shot
backfill from property_details.listing_events for pre-trigger history.
Tax reassessment forecast KY · Resets to sale price
- Current annual tax
- $433 · $36/mo
- Projected year-2 tax
- $1,118 · $93/mo
- Expected delta
- +$685/yr (+$57/mo · 158.3%)
ⓘ Screening estimate from a state-policy table — verify with the county assessor before closing.
Climate risk First Street
- Flood 1/10 Low FEMA zone X (unshaded) · 0% chance over 30 yrs
- Wildfire 3/10 Moderate
- Heat 6/10 Major 7 d/yr ≥107°F today · 20 d/yr by 30 yrs out
- Wind 3/10 Moderate 5% chance of damaging wind over 30 yrs
- Air quality 2/10 Low 0 unhealthy d/yr today · 1 by 30 yrs out
Nearby sold comps map
Loading sold comps map…
Walkable amenities ~0.75 mi
Loading nearby amenities…
Taxation est. · year 1
- Rental income
- $10,251
- − Mortgage interest
- −$7,282
- − Property taxes
- −$433
- − Insurance
- −$650
- − Repairs & maintenance
- −$820
- − Management
- −$820
- − Depreciation
- −$3,782
- Taxable loss
- −$3,536
- Est. tax savings @ 24.0%
- +$849
- After-tax cash flow
- $-317/yr
For passive investors: Depreciation is non-cash, so a rental often shows a tax loss while cash-flowing — sheltering income. Rental losses are passive: they offset passive income freely, and up to $25,000/yr can offset ordinary (W-2) income if you actively participate and your MAGI is under $100k (phasing out to $0 by $150k); unused losses carry forward. On sale, claimed depreciation is recaptured at up to 25%, and gains may owe capital-gains tax (a 1031 exchange can defer both). Figures are a year-1 estimate at your 24.0% rate — not tax advice; consult a CPA.
Schools (NCES district)
- District
- Hart County
- NCES district ID
- 2102640
- Math proficiency
- 21% ▼ -21.00%
- Reading proficiency
- 38% ▼ -20.00%
- Median HH income
- $34,931
- Composite
- 24.28/100
- National rank
- #7714
- State rank
- #119 of 165 in KY
Livability — Munfordville
- Score
- 72/100
- State rank
- #128
- US rank
- #6111
Category grades
Schools grade is shown separately in the Schools card above.
Census & demographics
- Census place
- Munfordville, KY
- Population (ZIP)
- 7,030
Population outlook (Hart County) Hauer SSP2
- Today (2025)
- 18,897 people
- By 2030
- 19,008 · +0.6%
- By 2040
- 19,032 · +0.7%
- By 2050
- 18,584 · -1.7%
- By 2075
- 17,303 · -8.4%
- By 2100
- 14,894 · -21.2%
Race, ethnicity, and origin ACS 2023
- Neighborhood character
- Predominantly White (92%)
- Race & ethnicity
- White 92% Hispanic / Latino 3% Black 3% Two or more races 2%
- Common ancestry
- Polish 2% Slovak 1% Iranian 1%
- Foreign-born
- 1% · China
- Languages at home
- 85% English-only · German/W. Germanic 13% Spanish 1% Chinese 1%
Political lean MEDSL · Hart
- 2024 margin
- Solid R (+60.0) · D 19.5% · R 79.6%
- 2008→2024 swing
- -29.1pp toward R · 2008: -30.9pp · 2024: -60.0pp
- All cycles
- 2024: R+60.0 2020: R+53.0 2016: R+49.4 2012: R+29.8 2008: R+30.9
Not yet ingested
- Civics
- —
Market trends
- HPI YoY
- ▲ 77.29%
- Current HPI
- 365.6917
- Rent YoY
- —
- Metro
- —
- State GDP YoY
- ▲ 1.81%
- F500 in state
- 4
Industry mix (Fortune 500 HQ in KY)
| Industry | F500 HQs | Revenue |
|---|---|---|
| Healthcare | 1 | $118B |
|
||
| Food / Beverage | 1 | $7B |
|
||
Price history
+516.4% since first listed4 events — show timeline
- 2026-05-04 Listed $155,000 Metro Search MLS
- 2026-05-04 Listed $155,000 RASKMLS
- 2001-07-01 Sold (Public Records) $44,000 Public Records
- 1997-07-01 Sold (Public Records) $25,145 Public Records
Property tax history
+3.6%/yrLatest (2025): $433 · +2.3% YoY. Source: county tax records.
Cash-flow waterfall
monthlySold comps — $/sqft
last 12 mo · ≤1 miLoading sold comps…