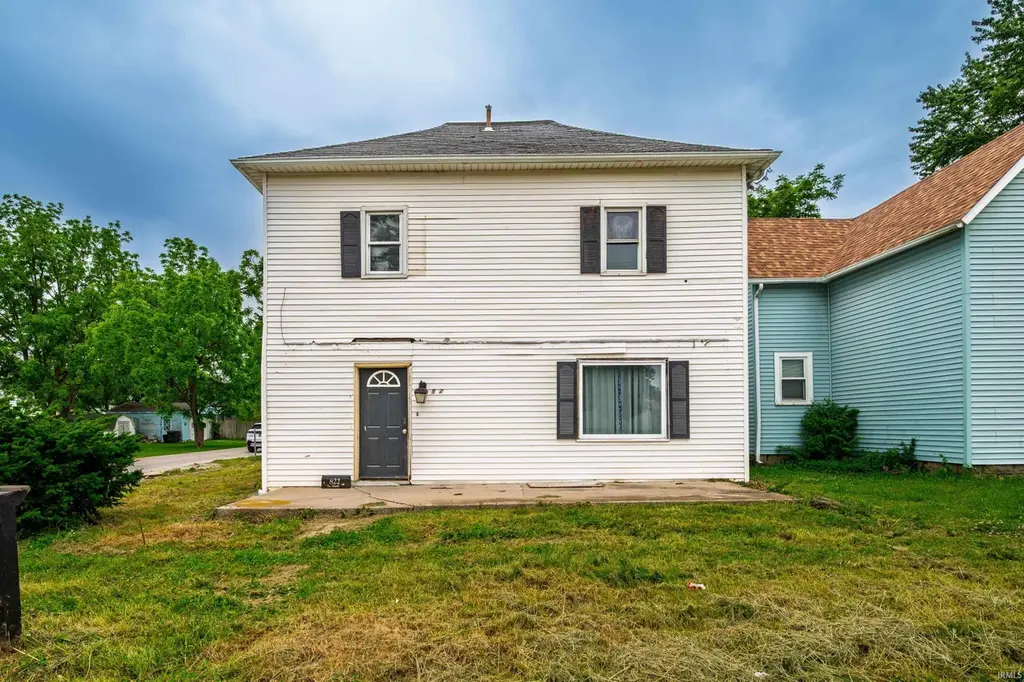
822 W Franklin St · Hartford City, IN
Flood risk 1/10 · Minimal
- FEMA flood zone
- X (unshaded)
- Chance of flooding over 30 yrs
- 0.0%
- Est. flood insurance / yr
- $507 – $1,088
Fire risk 1/10 · Minimal
- Est. fire insurance / yr
- $717 – $1,331
Heat risk 3/10 · Minor
- Hot days now (above 99°F)
- 7 days/yr
- Hot days in 30 yrs
- 18 days/yr
Wind risk 2/10 · Minimal
- Chance of severe wind over 30 yrs
- 0.0%
Air-quality risk 3/10 · Minor
- Unhealthy air days now
- 2 days/yr
- Unhealthy air days in 30 yrs
- 4 days/yr
Risk factors via First Street. Map © Google.
Why this score? — see what drove the B- grade
The composite is a weighted blend of 9 inputs, each scored 0–100. Each bar is that input's sub-score; the figure is the points it added to the 100-point composite (weight × sub-score).
- Cash flow +30.0/30.0
- 1% rule +10.0/10.0
- DSCR +10.0/10.0
- ARV discount +7.5/15.0
- Schools +3.3/10.0
- Livability +3.3/5.0
- Rent growth +2.5/5.0
- Condition / age +2.5/5.0
- Appreciation +0.0/10.0
$39,900
🖨 Deal sheet (PDF) 📄 Offer letter ✓ Due diligence
Listing remarks
Investor special with great potential! This 4-bedroom, 1.5-bath home sits on a desirable corner lot and offers an excellent opportunity for investors, flippers, or buyers looking to build equity. The property features a newer AC unit, a spacious floor plan, and a large front patio perfect for relaxing outdoors or entertaining guests. With plenty of room to add value and make it your own, this home is full of possibilities. Seller will consider owner financing with acceptable terms. Property is being sold as-is.
Key facts
- Newer ac unit
- Large front patio
- Corner lot
Tags
Property features AI
Finance
- Other: No additional financial details provided
- Financial info: No investor or income/expense details provided
- HOA & community: No HOA details provided
Exterior
- Parking: No parking details provided
- Security: No security details provided
- Utilities: Public water; Public sewer
- Home design: Single-family residence (site-built); 2-story
- Construction: Vinyl siding exterior; No year built provided
- Exterior features: Corner lot; Level lot
Interior
- Kitchen: No appliance details provided
- Bedrooms: Bedrooms present (count not specified)
- Flooring: No flooring details provided
- Bathrooms: 1 full bathroom; 1 half bathroom; 1 main-level bathroom
- Heating & cooling: Central air conditioning; Natural gas heating
- Interior features: 6 total rooms; Crawl space basement
- Laundry & utility: Laundry on the main level
Neighborhood map
What this means for you Summary
Snapshot
- This is a 4-bed/1.5-bath single-family listed at $40k.
Deal economics
- At list price, monthly cash flow is $680 ($8k/yr) — positive.
- The deal already cash-flows at list — no discount required.
- Meets the 1% rule at list price ($1k rent vs $40k).
- Recommended offer: $39k (1.5% below list) — sets the bar for market timing.
- Cap rate 26.7% vs local median 5.1% in Hartford City — top-decile yield for the area; either an underpriced asset or a hidden risk that comps aren't pricing in. Stress-test before assuming the spread holds.
Location & tenants
- Location reads 66/100 on livability (#303 in IN) — a middle-class / working-renter tenant base. Strengths: cost of living A+, housing A+; Watch: health & safety D, amenities F, commute F.
- Blackford County Schools (town): math 37% / reading 41% proficiency, ranked #164 of 301 in IN (top 54%) — families likely to look elsewhere, expect single-tenant / working-renter base with shorter leases.
- Zoned schools: Blackford Primary School (352 students, 65% FRL); Blackford Intermediate School (math 45% / reading 39%, grade F, #434 of 994 statewide, top 48%, 427 students, 65% FRL); Blackford Jr-Sr High School (math 25% / reading 43%, grade F, #285 of 369 statewide, top 78%, 717 students, 50% FRL).
- Market conditions: 55 active listings in the ZIP; 9 units permitted in Blackford County in 2024 (0 in 5+ unit buildings).
Forward outlook
- Local home prices are declining (-3.0%/yr); year-one equity from $276 of loan paydown is wiped out by about $1k of value loss. Plan a longer hold.
- Blackford County population projected at -27% by 2050 — secular population decline; favor cash flow + early exit over multi-decade hold.
- At projected returns (-3.0% appreciation + 3.0% rent growth), your $11k cash investment doubles in ~2 years — after that, you're playing with house money.
Negotiation context
- It's been on market 18 days — a 2% lower offer ($39k) is reasonable based on typical stale-listing flexibility.
- 5 sale attempts since 12y ago with the ask held roughly flat each time — persistent listings suggest the price (not the market) is what's stuck; bring a comps-based counter.
Risks & watch-outs
- Watch-outs: property tax is 4.2% of price; built in 1880 — expect roof / HVAC / electrical / plumbing capex.
Questions for the listing agent
- Built in 1880 — when were the roof, HVAC, electrical panel, plumbing, and water heater last replaced?
- Property tax is high relative to price — has the assessment been appealed recently, and will the sale trigger a re-assessment?
- Is there a deadline driving the sale (1031 exchange, divorce, estate, relocation)? That informs how much negotiation room exists.
- Schools are D-rated, which usually means shorter tenancies and higher turnover. Who's the typical renter profile here, and what's been the actual vacancy rate?
- What's the average days-on-market for RENTAL listings here right now (not sales)? A rising rental-DOM trend means longer vacancies and softer asking-rent achievability than the comps imply.
- What's the recent tenant-quality profile in this submarket — average credit score on applications, eviction rate, late-payment / NSF rate, and stable-employment percentage? A property-management company in the area should have these aggregated.
- How much new for-sale + rental construction is in the pipeline within 1–3 miles? Heavy new supply typically softens prices + rents 12–24 months out; constrained supply supports both.
Investment metrics
- 1% rule
- 3.32% ✓
- Cap rate
- 26.74%
- Cash-on-cash
- 73.04%
- DSCR
- 4.25
- GRM
- 2.5
CMA / ARV
- ARV (on-the-fly)
- $120,736
- Comps found
- 12
Show comp detail 12 sales within ~0.75 mi
| Address | Dist | Beds/Ba | Sqft | Sold | Price | $/sf | Match |
|---|---|---|---|---|---|---|---|
| 823 W Commercial St | 0.32mi | 4/1.0 | 1,600 (+2%) | 11mo | $5,000 | $3 | 71 |
| 600 W Fulton St | 0.49mi | 3/1.5 (-1) | 1,560 (-0%) | 1mo | $135,000 | $87 | 70 |
| 709 N Walnut St | 0.43mi | 3/1.0 (-1) | 1,554 (-1%) | 4mo | $161,000 | $104 | 68 |
| 724 W Commercial St | 0.29mi | 4/2.0 | 1,748 (+12%) | 6mo | $134,000 | $77 | 60 |
| 420 S Cherry St | 0.47mi | 3/1.0 (-1) | 1,474 (-6%) | 2mo | $72,300 | $49 | 60 |
| 904 W Harrison St | 0.42mi | 3/1.0 (-1) | 1,458 (-7%) | 9mo | $160,000 | $110 | 54 |
| 408 E Grant St | 0.71mi | 3/1.0 (-1) | 1,544 (-2%) | 5mo | $123,500 | $80 | 53 |
| 212 W Barber St | 0.62mi | 3/2.0 (-1) | 1,716 (+9%) | 6mo | $77,500 | $45 | 44 |
| 413 E Water St | 0.74mi | 4/1.0 | 1,677 (+7%) | 10mo | $11,000 | $7 | 44 |
| 1012 N Monroe St | 0.71mi | 3/2.0 (-1) | 1,453 (-7%) | 5mo | $229,000 | $158 | 44 |
| 221 W Franklin St | 0.40mi | 3/1.0 (-1) | 1,800 (+15%) | 9mo | $123,500 | $69 | 43 |
| 1410 N Richmond St | 0.71mi | 3/2.0 (-1) | 1,344 (-14%) | 6mo | $90,000 | $67 | 31 |
Match score weights: distance 35% · size 25% · config 20% · recency 20%. Top-matched comps best support the ARV.
Projected returns pro-forma
-3.0% appreciation · 3.0% rent growth · sell at horizon
- IRR
- 72.8%
- Equity multiple
- 4.30×
- Total profit
- $36,918
- Equity at exit
- $5,949
- IRR
- 76.7%
- Equity multiple
- 8.90×
- Total profit
- $88,220
- Equity at exit
- $3,450
Cash invested: $11,172 (down + closing). Projections, not guarantees.
Landlord ↔ Tenant lean methodology
- Overall (STATE)
- 90 Strongly Landlord-Friendly
- State Indiana
- 90 Strongly Landlord-Friendly · R+11
- County
- — inherits STATE
- City
- — inherits STATE
ZIP-level market 47348
- Home prices YoY
- -17.5%
- Active inventory
- 55
- Price-to-rent
- 2.5×
Monthly cashflow live
- Estimated rent
- $1,324 medium interval (Pro) →
- Mortgage (P&I)
- −$209
- Tax from tax record
- −$140 /mo · $1,686/yr
- Insurance
- −$17
- HOA
- −$0
- Vacancy / Maint / Mgmt
- −$278
- Net cashflow
- $680
Break-even live
Sensitivity live
| Price | -10% $703 | -5% $691 | +0% $680 | +5% $669 | +10% $657 |
|---|---|---|---|---|---|
| Rent | -10% $575 | -5% $628 | +0% $680 | +5% $732 | +10% $785 |
| Rate | -1.0pp $700 | -0.5pp $690 | base $680 | +0.5pp $670 | +1.0pp $659 |
UW: 25.0% down · 7.5% · 30yr · 1.5% tax · 5.0% vac · 8.0% maint · 8.0% mgmt
Financing live
Cash to close
- Down payment
- $9,975
- Closing costs
- $1,197
- Reserves months
- —
- Total cash needed
- —
Loan-product check · same deal, 3 products live
Conventional
25% down · 7.5% · 30yr
- Down + closing
- —
- Monthly P&I
- —
- Monthly cashflow
- —
- DSCR
- —
- Eligible?
- —
Personal DTI + credit; lowest rate.
DSCR
20% down · 8.5% · 30yr
- Down + closing
- —
- Monthly P&I
- —
- Monthly cashflow
- —
- DSCR
- —
- Eligible?
- —
No personal income docs; deal must DSCR.
Hard money
10% down · 12.0% · 12mo
- Down + closing
- —
- Monthly P&I
- —
- Monthly cashflow
- —
- DSCR
- —
- Eligible?
- —
Short-term bridge; refi at stabilization.
Listing history 13 events
-
2026-06-21days on market $39,900 Active 18 DOM
-
2026-06-19days on market $39,900 Active 16 DOM
-
2026-06-18days on market $39,900 Active 15 DOM
-
2026-06-17days on market $39,900 Active 14 DOM
-
2026-06-16days on market $39,900 Active 13 DOM
-
2026-06-15days on market $39,900 Active 12 DOM
-
2026-06-14days on market $39,900 Active 10 DOM
-
2026-06-12days on market $39,900 Active 9 DOM
-
2026-06-09days on market $39,900 Active 6 DOM
-
2026-06-08days on market $39,900 Active 5 DOM
-
2026-06-07days on market $39,900 Active 4 DOM
-
2026-06-05remarks 516-char remark
-
2026-06-05$39,900 Active 1 DOM
ⓘ Source: listings_history table (triggers on properties + properties_extension) + one-shot
backfill from property_details.listing_events for pre-trigger history.
Tax reassessment forecast IN · Partial reset (capped growth)
- Current annual tax
- $1,686 · $140/mo
- Projected year-2 tax
- $1,686 · $140/mo
- Expected delta
- $0/yr ($0/mo · 0.0%)
ⓘ Screening estimate from a state-policy table — verify with the county assessor before closing.
Climate risk First Street
- Flood 1/10 Low FEMA zone X (unshaded) · 0% chance over 30 yrs
- Wildfire 1/10 Low
- Heat 3/10 Moderate 7 d/yr ≥99°F today · 18 d/yr by 30 yrs out
- Wind 2/10 Low 0% chance of damaging wind over 30 yrs
- Air quality 3/10 Moderate 2 unhealthy d/yr today · 4 by 30 yrs out
Nearby sold comps map
Loading sold comps map…
Walkable amenities ~0.75 mi
Loading nearby amenities…
Taxation est. · year 1
- Rental income
- $15,894
- − Mortgage interest
- −$2,235
- − Property taxes
- −$1,686
- − Insurance
- −$200
- − Repairs & maintenance
- −$1,271
- − Management
- −$1,271
- − Depreciation
- −$1,161
- Taxable income
- $8,069
- Est. tax owed @ 24.0%
- −$1,937
- After-tax cash flow
- $6,223/yr
For passive investors: Depreciation is non-cash, so a rental often shows a tax loss while cash-flowing — sheltering income. Rental losses are passive: they offset passive income freely, and up to $25,000/yr can offset ordinary (W-2) income if you actively participate and your MAGI is under $100k (phasing out to $0 by $150k); unused losses carry forward. On sale, claimed depreciation is recaptured at up to 25%, and gains may owe capital-gains tax (a 1031 exchange can defer both). Figures are a year-1 estimate at your 24.0% rate — not tax advice; consult a CPA.
Schools (NCES district)
- District
- Blackford County Schools
- NCES district ID
- 1800570
- Math proficiency
- 37% ▼ -12.00%
- Reading proficiency
- 41% ▼ -5.00%
- Median HH income
- $39,653
- Composite
- 32.67/100
- National rank
- #5656
- State rank
- #164 of 301 in IN
Livability — Hartford City
- Score
- 66/100
- State rank
- #303
- US rank
- #12079
Category grades
Schools grade is shown separately in the Schools card above.
Census & demographics
- Census place
- Hartford City, IN
- Population (ZIP)
- 8,986
Population outlook (Blackford County) Hauer SSP2
- Today (2025)
- 11,183 people
- By 2030
- 10,542 · -5.7%
- By 2040
- 9,292 · -16.9%
- By 2050
- 8,176 · -26.9%
- By 2075
- 6,549 · -41.4%
- By 2100
- 5,636 · -49.6%
Race, ethnicity, and origin ACS 2023
- Neighborhood character
- Predominantly White (96%)
- Race & ethnicity
- White 96% Two or more races 3% Hispanic / Latino 2%
- Common ancestry
- Slovak 3% Lithuanian 3% Scotch-Irish 1%
- Foreign-born
- 1% · Canada
- Languages at home
- 98% English-only · Spanish 1%
Political lean MEDSL · Blackford
- 2024 margin
- Solid R (+50.3) · D 23.9% · R 74.2% · Other 1.9%
- 2008→2024 swing
- -50.1pp toward R · 2008: -0.2pp · 2024: -50.3pp
- All cycles
- 2024: R+50.3 2020: R+46.1 2016: R+43.7 2012: R+16.5 2008: R+0.2
Not yet ingested
- Civics
- —
Market trends
- HPI YoY
- ▼ -47.19%
- Current HPI
- 223.0485
- Rent YoY
- —
- Metro
- —
- State GDP YoY
- ▲ 2.90%
- F500 in state
- 18
Industry mix (Fortune 500 HQ in IN)
| Industry | F500 HQs | Revenue |
|---|---|---|
| Industrial Machinery | 2 | $37B |
|
||
| Healthcare | 1 | $177B |
|
||
| Pharmaceuticals | 1 | $45B |
|
||
| Metals / Steel | 1 | $18B |
|
||
| Agriculture | 1 | $17B |
|
||
| Packaging | 1 | $12B |
|
||
Price history
-20.0% since first listed5 events — show timeline
- 2026-06-02 Listed $39,900 IRMLS
- 2026-06-02 Listed $39,900 MIBOR as Distributed by MLS Grid
- 2020-06-29 Listed $20,600 IRMLS
- 2015-06-26 Listed $44,000 IRMLS
- 2014-12-07 Listed $49,900 IRMLS
Property tax history
+21.0%/yrLatest (2025): $1,686 · +6.0% YoY. Source: county tax records.
Cash-flow waterfall
monthlySold comps — $/sqft
last 12 mo · ≤1 miLoading sold comps…