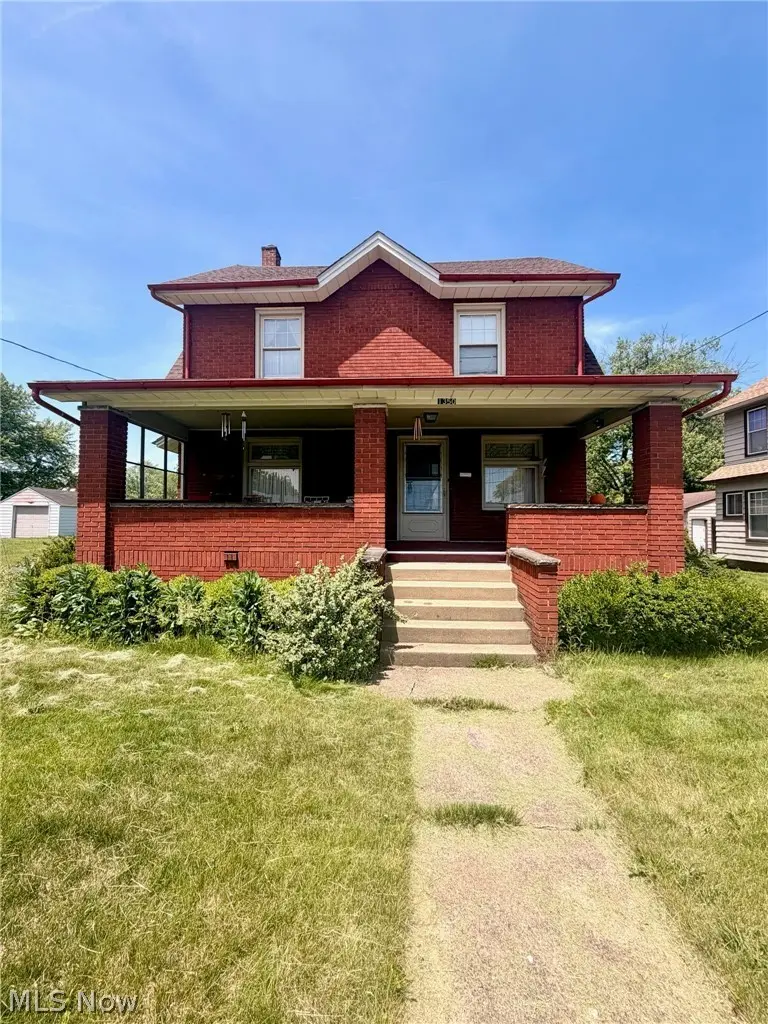
1350 E Florida Ave · Youngstown, OH
Flood risk 1/10 · Minimal
- FEMA flood zone
- X (unshaded)
- Chance of flooding over 30 yrs
- 0.0%
- Est. flood insurance / yr
- $473 – $860
Fire risk 1/10 · Minimal
- Est. fire insurance / yr
- $713 – $1,323
Heat risk 3/10 · Minor
- Hot days now (above 97°F)
- 7 days/yr
- Hot days in 30 yrs
- 17 days/yr
Wind risk 1/10 · Minimal
- Chance of severe wind over 30 yrs
- —
Air-quality risk 3/10 · Minor
- Unhealthy air days now
- 1 days/yr
- Unhealthy air days in 30 yrs
- 4 days/yr
Risk factors via First Street. Map © Google.
Why this score? — see what drove the B- grade
The composite is a weighted blend of 9 inputs, each scored 0–100. Each bar is that input's sub-score; the figure is the points it added to the 100-point composite (weight × sub-score).
- Cash flow +30.0/30.0
- DSCR +10.0/10.0
- 1% rule +9.8/10.0
- Appreciation +5.9/10.0
- Livability +4.0/5.0
- Rent growth +2.5/5.0
- Condition / age +2.5/5.0
- Schools +0.9/10.0
- ARV discount +0.0/15.0
$99,900
🖨 Deal sheet 📄 Offer letter ✓ Due diligence
Listing remarks MLS
Welcome home to your charming, well maintained new home! This all-brick home features 4 spacious bedrooms, an eat in kitchen, dining room with gorgeous built-ins, and a beautiful fireplace in the living room! The unfinished basement could be finished to allow for additional living space. The covered front porch is the perfect place for your morning coffee or your after-dinner relaxation time. This home is filled with charming touches, arched doorways, and has a mid-century modern feel. With ample storage and even a bonus room that can be an office, or a play room, you can't pass this up!! The location is perfect- close to the freeway, dining, shopping and entertaining. Book your viewing today, you won't want to miss this one. Broker owned.
Key facts
- Covered front porch
- Built-in cabinetry
- Classic fireplace
Tags
Property features AI
Finance
- Financial info: Annual tax amount available
Exterior
- Parking: Detached 2-car garage; Driveway; Garage faces front
- Utilities: Public water; Public sewer
- Home design: 2-story brick home; Entry level: main; Roof: asphalt/fiberglass
- Construction: Brick construction; Asphalt/fiberglass roof; Full unfinished basement with storage
- Exterior features: Front porch
Interior
- Kitchen: Range; Refrigerator
- Bedrooms: Total rooms: 7
- Bathrooms: 1 full bathroom
- Heating & cooling: Forced-air heating (gas); Fireplace heat source; 1 fireplace
- Interior features: Window treatments; Built-in storage; Natural woodwork
- Laundry & utility: Washer and dryer located in the basement
Neighborhood map
What this means for you Summary
Snapshot
- This is a 4-bed/1.0-bath single-family listed at $100k.
Deal economics
- At list price, monthly cash flow is $554 ($7k/yr) — positive.
- The deal already cash-flows at list — no discount required.
- Meets the 1% rule at list price ($1k rent vs $100k).
- Cap rate 12.9% vs local median 7.0% in Youngstown — top-decile yield for the area; either an underpriced asset or a hidden risk that comps aren't pricing in. Stress-test before assuming the spread holds.
Location & tenants
- Location reads 81/100 on livability (#99 in OH, #1,506 nationally) — a professional / high-income tenant draw. Strengths: amenities A+, commute A+, cost of living A+; Watch: crime F, employment F.
- Youngstown City (urban): math 8% / reading 17% proficiency, ranked #649 of 656 in OH (top 99%) — low school quality limits family demand, transient renter base, plan for 1-2y turnover; 88% free/reduced lunch — lower-income household profile, screen leases tightly.
- Market conditions: 45 active listings in the ZIP; 6 comparable units currently listed for rent nearby; rentals at typical pace (median 21d on market — plan ~3-4 weeks tenant-placement turnaround); lower-income renter base — watch delinquency; 147 units permitted in Mahoning County in 2024 (0 in 5+ unit buildings).
- At $1,480/mo this rent would consume 57% of the median local household income ($31k/yr) (locally 566% of renters already pay >50% of income on rent) — very limited rent-growth headroom before tenants either downsize or default.
Forward outlook
- In year one you build about $2k of equity ($691 loan paydown + $2k appreciation (1.8% local appreciation)).
- Mahoning County population projected at -14% by 2050 — secular population decline; favor cash flow + early exit over multi-decade hold.
- At projected returns (1.8% appreciation + 3.0% rent growth), your $28k cash investment doubles in ~3 years — after that, you're playing with house money.
Negotiation context
- Only 7 days on market — expect competitive offers; lowballing is unlikely to land.
- 3 sale attempts with the ask held roughly flat each time — persistent listings suggest the price (not the market) is what's stuck; bring a comps-based counter.
Risks & watch-outs
- Watch-outs: built in 1929 — expect roof / HVAC / electrical / plumbing capex.
Questions for the listing agent
- Built in 1929 — when were the roof, HVAC, electrical panel, plumbing, and water heater last replaced?
- Is there a deadline driving the sale (1031 exchange, divorce, estate, relocation)? That informs how much negotiation room exists.
- Crime grade is F in this area — have there been break-ins, vandalism, or insurance claims at this property in the last 3 years? What carrier currently insures it and at what premium?
- What's the average days-on-market for RENTAL listings here right now (not sales)? A rising rental-DOM trend means longer vacancies and softer asking-rent achievability than the comps imply.
- What's the recent tenant-quality profile in this submarket — average credit score on applications, eviction rate, late-payment / NSF rate, and stable-employment percentage? A property-management company in the area should have these aggregated.
- How much new for-sale + rental construction is in the pipeline within 1–3 miles? Heavy new supply typically softens prices + rents 12–24 months out; constrained supply supports both.
Investment metrics
- 1% rule
- 1.48% ✓
- Cap rate
- 12.95%
- Cash-on-cash
- 23.76%
- DSCR
- 2.06
- GRM
- 5.6
CMA / ARV
- ARV (on-the-fly)
- $68,364
- Comps found
- 12
Show comp detail 12 sales within ~0.75 mi
| Address | Dist | Beds/Ba | Sqft | Sold | Price | $/sf | Match |
|---|---|---|---|---|---|---|---|
| 1210 Aberdeen Ave | 0.23mi | 3/2.0 (-1) | 1,316 (+4%) | 1mo | $177,000 | $134 | 73 |
| 1208 Aberdeen Ave | 0.23mi | 3/2.0 (-1) | 1,316 (+4%) | 2mo | $175,000 | $133 | 72 |
| 1122 Inverness Ave | 0.41mi | 3/2.0 (-1) | 1,309 (+3%) | 4mo | $126,900 | $97 | 63 |
| 827 E Avondale Ave | 0.54mi | 3/1.0 (-1) | 1,224 (-3%) | 4mo | $64,000 | $52 | 61 |
| 1447 Humbolt Ave | 0.13mi | 3/2.0 (-1) | 1,413 (+12%) | 8mo | $62,000 | $44 | 59 |
| 760 E Lucius Ave | 0.62mi | 4/1.0 | 1,224 (-3%) | 10mo | $30,000 | $25 | 58 |
| 3551 Shirley Rd | 0.48mi | 3/2.0 (-1) | 1,341 (+6%) | 2mo | $142,000 | $106 | 57 |
| 708 Miller St | 0.71mi | 3/1.0 (-1) | 1,304 (+3%) | 1mo | $55,000 | $42 | 56 |
| 1140 Inverness Ave | 0.40mi | 3/2.0 (-1) | 1,210 (-4%) | 10mo | $99,000 | $82 | 56 |
| 805 E Boston Ave | 0.56mi | 3/1.0 (-1) | 1,335 (+6%) | 6mo | $68,000 | $51 | 55 |
| 1709 S Heights Ave | 0.72mi | 3/2.0 (-1) | 1,216 (-4%) | 6mo | $66,000 | $54 | 45 |
| 824 Pasadena Ave | 0.69mi | 4/1.5 | 1,152 (-9%) | 10mo | $60,000 | $52 | 42 |
Match score weights: distance 35% · size 25% · config 20% · recency 20%. Top-matched comps best support the ARV.
Projected returns pro-forma
1.78% appreciation · 3.0% rent growth · sell at horizon
- IRR
- 27.5%
- Equity multiple
- 2.46×
- Total profit
- $40,972
- Equity at exit
- $38,201
- IRR
- 29.3%
- Equity multiple
- 4.74×
- Total profit
- $104,664
- Equity at exit
- $54,102
Cash invested: $27,972 (down + closing). Projections, not guarantees.
Landlord ↔ Tenant lean methodology
- Overall (STATE)
- 73 Landlord-Friendly
- State Ohio
- 73 Landlord-Friendly · R+6
- County
- — inherits STATE
- City
- — inherits STATE
ZIP-level market 44502
- Home prices YoY
- 0.7%
- Active inventory
- 45
- Price-to-rent
- 5.6×
Monthly cashflow live
- Estimated rent
- $1,480 high interval (Pro) →
- Mortgage (P&I)
- −$524
- Tax from tax record
- −$50 /mo · $600/yr
- Insurance
- −$42
- HOA
- −$0
- Vacancy / Maint / Mgmt
- −$311
- Net cashflow
- $554
Break-even live
UW: 25.0% down · 7.5% · 30yr · 1.5% tax · 5.0% vac · 8.0% maint · 8.0% mgmt
Financing live
Cash to close
- Down payment
- $24,975
- Closing costs
- $2,997
- Reserves months
- —
- Total cash needed
- —
Loan-product check · same deal, 3 products live
Conventional
25% down · 7.5% · 30yr
- Down + closing
- —
- Monthly P&I
- —
- Monthly cashflow
- —
- DSCR
- —
- Eligible?
- —
Personal DTI + credit; lowest rate.
DSCR
20% down · 8.5% · 30yr
- Down + closing
- —
- Monthly P&I
- —
- Monthly cashflow
- —
- DSCR
- —
- Eligible?
- —
No personal income docs; deal must DSCR.
Hard money
10% down · 12.0% · 12mo
- Down + closing
- —
- Monthly P&I
- —
- Monthly cashflow
- —
- DSCR
- —
- Eligible?
- —
Short-term bridge; refi at stabilization.
Rent comps 6 comps
| Address | Beds | Baths | Sqft | Rent | $/sqft | DOM | Units | Dist |
|---|---|---|---|---|---|---|---|---|
| 3446 Ambert Ave Youngstown, OH | 4.0 | 1.0 | 1100 | $1,250 | $1.14 | 13d | 1 | 0.50mi |
| 1914 S Heights Ave Youngstown, OH | 3.0 | 1.0 | 1115 | $1,950 | $1.75 | 43d | 1 | 0.82mi |
| 540 Cameron Ave Youngstown, OH | 4.0 | 2.0 | 1780 | $1,300 | $0.73 | 21d | 1 | 0.92mi |
| 236 Hilton Ave Youngstown, OH | 4.0 | 1.5 | 1488 | $1,195 | $0.80 | 21d | 1 | 1.22mi |
| 610 Elm St Struthers, OH | 3.0 | 1.0 | 1050 | $1,500 | $1.43 | 13d | 1 | 1.38mi |
| 4807 Sheridan Rd Youngstown, OH | 3.0 | 1.5 | 1586 | $1,750 | $1.10 | 13d | 1 | 1.41mi |
Listing history 7 events
-
2026-06-19days on market $99,900 Active 7 DOM
-
2026-06-18days on market $99,900 Active 6 DOM
-
2026-06-17days on market $99,900 Active 5 DOM
-
2026-06-16days on market $99,900 Active 4 DOM
-
2026-06-15days on market $99,900 Active 3 DOM
-
2026-06-13remarks 699-char remark
-
2026-06-13$99,900 Active 1 DOM
ⓘ Source: listings_history table (triggers on properties + properties_extension) + one-shot
backfill from property_details.listing_events for pre-trigger history.
Tax reassessment forecast OH · Partial reset (capped growth)
- Current annual tax
- $600 · $50/mo
- Projected year-2 tax
- $1,079 · $90/mo
- Expected delta
- +$479/yr (+$40/mo · 80.0%)
ⓘ Screening estimate from a state-policy table — verify with the county assessor before closing.
Climate risk First Street
- Flood 1/10 Low FEMA zone X (unshaded) · 0% chance over 30 yrs
- Wildfire 1/10 Low
- Heat 3/10 Moderate 7 d/yr ≥97°F today · 17 d/yr by 30 yrs out
- Wind 1/10 Low
- Air quality 3/10 Moderate 1 unhealthy d/yr today · 4 by 30 yrs out
Nearby sold comps map
Loading sold comps map…
Walkable amenities ~0.75 mi
Loading nearby amenities…
Taxation est. · year 1
- Rental income
- $17,762
- − Mortgage interest
- −$5,596
- − Property taxes
- −$600
- − Insurance
- −$500
- − Repairs & maintenance
- −$1,421
- − Management
- −$1,421
- − Depreciation
- −$2,906
- Taxable income
- $5,319
- Est. tax owed @ 24.0%
- −$1,277
- After-tax cash flow
- $5,370/yr
For passive investors: Depreciation is non-cash, so a rental often shows a tax loss while cash-flowing — sheltering income. Rental losses are passive: they offset passive income freely, and up to $25,000/yr can offset ordinary (W-2) income if you actively participate and your MAGI is under $100k (phasing out to $0 by $150k); unused losses carry forward. On sale, claimed depreciation is recaptured at up to 25%, and gains may owe capital-gains tax (a 1031 exchange can defer both). Figures are a year-1 estimate at your 24.0% rate — not tax advice; consult a CPA.
Schools (NCES district)
- District
- Youngstown City
- NCES district ID
- 3904516
- Math proficiency
- 8% ▼ -15.00%
- Reading proficiency
- 17% ▼ -10.00%
- Median HH income
- $25,257
- Composite
- 9.29/100
- National rank
- #9858
- State rank
- #649 of 656 in OH
Livability — Youngstown
- Score
- 81/100
- State rank
- #99
- US rank
- #1506
Category grades
Schools grade is shown separately in the Schools card above.
Census & demographics
- Census place
- Youngstown, OH
- County
- Mahoning County · 84,956 people
- City population
- 28,503
- Metro
- Youngstown-Warren-Boardman, OH-PA
- Population (ZIP)
- 9,594
- Household income
- $31,170
- Rent vs Own
- Severe rent burden
- 566.0
Population outlook (Mahoning County) Hauer SSP2
- Today (2025)
- 223,932 people
- By 2030
- 218,387 · -2.5%
- By 2040
- 205,367 · -8.3%
- By 2050
- 193,606 · -13.5%
- By 2075
- 173,694 · -22.4%
- By 2100
- 151,147 · -32.5%
Race, ethnicity, and origin ACS 2023
- Neighborhood character
- Diverse neighborhood (Simpson 0.67)
- Race & ethnicity
- White 44% Black 35% Two or more races 12% Hispanic / Latino 11%
- Hispanic origin (detail)
- Mexican 1% Puerto Rican 9%
- Common ancestry
- Romanian 2% Serbian 1% Iranian 1%
- Foreign-born
- 4% · Canada
- Languages at home
- 91% English-only · Spanish 6% Other Indo-European 1% Arabic 1%
Political lean MEDSL · Mahoning
- 2024 margin
- Lean R (+9.4) · D 44.9% · R 54.4%
- 2008→2024 swing
- -36.1pp toward R · 2008: 26.6pp · 2024: -9.4pp
- All cycles
- 2024: R+9.4 2020: R+1.9 2016: D+3.0 2012: D+27.7 2008: D+26.6
Not yet ingested
- Civics
- —
Market trends
- HPI YoY
- ▲ 1.78%
- Current HPI
- 246.2163
- Rent YoY
- —
- Metro
- Youngstown-Warren-Boardman, OH-PA
- State GDP YoY
- ▲ 1.98%
- F500 in state
- 48
Industry mix (Fortune 500 HQ in OH)
| Industry | F500 HQs | Revenue |
|---|---|---|
| Insurance | 3 | $145B |
|
||
| Industrial Machinery | 3 | $49B |
|
||
| Financial Services | 3 | $24B |
|
||
| Consumer Goods | 2 | $93B |
|
||
| Aerospace / Defense | 2 | $47B |
|
||
| Utilities | 2 | $33B |
|
||
Price history
+11.1% since first listed8 events — show timeline
- 2026-06-12 Listed $99,900 MLSNOW
- 2025-05-01 Sold (Public Records) $92,000 Public Records
- 2025-05-01 Sold (MLS) $92,000 MLSNOW
- 2025-04-28 Pending — MLSNOW
- 2025-03-28 Contingent — MLSNOW
- 2025-03-25 Relisted — MLSNOW
- 2025-03-20 Pending — MLSNOW
- 2025-03-19 Listed $89,900 MLSNOW
Property tax history
+22.6%/yrLatest (2025): $600 · +204.0% YoY. Source: county tax records.
Cash-flow waterfall
monthlySold comps — $/sqft
last 12 mo · ≤1 miLoading sold comps…