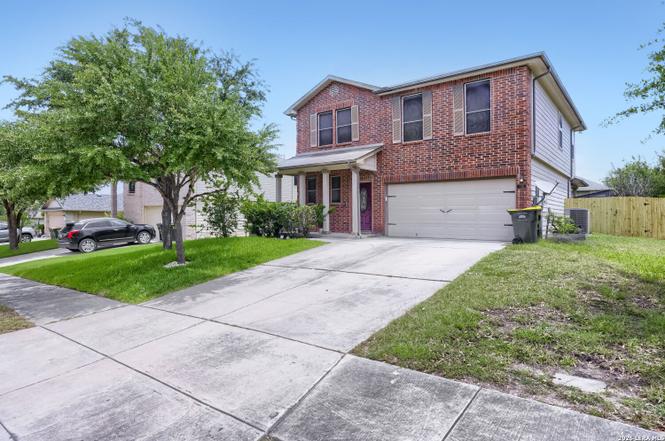
715 Eagles Gln · Schertz, TX
Flood risk 1/10 · Minimal
- FEMA flood zone
- X (unshaded)
- Chance of flooding over 30 yrs
- 0.0%
- Est. flood insurance / yr
- $507 – $1,088
Fire risk 5/10 · Moderate
- Est. fire insurance / yr
- $1,222 – $2,270
Heat risk 8/10 · Major
- Hot days now (above 107°F)
- 7 days/yr
- Hot days in 30 yrs
- 22 days/yr
Wind risk 8/10 · Major
- Chance of severe wind over 30 yrs
- 80.0%
Air-quality risk 1/10 · Minimal
- Unhealthy air days now
- 0 days/yr
- Unhealthy air days in 30 yrs
- 0 days/yr
Risk factors via First Street. Map © Google.
Why this score? — see what drove the D+ grade
The composite is a weighted blend of 9 inputs, each scored 0–100. Each bar is that input's sub-score; the figure is the points it added to the 100-point composite (weight × sub-score).
- ARV discount +12.2/15.0
- Cash flow +9.0/30.0
- Appreciation +5.2/10.0
- Schools +4.4/10.0
- Livability +3.7/5.0
- 1% rule +3.3/10.0
- Rent growth +3.1/5.0
- DSCR +2.5/10.0
- Condition / age +2.5/5.0
$259,000
🖨 Deal sheet (PDF) 📄 Offer letter ✓ Due diligence
Listing remarks MLS
BEAUTIFUL, GENTLY LIVED IN HOME READY FOR A NEW OWNER. GORGEOUS BAMBOO WOOD FLOORS DOWNSTAIRS AND ON THE STAIRS. HOME FEATURES 2 LIVING AREAS, TWO DINING AREAS, SPRINKLER SYSTEM AND A LARGE BACK YARD. GREAT LOCATION IN A WONDERFUL COMMUNITY WITH BEAUTIFUL POOL AND PARK. CLOSE TO EVERYTHING WITH LOW GUADALUPE TAXES CLIENTS WILL LOVE THIS HOME.
Key facts
- Breakfast nook
- Open floor plan
- Covered patio
Tags
Property features AI
Finance
- HOA & community: Mandatory HOA; Neighborhood amenities include a pool and a park/playground; HOA fee $396 annually; Association transfer fee $250
Exterior
- Parking: 2-car garage
- Utilities: Water system available; Sewer system available
- Home design: Pre-owned brick home; Approximately 19 years old; Slab foundation; Composition roof
- Construction: Brick exterior; Slab foundation; Composition roofing
- Exterior features: Covered patio with patio slab; Privacy fence
Interior
- Kitchen: Built-in oven; Stove/Range; Dishwasher; Garbage disposal; Eat-in kitchen (11 x 11)
- Bedrooms: Primary bedroom with full bath (19 x 12); Bedroom 2 (10 x 13); Bedroom 3 (11 x 13)
- Flooring: Carpeting; Ceramic tile floors
- Bathrooms: Two full bathrooms and one half bathroom; Primary bath with separate tub and shower and garden tub (13 x 8)
- Heating & cooling: Central heating (electric); Central air conditioning
- Interior features: Ceiling fans throughout; Two living areas with a loft; Living/dining room combination plus separate dining room; Eat-in kitchen and breakfast area; Utility room located inside; All bedrooms are on the upper level; All window coverings remain
- Laundry & utility: Washer and dryer connections; Utility room (9 x 5) inside the home
Neighborhood map
What this means for you Summary
Snapshot
- This is a 3-bed/2.5-bath single-family listed at $259k.
Deal economics
- At list price, monthly cash flow is $-203 ($-2k/yr) — negative.
- To cash-flow at today's rent, offer at most $223k (13.9% below list).
- To meet the 1% rule (rent ≥ 1% of price), the offer needs to be $216k (16.6% below list).
- Recommended offer: $216k (16.6% below list) — sets the bar for 1% rule.
- Cap rate 5.4% vs local median 2.9% in Schertz — top-decile yield for the area; either an underpriced asset or a hidden risk that comps aren't pricing in. Stress-test before assuming the spread holds.
Location & tenants
- Location reads 73/100 on livability (#198 in TX) — a middle-class / working-renter tenant base. Strengths: employment A+, housing A+, crime A; Watch: health & safety D+, amenities F, commute F.
- Schertz-Cibolo-U City ISD (suburban): math 49% / reading 48% proficiency, ranked #152 of 826 in TX (top 18%) — families likely to look elsewhere, expect single-tenant / working-renter base with shorter leases.
- Zoned schools: John A Sippel El (math 40% / reading 41%, grade F, #1,490 of 4,322 statewide, top 35%, 743 students, 35% FRL); Dobie J H (math 51% / reading 53%, grade C+, #301 of 1,662 statewide, top 19%, 1,347 students, 31% FRL); Byron P Steele Ii H S (math 68% / reading 66%, grade B, #163 of 1,632 statewide, top 11%, 2,716 students, 25% FRL) — zoned schools at 30% FRL track the district average.
- Market conditions: Rents rising (+2.4%/yr); 761 active listings in the ZIP; 21 comparable units currently listed for rent nearby; rentals at typical pace (median 26d on market — plan ~3-4 weeks tenant-placement turnaround); high-income renter base; 2,064 units permitted in Guadalupe County in 2024 (133 in 5+ unit buildings).
Forward outlook
- In year one you build about $3k of equity ($2k loan paydown + $1k appreciation (0.5% local appreciation)).
- Guadalupe County population projected at +61% by 2050 — long-run rental-demand tailwind backs the buy-and-hold thesis.
- By year 9, paydown + projected appreciation supports a ~$31k cash-out refi (75% LTV) — recoverable capital for the next deal without selling this one.
Negotiation context
- It's been on market 19 days — a 2% lower offer ($255k) is reasonable based on typical stale-listing flexibility.
- 9 sale attempts since 16y ago with the ask held roughly flat each time — persistent listings suggest the price (not the market) is what's stuck; bring a comps-based counter.
Risks & watch-outs
- Climate carrying-cost: severe wind risk, 80% chance of damaging wind over 30y; moderate wildfire risk; extreme-heat days projected 7→22/yr by 2055 (HVAC capex compounding) — expect insurance premiums to compound above CPI over the hold.
Questions for the listing agent
- What do current leases actually rent for vs. the listed asking? Can we see a recent rent roll and the last 12 months of T-12 income?
- What does the HOA fee cover, when was the last increase, and are there any pending special assessments or reserve-fund shortfalls?
- Is there a deadline driving the sale (1031 exchange, divorce, estate, relocation)? That informs how much negotiation room exists.
- The area grade is low — what's the realistic commute time and amenity access for the typical tenant pool here? Any planned neighborhood developments (good or bad) we should know about?
- What's the average days-on-market for RENTAL listings here right now (not sales)? A rising rental-DOM trend means longer vacancies and softer asking-rent achievability than the comps imply.
- What's the recent tenant-quality profile in this submarket — average credit score on applications, eviction rate, late-payment / NSF rate, and stable-employment percentage? A property-management company in the area should have these aggregated.
- How much new for-sale + rental construction is in the pipeline within 1–3 miles? Heavy new supply typically softens prices + rents 12–24 months out; constrained supply supports both.
Investment metrics
- 1% rule
- 0.83% ✗
- Cap rate
- 5.35%
- Cash-on-cash
- -3.36%
- DSCR
- 0.85
- GRM
- 10.0
CMA / ARV
- ARV (on-the-fly)
- $289,340
- Comps found
- 12
Show comp detail 12 sales within ~0.75 mi
| Address | Dist | Beds/Ba | Sqft | Sold | Price | $/sf | Match |
|---|---|---|---|---|---|---|---|
| 2828 Ashwood | 0.21mi | 3/2.0 | 1,947 (-0%) | 9mo | $320,000 | $164 | 80 |
| 2977 Ashwood | 0.23mi | 3/2.5 | 2,114 (+8%) | 3mo | $296,000 | $140 | 73 |
| 2820 Mineral Spgs | 0.21mi | 3/2.0 | 2,092 (+7%) | 5mo | $350,000 | $167 | 72 |
| 3330 Charleston | 0.66mi | 3/2.0 | 1,996 (+2%) | 1mo | $330,000 | $165 | 63 |
| 569 Foxford Run Dr | 0.65mi | 3/2.5 | 1,928 (-1%) | 7mo | $243,900 | $127 | 62 |
| 2512 Sir Barton Bay Dr | 0.63mi | 3/2.5 | 1,928 (-1%) | 9mo | $255,000 | $132 | 61 |
| 2617 Crusader | 0.39mi | 3/2.0 | 1,745 (-11%) | 2mo | $269,900 | $155 | 60 |
| 2541 Hourless Oaks | 0.55mi | 3/2.0 | 1,985 (+2%) | 11mo | $315,000 | $159 | 60 |
| 5013 Whisper Cv | 0.70mi | 3/2.5 | 1,953 (-0%) | 12mo | $275,000 | $141 | 57 |
| 2557 Sir Barton Bay | 0.50mi | 3/2.5 | 2,195 (+12%) | 1mo | $325,000 | $148 | 56 |
| 520 Foxford Run Dr | 0.63mi | 3/2.5 | 2,152 (+10%) | 8mo | $310,000 | $144 | 48 |
| 714 Secretariat | 0.61mi | 3/2.5 | 2,152 (+10%) | 11mo | $315,000 | $146 | 46 |
Match score weights: distance 35% · size 25% · config 20% · recency 20%. Top-matched comps best support the ARV.
Projected returns pro-forma
0.47% appreciation · 2.42% rent growth · sell at horizon
- IRR
- -4.5%
- Equity multiple
- 0.78×
- Total profit
- $-15,883
- Equity at exit
- $81,355
- IRR
- 0.7%
- Equity multiple
- 1.08×
- Total profit
- $5,499
- Equity at exit
- $102,845
Cash invested: $72,520 (down + closing). Projections, not guarantees.
Landlord ↔ Tenant lean methodology
- Overall (STATE)
- 87 Strongly Landlord-Friendly
- State Texas
- 87 Strongly Landlord-Friendly · R+5
- County
- — inherits STATE
- City
- — inherits STATE
ZIP-level market 78108
- Home prices YoY
- 0.3%
- Rents YoY
- 2.4%
- Active inventory
- 761
- Price-to-rent
- 10.0×
Monthly cashflow live
- Estimated rent
- $2,160 high interval (Pro) →
- Mortgage (P&I)
- −$1,358
- Tax from tax record
- −$410 /mo · $4,926/yr
- Insurance
- −$108
- HOA
- −$33
- Vacancy / Maint / Mgmt
- −$454
- Net cashflow
- $-203
Break-even live
Sensitivity live
| Price | -10% $-57 | -5% $-130 | +0% $-203 | +5% $-276 | +10% $-350 |
|---|---|---|---|---|---|
| Rent | -10% $-374 | -5% $-288 | +0% $-203 | +5% $-118 | +10% $-33 |
| Rate | -1.0pp $-73 | -0.5pp $-137 | base $-203 | +0.5pp $-270 | +1.0pp $-339 |
UW: 25.0% down · 7.5% · 30yr · 1.5% tax · 5.0% vac · 8.0% maint · 8.0% mgmt
Financing live
Cash to close
- Down payment
- $64,750
- Closing costs
- $7,770
- Reserves months
- —
- Total cash needed
- —
Loan-product check · same deal, 3 products live
Conventional
25% down · 7.5% · 30yr
- Down + closing
- —
- Monthly P&I
- —
- Monthly cashflow
- —
- DSCR
- —
- Eligible?
- —
Personal DTI + credit; lowest rate.
DSCR
20% down · 8.5% · 30yr
- Down + closing
- —
- Monthly P&I
- —
- Monthly cashflow
- —
- DSCR
- —
- Eligible?
- —
No personal income docs; deal must DSCR.
Hard money
10% down · 12.0% · 12mo
- Down + closing
- —
- Monthly P&I
- —
- Monthly cashflow
- —
- DSCR
- —
- Eligible?
- —
Short-term bridge; refi at stabilization.
Rent comps 21 comps
| Address | Beds | Baths | Sqft | Rent | $/sqft | DOM | Units | Dist |
|---|---|---|---|---|---|---|---|---|
| 741 Clearbrook Ave Schertz, TX | 4.0 | 2.0 | 2259 | $2,195 | $0.97 | 0d | 1 | 0.08mi |
| 741 Clearbrook Ave Schertz, TX | 4.0 | 2.0 | 2259 | $2,195 | $0.97 | 25d | 1 | 0.08mi |
| 571 American Flag Schertz, TX | 3.0 | 2.5 | 2380 | $2,200 | $0.92 | 23d | 1 | 0.43mi |
| 3406 Sherwin Dr Schertz, TX | 3.0 | 2.5 | 1819 | $1,950 | $1.07 | 25d | 1 | 0.65mi |
| 3410 Sherwin Dr Schertz, TX | 3.0 | 2.5 | 2329 | $1,850 | $0.79 | 5d | 1 | 0.66mi |
| 3401 Charleston Ln Cibolo, TX | 4.0 | 3.0 | 2403 | $2,995 | $1.25 | 25d | 1 | 0.71mi |
| 4909 Tiffany Ln Schertz, TX | 3.0 | 2.0 | 1434 | $1,629 | $1.14 | 25d | 1 | 0.74mi |
| 3438 Columbia Dr Cibolo, TX | 3.0 | 2.5 | 2312 | $1,970 | $0.85 | 45d | 1 | 0.81mi |
| 920 Foxbrook Way Cibolo, TX | 4.0 | 3.0 | 2403 | $2,350 | $0.98 | 25d | 1 | 0.92mi |
| 3301 Orth Ave Schertz, TX | 3.0 | 2.0 | 1654 | $2,200 | $1.33 | 4d | 1 | 1.05mi |
| 325 Cortijo Cibolo, TX | 4.0 | 2.0 | 2080 | $2,350 | $1.13 | 6d | 1 | 1.18mi |
| 18508 Ripps Kreusler Schertz, TX | 1.0–3.0 | 1.0–2.5 | 1061 | $2,499 | $2.36 | 0d | 54 | 1.21mi |
| 5708 Mahogany Bay Schertz, TX | 4.0 | 2.5 | 2372 | $1,950 | $0.82 | 45d | 1 | 1.21mi |
| 428 Kings Way Cibolo, TX | 4.0 | 2.0 | 1730 | $2,099 | $1.21 | 25d | 1 | 1.25mi |
| 125 Creek Run Cibolo, TX | 4.0 | 2.5 | 2550 | $1,850 | $0.73 | 25d | 1 | 1.29mi |
| 5744 Columbia Dr Cibolo, TX | 3.0 | 2.5 | 2405 | $2,029 | $0.84 | 25d | 1 | 1.30mi |
| 5248 Columbia Dr Cibolo, TX | 3.0 | 2.0 | 1745 | $1,800 | $1.03 | 25d | 1 | 1.39mi |
| 5125 Columbia Dr Cibolo, TX | 4.0 | 3.0 | 2606 | $2,095 | $0.80 | 25d | 1 | 1.43mi |
| 204 N Willow Way Cibolo, TX | 3.0 | 2.0 | 1724 | $1,750 | $1.02 | 6d | 1 | 1.44mi |
| 5244 Brookline Schertz, TX | 3.0 | 2.0 | 1758 | $1,750 | $1.00 | 25d | 1 | 1.46mi |
| 224 Willow Crst Cibolo, TX | 3.0 | 2.5 | 2275 | $1,750 | $0.77 | 25d | 1 | 1.46mi |
HOA detail
- Monthly dues
- $33 · $396/yr
- Likely covers
- pool
Listing history 13 events
-
2026-06-21statusdays on market $259,000 Active 19 DOM
-
2026-06-18days on market $259,000 Price Change 16 DOM
-
2026-06-17days on market $259,000 Price Change 15 DOM
-
2026-06-16days on market $259,000 Price Change 14 DOM
-
2026-06-15days on market $259,000 Price Change 13 DOM
-
2026-06-13days on market $259,000 Price Change 11 DOM
-
2026-06-13days on market $259,000 Price Change 10 DOM
-
2026-06-09pricestatusdays on market $259,000 Price Change 7 DOM
-
2026-06-08days on market $269,000 New 6 DOM
-
2026-06-07days on market $269,000 New 5 DOM
-
2026-06-04days on market $269,000 New 2 DOM
-
2026-06-02remarks 699-char remark
-
2026-06-02$269,000 New 1 DOM
ⓘ Source: listings_history table (triggers on properties + properties_extension) + one-shot
backfill from property_details.listing_events for pre-trigger history.
Tax reassessment forecast TX · Resets to sale price
- Current annual tax
- $4,926 · $410/mo
- Projected year-2 tax
- $4,926 · $410/mo
- Expected delta
- $0/yr ($0/mo · 0.0%)
ⓘ Screening estimate from a state-policy table — verify with the county assessor before closing.
Climate risk First Street
- Flood 1/10 Low FEMA zone X (unshaded) · 0% chance over 30 yrs
- Wildfire 5/10 Major
- Heat 8/10 Severe 7 d/yr ≥107°F today · 22 d/yr by 30 yrs out
- Wind 8/10 Severe 80% chance of damaging wind over 30 yrs
- Air quality 1/10 Low 0 unhealthy d/yr today · 0 by 30 yrs out
Nearby sold comps map
Loading sold comps map…
Walkable amenities ~0.75 mi
Loading nearby amenities…
Taxation est. · year 1
- Rental income
- $25,921
- − Mortgage interest
- −$14,508
- − Property taxes
- −$4,926
- − Insurance
- −$1,295
- − Repairs & maintenance
- −$2,074
- − Management
- −$2,074
- − HOA
- −$396
- − Depreciation
- −$7,535
- Taxable loss
- −$6,886
- Est. tax savings @ 24.0%
- +$1,653
- After-tax cash flow
- $-785/yr
For passive investors: Depreciation is non-cash, so a rental often shows a tax loss while cash-flowing — sheltering income. Rental losses are passive: they offset passive income freely, and up to $25,000/yr can offset ordinary (W-2) income if you actively participate and your MAGI is under $100k (phasing out to $0 by $150k); unused losses carry forward. On sale, claimed depreciation is recaptured at up to 25%, and gains may owe capital-gains tax (a 1031 exchange can defer both). Figures are a year-1 estimate at your 24.0% rate — not tax advice; consult a CPA.
Schools (NCES district)
- District
- Schertz-Cibolo-U City ISD
- NCES district ID
- 4839480
- Math proficiency
- 49% ▼ -12.00%
- Reading proficiency
- 48% ▼ -4.00%
- Median HH income
- $75,790
- Composite
- 44.02/100
- National rank
- #2886
- State rank
- #152 of 826 in TX
Livability — Schertz
- Score
- 73/100
- State rank
- #198
- US rank
- #5013
Category grades
Schools grade is shown separately in the Schools card above.
Census & demographics
- Census place
- Schertz, TX
- County
- Guadalupe County · 147,291 people
- City population
- 41,907
- Metro
- San Antonio-New Braunfels, TX
- Population (ZIP)
- 49,784
- Household income
- $113,004
- Rent vs Own
- Severe rent burden
- 521.0
Population outlook (Guadalupe County) Hauer SSP2
- Today (2025)
- 196,854 people
- By 2030
- 220,210 · +11.9%
- By 2040
- 268,004 · +36.1%
- By 2050
- 316,333 · +60.7%
- By 2075
- 434,747 · +120.8%
- By 2100
- 520,447 · +164.4%
Race, ethnicity, and origin ACS 2023
- Neighborhood character
- Diverse neighborhood (Simpson 0.68)
- Race & ethnicity
- White 46% Hispanic / Latino 30% Two or more races 22% Black 13% Asian 3%
- Hispanic origin (detail)
- Mexican 22% Puerto Rican 4%
- Common ancestry
- Italian 2% Lithuanian 2% Slovak 2%
- Foreign-born
- 7% · Canada, Vietnam, China
- Languages at home
- 83% English-only · Spanish 13% Vietnamese 1% German/W. Germanic 1%
Political lean MEDSL · Guadalupe
- 2024 margin
- Strong R (+29.5) · D 34.8% · R 64.3%
- 2008→2024 swing
- +1.5pp toward D · 2008: -31.0pp · 2024: -29.5pp
- All cycles
- 2024: R+29.5 2020: R+24.2 2016: R+31.8 2012: R+35.1 2008: R+31.0
Not yet ingested
- Civics
- —
Market trends
- HPI YoY
- ▲ 0.47%
- Current HPI
- 182.7296
- Rent YoY
- ▲ 2.42%
- Metro
- San Antonio-New Braunfels, TX
- State GDP YoY
- ▲ 3.95%
- F500 in state
- 110
Industry mix (Fortune 500 HQ in TX)
| Industry | F500 HQs | Revenue |
|---|---|---|
| Energy | 16 | $1,198B |
|
||
| Technology | 5 | $198B |
|
||
| Engineering / Construction | 4 | $72B |
|
||
| Energy Services | 3 | $60B |
|
||
| Utilities | 3 | $41B |
|
||
| Healthcare | 2 | $330B |
|
||
Price history
+50.3% since first listed24 events — show timeline
- 2026-06-02 Listed $269,000 LERA
- 2019-06-21 Sold (Public Records) — Public Records
- 2019-06-10 Pending — LERA
- 2019-06-07 Sold (MLS) — LERA
- 2019-05-08 Contingent — LERA
- 2019-05-05 Price Changed $209,900 LERA
- 2019-04-11 Listed $219,900 LERA
- 2015-04-17 Sold (Public Records) — Public Records
- 2015-04-09 Sold (MLS) — LERA
- 2015-03-18 Pending — LERA
- 2015-03-11 Contingent — LERA
- 2015-03-06 Listed $169,900 LERA
- 2015-02-23 Listing Removed — LERA
- 2015-02-05 Listed $175,000 LERA
- 2013-06-06 Listing Removed — LERA
- 2013-04-01 Listed $169,500 LERA
- 2013-03-15 Listing Removed — LERA
- 2013-03-07 Listed $172,500 LERA
- 2012-04-17 Listing Removed — LERA
- 2011-12-06 Listed $164,500 LERA
- 2011-07-14 Listing Removed — LERA
- 2011-06-27 Listed $176,126 LERA
- 2010-06-30 Listing Removed — LERA
- 2010-05-03 Listed $179,000 LERA
Property tax history
+0.8%/yrLatest (2026): $4,926 · -8.8% YoY. Source: county tax records.
Cash-flow waterfall
monthlySold comps — $/sqft
last 12 mo · ≤1 miLoading sold comps…