1000 Lake OF The Woods Blvd Unit 104A · Fern Park, FL
Flood risk 1/10 · Minimal
- FEMA flood zone
- X (unshaded)
- Chance of flooding over 30 yrs
- 0.0%
- Est. flood insurance / yr
- $507 – $1,088
Fire risk 1/10 · Minimal
- Est. fire insurance / yr
- $947 – $1,759
Heat risk 9/10 · Severe
- Hot days now (above 108°F)
- 7 days/yr
- Hot days in 30 yrs
- 23 days/yr
Wind risk 9/10 · Severe
- Chance of severe wind over 30 yrs
- 99.0%
Air-quality risk 2/10 · Minimal
- Unhealthy air days now
- 1 days/yr
- Unhealthy air days in 30 yrs
- 2 days/yr
Risk factors via First Street. Map © Google.
Why this score? — see what drove the C grade
The composite is a weighted blend of 9 inputs, each scored 0–100. Each bar is that input's sub-score; the figure is the points it added to the 100-point composite (weight × sub-score).
- Cash flow +19.2/30.0
- 1% rule +9.8/10.0
- ARV discount +7.5/15.0
- DSCR +6.0/10.0
- Schools +5.1/10.0
- Livability +3.9/5.0
- Rent growth +2.5/5.0
- Condition / age +2.5/5.0
- Appreciation +0.0/10.0
$105,000
🖨 Deal sheet (PDF) 📄 Offer letter ✓ Due diligence
Listing remarks
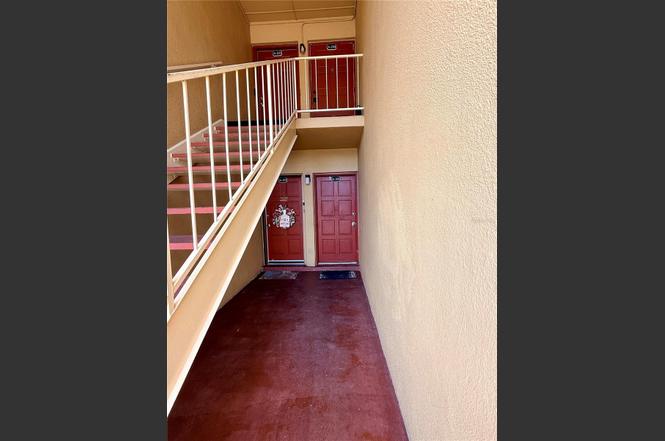
Get in on the Ground Floor of this 2-bedroom 1 bath unit. 885 square feet interior plus a rear screened porch for a total of 990 sq. ft. View from the back porch overlooks one of the two courtyards at Ashwood Condominiums. Unit has a new air conditioning unit, laminate flooring and tile in the bathroom. Unit contains a washer/dryer unit. This lovely unit can use a little TLC and a new owner. The community is very lovely and has two courtyards and lots of sidewalks for walking and exercise. The sparkling swimming pool invites you in for relaxation. A community laundry room is also located in the community. This property has public transportation almost at your front door. The community is ne
Key facts
- Laminate flooring
- Two courtyards
- Tile in bathroom
Tags
Property features AI
Finance
- Other: Property is homesteaded; Zoned R-3
- Financial info: Lease restrictions apply
- HOA & community: Monthly condo fee of $393; Annual association fees totaling $4,716; Association requires approval for buyers; Association amenities include a pool; Association fees cover common area taxes, pool, reserves, insurance, maintenance (structure and grounds), management, private road, sewer, trash, and water; Community features include deed restrictions, community mailbox, sidewalks, and street lights; Pets allowed with breed restrictions; Buyer approval required
Exterior
- Parking: Condominium community parking (details not specified)
- Security: Gated community with automated gate arms
- Utilities: Public water; Public sewer; Electricity connected; Cable available; High-speed internet available; Phone available; Sewer connected; Water connected
- Home design: Residential condominium; One story; First-floor unit; East-facing
- Construction: Block and stucco construction; Built-up roof; Slab foundation; Building A
- Exterior features: Sidewalk; Sliding doors
Interior
- Kitchen: Dishwasher; Range; Range hood; Refrigerator
- Bedrooms: 2 bedrooms (one-level unit)
- Flooring: Laminate; Tile
- Bathrooms: 1 full bathroom
- Heating & cooling: Central heating; Central air conditioning
- Interior features: Ceiling fans; Living room/dining room combo; 6 total rooms
- Laundry & utility: Washer and dryer in unit (washer/dryer listed; laundry located in kitchen and common area)
Neighborhood map
What this means for you Summary
Snapshot
- This is a 2-bed/1.0-bath condo listed at $105k.
Deal economics
- At list price, monthly cash flow is $113 ($1k/yr) — positive.
- The deal already cash-flows at list — no discount required.
- Meets the 1% rule at list price ($2k rent vs $105k).
- Recommended offer: $92k (12.0% below list) — sets the bar for market timing.
- Cap rate 7.6% vs local median 3.8% in Fern Park — top-decile yield for the area; either an underpriced asset or a hidden risk that comps aren't pricing in. Stress-test before assuming the spread holds.
Location & tenants
- Location reads 77/100 on livability (#204 in FL, #3,165 nationally) — a middle-class / working-renter tenant base. Strengths: housing A+, health & safety A+, crime A; Watch: amenities D, commute F.
- Seminole (suburban): math 57% / reading 61% proficiency, ranked #13 of 73 in FL (top 18%) — acceptable for families but not a draw, mixed tenant base, ~2y average lease.
- Zoned schools: English Estates Elementary School (math 49% / reading 50%, grade D, #1,088 of 2,144 statewide, top 53%, 686 students, 72% FRL); South Seminole Middle School (math 53% / reading 50%, grade C, #232 of 571 statewide, top 41%, 995 students, 69% FRL); Lake Howell High School (math 36% / reading 49%, grade F, #264 of 667 statewide, top 41%, 2,205 students, 51% FRL) — zoned schools average 64% FRL vs 38% district-wide (26 pts higher); higher-poverty schools than district average — tighter screening recommended.
- Market conditions: 26 active listings in the ZIP; 19 comparable units currently listed for rent nearby; rentals at typical pace (median 20d on market — plan ~3-4 weeks tenant-placement turnaround); 1,979 units permitted in Seminole County in 2024 (1,191 in 5+ unit buildings).
- This rent runs 39% of the median local income ($48k/yr) — at the standard rent-burdened threshold; future hikes will face affordability resistance.
Forward outlook
- Local home prices are declining (-3.0%/yr); year-one equity from $726 of loan paydown is wiped out by about $3k of value loss. Plan a longer hold.
- Seminole County population projected at +24% by 2050 — long-run rental-demand tailwind backs the buy-and-hold thesis.
Negotiation context
- It's been on market 172 days — a 12% lower offer ($92k) is reasonable based on typical stale-listing flexibility.
- Current owner paid $40k; list at $105k implies a 162% gain — meaningful room to come down on a strong offer.
Risks & watch-outs
- Watch-outs: HOA is 25% of rent.
- Climate carrying-cost: severe wind risk, 99% chance of damaging wind over 30y; extreme-heat days projected 7→23/yr by 2055 (HVAC capex compounding) — expect insurance premiums to compound above CPI over the hold.
Questions for the listing agent
- It's been on market 172 days. Have you received any prior offers? Is the seller open to a 12% concession, seller financing, or rate buy-down credit?
- Built in 1969 — when were the roof, HVAC, electrical panel, plumbing, and water heater last replaced?
- What does the HOA fee cover, when was the last increase, and are there any pending special assessments or reserve-fund shortfalls?
- Any open or pending special assessments — roof, HVAC, plumbing, elevator, façade? What's the per-unit balance and payoff schedule, and is the seller paying it off at close or rolling it to the buyer?
- Why hasn't it sold? Are there any deal-killer items the seller is aware of (foundation, flood, title, zoning, code violations)?
- Is there a deadline driving the sale (1031 exchange, divorce, estate, relocation)? That informs how much negotiation room exists.
- Schools are B-rated — typically a magnet for longer-tenancy family renters. What's the average tenant stay here, and is there a school-zone premium baked into asking?
- What's the average days-on-market for RENTAL listings here right now (not sales)? A rising rental-DOM trend means longer vacancies and softer asking-rent achievability than the comps imply.
- What's the recent tenant-quality profile in this submarket — average credit score on applications, eviction rate, late-payment / NSF rate, and stable-employment percentage? A property-management company in the area should have these aggregated.
- How much new apartment / multifamily construction is in the pipeline within 1–3 miles? Heavy new supply (>2% of stock underway) typically softens rents 12–24 months out; light construction supports rent growth.
Investment metrics
- 1% rule
- 1.48% ✓
- Cap rate
- 7.58%
- Cash-on-cash
- 4.60%
- DSCR
- 1.20
- GRM
- 5.6
CMA / ARV
No comps found within radius.
Projected returns pro-forma
-3.0% appreciation · 3.0% rent growth · sell at horizon
- IRR
- -8.9%
- Equity multiple
- 0.67×
- Total profit
- $-9,578
- Equity at exit
- $15,656
- IRR
- 0.9%
- Equity multiple
- 1.07×
- Total profit
- $1,970
- Equity at exit
- $9,078
Cash invested: $29,400 (down + closing). Projections, not guarantees.
Landlord ↔ Tenant lean methodology
- Overall (STATE)
- 87 Strongly Landlord-Friendly
- State Florida
- 87 Strongly Landlord-Friendly · R+3
- County
- — inherits STATE
- City
- — inherits STATE
ZIP-level market 32730
- Home prices YoY
- -22.4%
- Active inventory
- 26
- Price-to-rent
- 5.6×
Monthly cashflow live
- Estimated rent
- $1,559 high interval (Pro) →
- Mortgage (P&I)
- −$551
- Tax est. 1.5%
- −$131 /mo · $1,575/yr
- Insurance
- −$44
- HOA
- −$393
- Vacancy / Maint / Mgmt
- −$327
- Net cashflow
- $113
Break-even live
Sensitivity live
| Price | -10% $185 | -5% $149 | +0% $113 | +5% $76 | +10% $40 |
|---|---|---|---|---|---|
| Rent | -10% $-11 | -5% $51 | +0% $113 | +5% $174 | +10% $236 |
| Rate | -1.0pp $165 | -0.5pp $139 | base $113 | +0.5pp $85 | +1.0pp $58 |
UW: 25.0% down · 7.5% · 30yr · 1.5% tax · 5.0% vac · 8.0% maint · 8.0% mgmt
Financing live
Cash to close
- Down payment
- $26,250
- Closing costs
- $3,150
- Reserves months
- —
- Total cash needed
- —
Loan-product check · same deal, 3 products live
Conventional
25% down · 7.5% · 30yr
- Down + closing
- —
- Monthly P&I
- —
- Monthly cashflow
- —
- DSCR
- —
- Eligible?
- —
Personal DTI + credit; lowest rate.
DSCR
20% down · 8.5% · 30yr
- Down + closing
- —
- Monthly P&I
- —
- Monthly cashflow
- —
- DSCR
- —
- Eligible?
- —
No personal income docs; deal must DSCR.
Hard money
10% down · 12.0% · 12mo
- Down + closing
- —
- Monthly P&I
- —
- Monthly cashflow
- —
- DSCR
- —
- Eligible?
- —
Short-term bridge; refi at stabilization.
Rent comps 19 comps
| Address | Beds | Baths | Sqft | Rent | $/sqft | DOM | Units | Dist |
|---|---|---|---|---|---|---|---|---|
| 1000 Lake of the Woods Blvd Fern Park, FL | 1.0–2.0 | 1.0–2.0 | 886 | $1,600 | $1.80 | 7d | 3 | 0.10mi |
| 1000 Lake of the Woods Blvd Fern Park, FL | 2.0 | 1.0–2.0 | 945 | $1,525 | $1.61 | 26d | 2 | 0.10mi |
| 2174 Sharp Ct Fern Park, FL | 1.0–2.0 | 1.0 | 664 | $1,379 | $2.08 | 0d | 18 | 0.14mi |
| 2155 Fontebranda Loop Unit 180100 Casselberry, FL | 2.0 | 2.0 | 1020 | $1,799 | $1.76 | 26d | 1 | 0.21mi |
| 2155 Fontebranda Loop Unit 150212 Casselberry, FL | 1.0 | 1.0 | 794 | $1,599 | $2.01 | 26d | 1 | 0.21mi |
| 210 Welcome Way Fern Park, FL | 2.0 | 1.0–2.0 | 880 | $1,469 | $1.67 | 0d | 13 | 0.35mi |
| 310 Kentia Rd Casselberry, FL | 3.0 | 1.0 | 1034 | $1,800 | $1.74 | 17d | 1 | 0.83mi |
| 229 Summerwood Trl Maitland, FL | 1.0 | 1.0 | 725 | $1,380 | $1.90 | 26d | 1 | 0.89mi |
| 400 Sandpiper Ln Casselberry, FL | 1.0–3.0 | 1.0–2.0 | 937 | $1,612 | $1.72 | 0d | 10 | 0.91mi |
| 202 Esplanade Way Unit Esplanade Way-202 Casselberry, FL | 1.0 | 1.0 | 722 | $1,200 | $1.66 | 26d | 1 | 1.00mi |
| 1166 Pointe Newport Ter Casselberry, FL | 1.0–3.0 | 1.0–2.0 | 961 | $1,768 | $1.84 | 7d | 16 | 1.15mi |
| 131 Lemon Ln Casselberry, FL | 2.0 | 1.0 | 572 | $1,550 | $2.71 | 19d | 1 | 1.20mi |
| 660 Jasmine Rd Casselberry, FL | 2.0 | 1.0 | 953 | $1,725 | $1.81 | 7d | 1 | 1.21mi |
| 117 Georgetown Dr Unit C Casselberry, FL | 2.0 | 2.0 | 1095 | $1,550 | $1.42 | 26d | 1 | 1.33mi |
| 512 El Dorado Way Casselberry, FL | 3.0 | 1.0 | 1094 | $1,895 | $1.73 | 7d | 1 | 1.40mi |
| 1157 Calle del Norte Unit B Casselberry, FL | 1.0 | 1.0 | 751 | $1,175 | $1.56 | 7d | 1 | 1.43mi |
| 1167 Calle del Rey Unit A Casselberry, FL | 1.0 | 1.0 | 781 | $1,250 | $1.60 | 26d | 1 | 1.45mi |
| 828 Orienta Ave Altamonte Springs, FL | 1.0–2.0 | 1.0–2.0 | 845 | $1,474 | $1.74 | 24d | 30 | 1.45mi |
| 1160 Calle del Norte Unit C Casselberry, FL | 2.0 | 2.0 | 1040 | $1,650 | $1.59 | 26d | 1 | 1.47mi |
HOA detail condo
- Monthly dues
- $393 · $4,716/yr
- Likely covers
- pool
- Assessments
- None detected in remarks — confirm with the listing agent.
Listing history 21 events
-
2026-06-21statusdays on market $105,000 Pending 172 DOM
-
2026-06-18days on market $105,000 Active 170 DOM
-
2026-06-17days on market $105,000 Active 169 DOM
-
2026-06-16days on market $105,000 Active 168 DOM
-
2026-06-15days on market $105,000 Active 167 DOM
-
2026-06-13days on market $105,000 Active 165 DOM
-
2026-06-09days on market $105,000 Active 161 DOM
-
2026-06-08days on market $105,000 Active 160 DOM
-
2026-06-07days on market $105,000 Active 159 DOM
-
2026-06-04days on market $105,000 Active 156 DOM
-
2026-06-03days on market $105,000 Active 155 DOM
-
2026-06-02days on market $105,000 Active 154 DOM
-
2026-06-02days on market $105,000 Active 153 DOM
-
2026-05-31days on market $105,000 Active 152 DOM
-
2026-05-25price $105,000
-
2026-04-07price $109,999
-
2026-03-28price $115,000
-
2026-02-21price $119,900
-
2025-12-30$125,000 Active
-
2004-05-04soldstatus $40,000
-
1981-07-01soldstatus $34,400
ⓘ Source: listings_history table (triggers on properties + properties_extension) + one-shot
backfill from property_details.listing_events for pre-trigger history.
Climate risk First Street
- Flood 1/10 Low FEMA zone X (unshaded) · 0% chance over 30 yrs
- Wildfire 1/10 Low
- Heat 9/10 Extreme 7 d/yr ≥108°F today · 23 d/yr by 30 yrs out
- Wind 9/10 Extreme 99% chance of damaging wind over 30 yrs
- Air quality 2/10 Low 1 unhealthy d/yr today · 2 by 30 yrs out
Nearby sold comps map
Loading sold comps map…
Walkable amenities ~0.75 mi
Loading nearby amenities…
Taxation est. · year 1
- Rental income
- $18,702
- − Mortgage interest
- −$5,882
- − Property taxes
- −$1,575
- − Insurance
- −$525
- − Repairs & maintenance
- −$1,496
- − Management
- −$1,496
- − HOA
- −$4,716
- − Depreciation
- −$3,055
- Taxable loss
- −$42
- Est. tax savings @ 24.0%
- +$10
- After-tax cash flow
- $1,361/yr
For passive investors: Depreciation is non-cash, so a rental often shows a tax loss while cash-flowing — sheltering income. Rental losses are passive: they offset passive income freely, and up to $25,000/yr can offset ordinary (W-2) income if you actively participate and your MAGI is under $100k (phasing out to $0 by $150k); unused losses carry forward. On sale, claimed depreciation is recaptured at up to 25%, and gains may owe capital-gains tax (a 1031 exchange can defer both). Figures are a year-1 estimate at your 24.0% rate — not tax advice; consult a CPA.
Schools (NCES district)
- District
- Seminole
- NCES district ID
- 1201710
- Math proficiency
- 57% ▼ -7.00%
- Reading proficiency
- 61% ▼ -1.00%
- Median HH income
- $58,478
- Composite
- 51.05/100
- National rank
- #1769
- State rank
- #13 of 73 in FL
Livability — Fern Park
- Score
- 77/100
- State rank
- #204
- US rank
- #3165
Category grades
Schools grade is shown separately in the Schools card above.
Census & demographics
- Census place
- Fern Park, FL
- County
- Seminole County · 436,154 people
- City population
- 6,158
- Metro
- Orlando-Kissimmee-Sanford, FL
- Population (ZIP)
- 6,091
- Household income
- $47,500
- Rent vs Own
- Severe rent burden
- 481.0
Population outlook (Seminole County) Hauer SSP2
- Today (2025)
- 515,494 people
- By 2030
- 545,713 · +5.9%
- By 2040
- 598,068 · +16.0%
- By 2050
- 640,663 · +24.3%
- By 2075
- 724,461 · +40.5%
- By 2100
- 755,530 · +46.6%
Race, ethnicity, and origin ACS 2023
- Neighborhood character
- Diverse neighborhood (Simpson 0.55)
- Race & ethnicity
- White 63% Hispanic / Latino 21% Black 11% Two or more races 10% Asian 4%
- Hispanic origin (detail)
- Mexican 2% Puerto Rican 4% Dominican 5%
- Common ancestry
- Romanian 3% Italian 3% American 2%
- Foreign-born
- 17% · Canada, Vietnam, Jamaica
- Languages at home
- 76% English-only · Spanish 15% Russian/Polish/Slavic 4% Other Asian/Pacific 2%
Political lean MEDSL · Seminole
- 2024 margin
- Toss-up / Even · D 47.6% · R 51.1% · Other 1.3%
- 2008→2024 swing
- -0.8pp no change · 2008: -2.8pp · 2024: -3.5pp
- All cycles
- 2024: R+3.5 2020: D+2.8 2016: R+1.6 2012: R+6.5 2008: R+2.8
Not yet ingested
- Civics
- —
Market trends
- HPI YoY
- ▼ -91.62%
- Current HPI
- 316.6766
- Rent YoY
- —
- Metro
- Orlando-Kissimmee-Sanford, FL
- State GDP YoY
- ▲ 3.28%
- F500 in state
- 36
Industry mix (Fortune 500 HQ in FL)
| Industry | F500 HQs | Revenue |
|---|---|---|
| Industrial Technology | 2 | $29B |
|
||
| Insurance | 2 | $17B |
|
||
| Retail | 1 | $60B |
|
||
| Technology Distribution | 1 | $58B |
|
||
| Homebuilding | 1 | $35B |
|
||
| Technology Manufacturing | 1 | $35B |
|
||
Price history
+205.2% since first listed7 events — show timeline
- 2026-05-25 Price Changed $105,000 Stellar MLS as Distributed by MLS Grid
- 2026-04-07 Price Changed $109,999 Stellar MLS as Distributed by MLS Grid
- 2026-03-28 Price Changed $115,000 Stellar MLS as Distributed by MLS Grid
- 2026-02-21 Price Changed $119,900 Stellar MLS as Distributed by MLS Grid
- 2025-12-30 Listed $125,000 Stellar MLS as Distributed by MLS Grid
- 2004-05-04 Sold (Public Records) $40,000 Public Records
- 1981-07-01 Sold (Public Records) $34,400 Public Records
Property tax history
-0.6%/yrLatest (2024): $7 · +0.0% YoY. Source: county tax records.
Cash-flow waterfall
monthlySold comps — $/sqft
last 12 mo · ≤1 miLoading sold comps…