 🏗️ New Construction
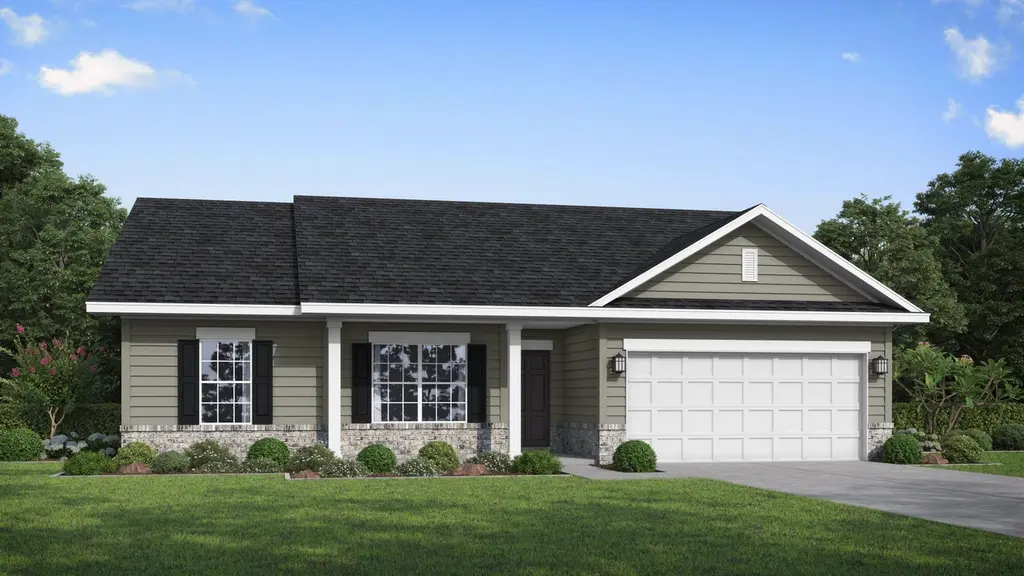
Brunsen Plan · Ludowici, GA
Flood risk 9/10 · Severe
- FEMA flood zone
- A
- Chance of flooding over 30 yrs
- 0.99%
- Est. flood insurance / yr
- $1,009 – $1,996
Fire risk 6/10 · Moderate
- Est. fire insurance / yr
- $963 – $1,789
Heat risk 8/10 · Major
- Hot days now (above 109°F)
- 7 days/yr
- Hot days in 30 yrs
- 18 days/yr
Wind risk 8/10 · Major
- Chance of severe wind over 30 yrs
- 98.0%
Air-quality risk 2/10 · Minimal
- Unhealthy air days now
- 2 days/yr
- Unhealthy air days in 30 yrs
- 2 days/yr
Risk factors via First Street. Map © Google.
Why this score? — see what drove the D- grade
The composite is a weighted blend of 9 inputs, each scored 0–100. Each bar is that input's sub-score; the figure is the points it added to the 100-point composite (weight × sub-score).
- Cash flow +8.0/30.0
- ARV discount +7.5/15.0
- Appreciation +5.6/10.0
- Condition / age +4.8/5.0
- Livability +3.6/5.0
- 1% rule +2.6/10.0
- Rent growth +2.5/5.0
- Schools +2.3/10.0
- DSCR +2.0/10.0
$269,900
🖨 Deal sheet 📄 Offer letter ✓ Due diligence
Listing remarks MLS
Introducing our new Brunsen plan - and what a beauty! This home features 3 bedrooms, 2 bathrooms, and a dining room/option 4th bedroom option. The perfect layout for any family. Enjoy many features this home has to offer such as an open living space, a kitchen with an island- plenty of counter space for prepping, a pantry, and a master suite with a large walk-in closet. This floorplan is designed with today's family in mind- whether you're a small family or a growing one this plan is perfect for you!
Key facts
- Open living space
- Large walk-in closet
- 2 parking spots
Tags
Neighborhood map
What this means for you Summary
Snapshot
- This is a 4-bed/2.0-bath single-family listed at $270k. Condition is rated excellent.
Deal economics
- At list price, monthly cash flow is $-426 ($-5k/yr) — negative.
- To cash-flow at today's rent, offer at most $232k (13.9% below list).
- To meet the 1% rule (rent ≥ 1% of price), the offer needs to be $224k (16.9% below list).
- Recommended offer: $224k (16.9% below list) — sets the bar for 1% rule.
Location & tenants
- Location reads 72/100 on livability (#74 in GA) — a middle-class / working-renter tenant base. Strengths: cost of living A+, health & safety A+, crime A; Watch: schools D, employment D, amenities F.
- Long County (rural): math 26% / reading 26% proficiency, ranked #115 of 174 in GA (top 66%) — low school quality limits family demand, transient renter base, plan for 1-2y turnover; 61% free/reduced lunch — lower-income household profile, screen leases tightly.
- Market conditions: 409 active listings in the ZIP; 1 comparable units currently listed for rent nearby; 298 units permitted in Long County in 2024 (0 in 5+ unit buildings).
- This rent runs 36% of the median local income ($75k/yr) — at the standard rent-burdened threshold; future hikes will face affordability resistance.
Forward outlook
- In year one you build about $5k of equity ($2k loan paydown + $3k appreciation (1.2% local appreciation)).
- Long County population projected at +72% by 2050 — long-run rental-demand tailwind backs the buy-and-hold thesis.
- By year 6, paydown + projected appreciation supports a ~$31k cash-out refi (75% LTV) — recoverable capital for the next deal without selling this one.
Negotiation context
- It's been on market 585 days — a 12% lower offer ($238k) is reasonable based on typical stale-listing flexibility.
Risks & watch-outs
- Watch-outs: flood insurance adds $125/mo.
- Climate carrying-cost: in FEMA flood zone A (mandatory federal flood insurance); severe wind risk, 98% chance of damaging wind over 30y; major wildfire risk; extreme-heat days projected 7→18/yr by 2055 (HVAC capex compounding) — expect insurance premiums to compound above CPI over the hold.
Questions for the listing agent
- What do current leases actually rent for vs. the listed asking? Can we see a recent rent roll and the last 12 months of T-12 income?
- It's been on market 585 days. Have you received any prior offers? Is the seller open to a 17% concession, seller financing, or rate buy-down credit?
- What's the actual annual flood-insurance premium (NFIP or private), and is the property in a SFHA with mandatory coverage?
- What does the HOA fee cover, when was the last increase, and are there any pending special assessments or reserve-fund shortfalls?
- Why hasn't it sold? Are there any deal-killer items the seller is aware of (foundation, flood, title, zoning, code violations)?
- Is there a deadline driving the sale (1031 exchange, divorce, estate, relocation)? That informs how much negotiation room exists.
- Schools are D-rated, which usually means shorter tenancies and higher turnover. Who's the typical renter profile here, and what's been the actual vacancy rate?
- The area grade is low — what's the realistic commute time and amenity access for the typical tenant pool here? Any planned neighborhood developments (good or bad) we should know about?
- What's the average days-on-market for RENTAL listings here right now (not sales)? A rising rental-DOM trend means longer vacancies and softer asking-rent achievability than the comps imply.
- What's the recent tenant-quality profile in this submarket — average credit score on applications, eviction rate, late-payment / NSF rate, and stable-employment percentage? A property-management company in the area should have these aggregated.
- How much new for-sale + rental construction is in the pipeline within 1–3 miles? Heavy new supply typically softens prices + rents 12–24 months out; constrained supply supports both.
Investment metrics
- 1% rule
- 0.76% ✗
- Cap rate
- 5.06%
- Cash-on-cash
- -4.39%
- DSCR
- 0.80
- GRM
- 10.9
CMA / ARV
- ARV (median comp)
- $294,202
- List price
- $269,900
- Delta
- -8.26%
- Verdict
- FAIR
- Comps
- 20 within 1.0 mi
Show comp detail 12 sales within ~0.75 mi
| Address | Dist | Beds/Ba | Sqft | Sold | Price | $/sf | Match |
|---|---|---|---|---|---|---|---|
| 55 Pintail Ct NE | 0.63mi | 4/2.0 | 1,620 (0%) | 8mo | $276,625 | $171 | 64 |
| 76 Doctor's Creek Rd NE | 0.64mi | 4/2.0 | 1,620 (0%) | 11mo | $298,170 | $184 | 61 |
| 439 Lanier Rd NE | 0.69mi | 4/2.0 | 1,620 (0%) | 11mo | $279,525 | $173 | 59 |
| 52 Freshwater Ln | 0.45mi | 3/2.0 (-1) | 1,474 (-9%) | 3mo | $285,178 | $193 | 57 |
| 58 Doctor's Creek Rd NE | 0.64mi | 4/2.0 | 1,565 (-3%) | 10mo | $292,025 | $187 | 57 |
| 117 Doctor's Creek Rd NE | 0.67mi | 4/2.0 | 1,565 (-3%) | 8mo | $274,995 | $176 | 56 |
| 92 Freshwater Ln | 0.45mi | 3/2.0 (-1) | 1,473 (-9%) | 4mo | $284,800 | $193 | 56 |
| 34 Pintail Ct NE | 0.64mi | 4/2.0 | 1,565 (-3%) | 11mo | $300,095 | $192 | 55 |
| 74 Freshwater Ln | 0.45mi | 3/2.0 (-1) | 1,415 (-13%) | 0mo | $278,000 | $196 | 53 |
| 77 Doctor's Creek Rd NE | 0.66mi | 4/2.5 | 1,810 (+12%) | 10mo | $285,425 | $158 | 39 |
| 135 Doctors Creek Rd NE | 0.67mi | 3/2.0 (-1) | 1,380 (-15%) | 9mo | $263,725 | $191 | 32 |
| 287 Doctor's Creek Rd NE | 0.73mi | 3/2.0 (-1) | 1,380 (-15%) | 8mo | $264,625 | $192 | 30 |
Match score weights: distance 35% · size 25% · config 20% · recency 20%. Top-matched comps best support the ARV.
Projected returns pro-forma
1.16% appreciation · 3.0% rent growth · sell at horizon
- IRR
- -4.6%
- Equity multiple
- 0.77×
- Total profit
- $-19,236
- Equity at exit
- $102,870
- IRR
- 0.7%
- Equity multiple
- 1.08×
- Total profit
- $6,907
- Equity at exit
- $138,607
Cash invested: $82,377 (down + closing). Projections, not guarantees.
Landlord ↔ Tenant lean methodology
- Overall (STATE)
- 90 Strongly Landlord-Friendly
- State Georgia
- 90 Strongly Landlord-Friendly · R+3
- County
- — inherits STATE
- City
- — inherits STATE
ZIP-level market 31316
- Home prices YoY
- 0.6%
- Active inventory
- 409
- Price-to-rent
- 10.0×
Monthly cashflow live
- Estimated rent
- $2,242 medium interval (Pro) →
- Mortgage (P&I)
- −$1,543
- Tax est. 1.5%
- −$368 /mo · $4,413/yr
- Insurance
- −$123
- Flood insurance flood zone
- −$125 /mo · $1,502/yr
- HOA
- −$39
- Vacancy / Maint / Mgmt
- −$471
- Net cashflow
- $-426
Break-even live
UW: 25.0% down · 7.5% · 30yr · 1.5% tax · 5.0% vac · 8.0% maint · 8.0% mgmt
Financing live
Cash to close
- Down payment
- $73,551
- Closing costs
- $8,826
- Reserves months
- —
- Total cash needed
- —
Loan-product check · same deal, 3 products live
Conventional
25% down · 7.5% · 30yr
- Down + closing
- —
- Monthly P&I
- —
- Monthly cashflow
- —
- DSCR
- —
- Eligible?
- —
Personal DTI + credit; lowest rate.
DSCR
20% down · 8.5% · 30yr
- Down + closing
- —
- Monthly P&I
- —
- Monthly cashflow
- —
- DSCR
- —
- Eligible?
- —
No personal income docs; deal must DSCR.
Hard money
10% down · 12.0% · 12mo
- Down + closing
- —
- Monthly P&I
- —
- Monthly cashflow
- —
- DSCR
- —
- Eligible?
- —
Short-term bridge; refi at stabilization.
Rent comps 1 comps
| Address | Beds | Baths | Sqft | Rent | $/sqft | DOM | Units | Dist |
|---|---|---|---|---|---|---|---|---|
| 59 Forest St NE Ludowici, GA | 4.0 | 2.0 | 1800 | $1,900 | $1.06 | 43d | 1 | 1.28mi |
HOA detail
- Monthly dues
- $39 · $468/yr
Listing history 18 events
-
2026-06-19days on market $269,900 Active 585 DOM
-
2026-06-18days on market $269,900 Active 584 DOM
-
2026-06-17days on market $269,900 Active 583 DOM
-
2026-06-16days on market $269,900 Active 582 DOM
-
2026-06-15days on market $269,900 Active 581 DOM
-
2026-06-14days on market $269,900 Active 579 DOM
-
2026-06-13days on market $269,900 Active 578 DOM
-
2026-06-10days on market $269,900 Active 576 DOM
-
2026-06-09days on market $269,900 Active 575 DOM
-
2026-06-08days on market $269,900 Active 574 DOM
-
2026-06-07days on market $269,900 Active 573 DOM
-
2026-06-05days on market $269,900 Active 570 DOM
-
2026-06-03days on market $269,900 Active 569 DOM
-
2026-06-02days on market $269,900 Active 568 DOM
-
2026-06-01days on market $269,900 Active 567 DOM
-
2026-05-31days on market $269,900 Active 566 DOM
-
2026-05-30days on market $269,900 Active 565 DOM
-
2024-11-11$269,900 Active 505-char remark
Show marketing remark (505 chars)
Introducing our new Brunsen plan - and what a beauty! This home features 3 bedrooms, 2 bathrooms, and a dining room/option 4th bedroom option. The perfect layout for any family. Enjoy many features this home has to offer such as an open living space, a kitchen with an island- plenty of counter space for prepping, a pantry, and a master suite with a large walk-in closet. This floorplan is designed with today's family in mind- whether you're a small family or a growing one this plan is perfect for you!
ⓘ Source: listings_history table (triggers on properties + properties_extension) + one-shot
backfill from property_details.listing_events for pre-trigger history.
Climate risk First Street
- Flood 9/10 Extreme FEMA zone A · 99% chance over 30 yrs
- Wildfire 6/10 Major
- Heat 8/10 Severe 7 d/yr ≥109°F today · 18 d/yr by 30 yrs out
- Wind 8/10 Severe 98% chance of damaging wind over 30 yrs
- Air quality 2/10 Low 2 unhealthy d/yr today · 2 by 30 yrs out
Nearby sold comps map
Loading sold comps map…
Walkable amenities ~0.75 mi
Loading nearby amenities…
Taxation est. · year 1
- Rental income
- $26,900
- − Mortgage interest
- −$16,480
- − Property taxes
- −$4,413
- − Insurance
- −$2,974
- − Repairs & maintenance
- −$2,152
- − Management
- −$2,152
- − HOA
- −$468
- − Depreciation
- −$8,559
- Taxable loss
- −$10,297
- Est. tax savings @ 24.0%
- +$2,471
- After-tax cash flow
- $-2,646/yr
For passive investors: Depreciation is non-cash, so a rental often shows a tax loss while cash-flowing — sheltering income. Rental losses are passive: they offset passive income freely, and up to $25,000/yr can offset ordinary (W-2) income if you actively participate and your MAGI is under $100k (phasing out to $0 by $150k); unused losses carry forward. On sale, claimed depreciation is recaptured at up to 25%, and gains may owe capital-gains tax (a 1031 exchange can defer both). Figures are a year-1 estimate at your 24.0% rate — not tax advice; consult a CPA.
Condition & rehab AI · 1 photo
This single-family home is in excellent condition with no visible repairs or maintenance needed. It offers a good return on investment with updates that would significantly increase its resale and rental value.
Value-add opportunities
- Both Painting exterior and interior — Enhances curb appeal and interior aesthetics
- Both Landscaping improvements — Enhances curb appeal and adds value
- Both New flooring in bathrooms and kitchen — Improves functionality and aesthetics
- Both New kitchen appliances — Enhances functionality and aesthetics
- Both New bathroom fixtures — Enhances functionality and aesthetics
Renovation cost estimate screening
Value-add ROI direction
- Both Painting exterior and interior — Enhances curb appeal and interior aesthetics ↑
- Both Landscaping improvements — Enhances curb appeal and adds value ↑
- Both New flooring in bathrooms and kitchen — Improves functionality and aesthetics ↑
- Both New kitchen appliances — Enhances functionality and aesthetics ↑
- Both New bathroom fixtures — Enhances functionality and aesthetics ↑
ⓘ Cost ranges are severity-bucket heuristics (US national rule-of-thumb). Get contractor quotes + a written scope before underwriting a rehab budget.
Schools (NCES district)
- District
- Long County
- NCES district ID
- 1303360
- Math proficiency
- 26% ▼ -14.00%
- Reading proficiency
- 26% ▼ -13.00%
- Median HH income
- $45,958
- Composite
- 22.51/100
- National rank
- #8090
- State rank
- #115 of 174 in GA
Livability — Ludowici
- Score
- 72/100
- State rank
- #74
- US rank
- #6449
Category grades
Schools grade is shown separately in the Schools card above.
Census & demographics
- County
- Long County · 13,812 people
- City population
- 13,812
- Metro
- Hinesville, GA
- Population (ZIP)
- 13,812
- Household income
- $74,766
- Rent vs Own
- Severe rent burden
- 109.0
Population outlook (Long County) Hauer SSP2
- Today (2025)
- 24,669 people
- By 2030
- 28,223 · +14.4%
- By 2040
- 35,430 · +43.6%
- By 2050
- 42,403 · +71.9%
- By 2075
- 56,996 · +131.0%
- By 2100
- 64,185 · +160.2%
Race, ethnicity, and origin ACS 2023
- Neighborhood character
- Diverse neighborhood (Simpson 0.56)
- Race & ethnicity
- White 61% Black 23% Hispanic / Latino 8% Two or more races 8%
- Hispanic origin (detail)
- Mexican 2% Puerto Rican 5%
- Common ancestry
- Serbian 1% Italian 1% Romanian 1%
- Foreign-born
- 3% · Canada
- Languages at home
- 92% English-only · Spanish 6% Other Asian/Pacific 1% German/W. Germanic 1%
Political lean MEDSL · Long
- 2024 margin
- Strong R (+29.5) · D 35.1% · R 64.6%
- 2008→2024 swing
- -5.4pp toward R · 2008: -24.1pp · 2024: -29.5pp
- All cycles
- 2024: R+29.5 2020: R+26.4 2016: R+30.8 2012: R+22.9 2008: R+24.1
Not yet ingested
- Civics
- —
Market trends
- HPI YoY
- ▲ 1.16%
- Current HPI
- 195.2978
- Rent YoY
- —
- Metro
- Hinesville, GA
- State GDP YoY
- ▲ 2.66%
- F500 in state
- 28
Industry mix (Fortune 500 HQ in GA)
| Industry | F500 HQs | Revenue |
|---|---|---|
| Paper / Packaging | 2 | $29B |
|
||
| Retail | 1 | $160B |
|
||
| Transportation / Logistics | 1 | $91B |
|
||
| Airlines | 1 | $62B |
|
||
| Consumer Goods | 1 | $47B |
|
||
| Utilities | 1 | $25B |
|
||
Price history
1 event — show timeline
- 2024-11-11 Listed $269,900 Zillow
Cash-flow waterfall
monthlySold comps — $/sqft
last 12 mo · ≤1 miLoading sold comps…