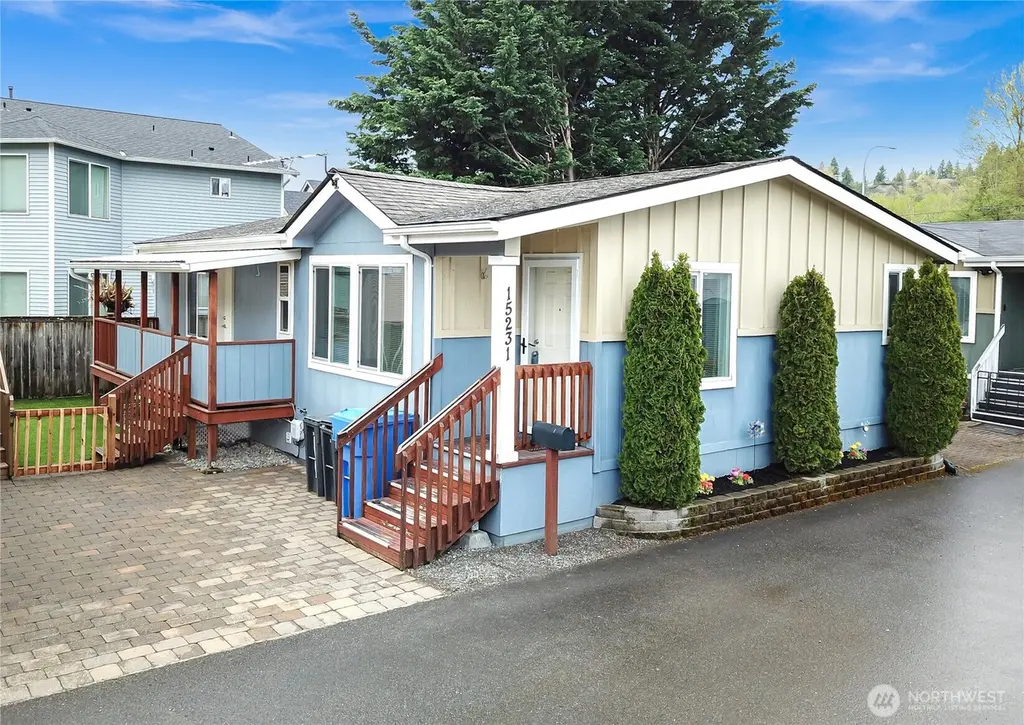
15231 Pine Dr · Renton, WA
Flood risk No data
- FEMA flood zone
- —
- Chance of flooding over 30 yrs
- —
- Est. flood insurance / yr
- —
Fire risk No data
- Est. fire insurance / yr
- —
Heat risk No data
- Hot days now (above threshold)
- —
- Hot days in 30 yrs
- —
Wind risk No data
- Chance of severe wind over 30 yrs
- —
Air-quality risk No data
- Unhealthy air days now
- —
- Unhealthy air days in 30 yrs
- —
Risk factors via First Street. Map © Google.
Why this score? — see what drove the B grade
The composite is a weighted blend of 9 inputs, each scored 0–100. Each bar is that input's sub-score; the figure is the points it added to the 100-point composite (weight × sub-score).
- Cash flow +30.0/30.0
- DSCR +10.0/10.0
- 1% rule +9.8/10.0
- ARV discount +8.2/15.0
- Schools +4.7/10.0
- Livability +4.2/5.0
- Condition / age +4.0/5.0
- Rent growth +3.5/5.0
- Appreciation +0.0/10.0
$160,000
🖨 Deal sheet (PDF) 📄 Offer letter ✓ Due diligence
Listing remarks
Welcome to this beautifully maintained, truly turn-key home awaiting you in the affordable 55+ community of Wonderland Estates! Drenched in natural lighting, this like-new 2015 home is ready for you! Featuring brand new carpets, fresh interior paint, vaulted ceilings, two bedrooms and 1.75 baths across an efficient 1,026 sqft. Enjoy the spacious living room, dining room and open kitchen with plenty of counter and cabinet storage, a utility room, a large second bedroom with it's own private entry using the back deck plus the oversized primary bedroom with large dual door closets, patio access and an ensuite bathroom. Enjoy your coffee on the covered patio year round! Pets will enjoy the cove
Key facts
- Gated backyard
- Large flower bed
- Rv parking
Tags
Neighborhood map
What this means for you Summary
Snapshot
- This is a 2-bed/2.0-bath manufactured listed at $160k. Condition is rated good.
Deal economics
- At list price, monthly cash flow is $767 ($9k/yr) — positive.
- The deal already cash-flows at list — no discount required.
- Meets the 1% rule at list price ($2k rent vs $160k).
- Recommended offer: $150k (6.0% below list) — sets the bar for market timing.
- Cap rate 12.0% vs local median 2.3% in Renton — top-decile yield for the area; either an underpriced asset or a hidden risk that comps aren't pricing in. Stress-test before assuming the spread holds.
Location & tenants
- Location reads 83/100 on livability (#52 in WA, #949 nationally) — a professional / high-income tenant draw. Strengths: amenities A+, commute A+, employment A+; Watch: crime D-, cost of living F.
- Renton School District (urban): math 47% / reading 55% proficiency, ranked #119 of 291 in WA (top 41%) — acceptable for families but not a draw, mixed tenant base, ~2y average lease.
- Zoned schools: Tiffany Park Elementary School (383 students, 64% FRL); Nelsen Middle School (904 students, 60% FRL); Lindbergh Senior High School (1,274 students, 59% FRL) — zoned schools average 61% FRL vs 42% district-wide (19 pts higher); higher-poverty schools than district average — tighter screening recommended.
- Market conditions: Rents rising fast (+4.2%/yr); 190 active listings in the ZIP; 7 comparable units currently listed for rent nearby; rentals leasing fast (median 7d on market — plan ~1-2 weeks tenant-placement turnaround); high-income renter base; 10,555 units permitted in King County in 2024 (7,119 in 5+ unit buildings).
Forward outlook
- Local home prices are declining (-3.0%/yr); year-one equity from $1k of loan paydown is wiped out by about $5k of value loss. Plan a longer hold.
- King County population projected at +44% by 2050 — long-run rental-demand tailwind backs the buy-and-hold thesis.
- At projected returns (-3.0% appreciation + 4.2% rent growth), your $45k cash investment doubles in ~6 years — after that, you're playing with house money.
Negotiation context
- It's been on market 65 days — a 6% lower offer ($150k) is reasonable based on typical stale-listing flexibility.
Questions for the listing agent
- It's been on market 65 days. Have you received any prior offers? Is the seller open to a 6% concession, seller financing, or rate buy-down credit?
- Why hasn't it sold? Are there any deal-killer items the seller is aware of (foundation, flood, title, zoning, code violations)?
- Is there a deadline driving the sale (1031 exchange, divorce, estate, relocation)? That informs how much negotiation room exists.
- Schools are B-rated — typically a magnet for longer-tenancy family renters. What's the average tenant stay here, and is there a school-zone premium baked into asking?
- Crime grade is D in this area — have there been break-ins, vandalism, or insurance claims at this property in the last 3 years? What carrier currently insures it and at what premium?
- What's the average days-on-market for RENTAL listings here right now (not sales)? A rising rental-DOM trend means longer vacancies and softer asking-rent achievability than the comps imply.
- What's the recent tenant-quality profile in this submarket — average credit score on applications, eviction rate, late-payment / NSF rate, and stable-employment percentage? A property-management company in the area should have these aggregated.
- How much new for-sale + rental construction is in the pipeline within 1–3 miles? Heavy new supply typically softens prices + rents 12–24 months out; constrained supply supports both.
Investment metrics
- 1% rule
- 1.48% ✓
- Cap rate
- 12.05%
- Cash-on-cash
- 20.55%
- DSCR
- 1.91
- GRM
- 5.6
CMA / ARV
- ARV (median comp)
- $162,479
- List price
- $160,000
- Delta
- -1.53%
- Verdict
- FAIR
- Comps
- 4 within 1.0 mi
Show comp detail 8 sales within ~0.75 mi
| Address | Dist | Beds/Ba | Sqft | Sold | Price | $/sf | Match |
|---|---|---|---|---|---|---|---|
| 15235 Pine Dr | 0.02mi | 2/2.0 | 1,064 (+4%) | 11mo | $160,000 | $150 | 84 |
| 15243 Pine Dr Unit P-43 | 0.06mi | 2/2.0 | 1,050 (+2%) | 21mo | $180,000 | $171 | 76 |
| 15253 Pine Dr | 0.08mi | 3/2.0 (+1) | 1,120 (+9%) | 4mo | $165,000 | $147 | 72 |
| 15271 Oak Dr | 0.08mi | 3/2.0 (+1) | 1,152 (+12%) | 4mo | $185,000 | $161 | 68 |
| 15297 Oak Dr | 0.13mi | 2/2.0 | 1,124 (+10%) | 23mo | $89,000 | $79 | 59 |
| 15291 Maple Dr Unit m-91 | 0.09mi | 3/2.0 (+1) | 924 (-10%) | 20mo | $99,000 | $107 | 58 |
| 15251 Maple Dr | 0.04mi | 2/2.0 | 896 (-13%) | 24mo | $120,000 | $134 | 57 |
| 15032 156th Pl SE | 0.59mi | 2/2.0 | 960 (-6%) | 18mo | $443,000 | $461 | 47 |
Match score weights: distance 35% · size 25% · config 20% · recency 20%. Top-matched comps best support the ARV.
Projected returns pro-forma
-3.0% appreciation · 4.19% rent growth · sell at horizon
- IRR
- 14.2%
- Equity multiple
- 1.58×
- Total profit
- $25,835
- Equity at exit
- $23,857
- IRR
- 23.9%
- Equity multiple
- 3.18×
- Total profit
- $97,623
- Equity at exit
- $13,834
Cash invested: $44,800 (down + closing). Projections, not guarantees.
Landlord ↔ Tenant lean methodology
- Overall (STATE)
- 28 Tenant-Leaning
- State Washington
- 28 Tenant-Leaning · D+8
- County
- — inherits STATE
- City
- — inherits STATE
ZIP-level market 98058
- Rents YoY
- 4.2%
- Active inventory
- 190
- Price-to-rent
- 5.6×
Monthly cashflow live
- Estimated rent
- $2,371 high interval (Pro) →
- Mortgage (P&I)
- −$839
- Tax est. 1.5%
- −$200 /mo · $2,400/yr
- Insurance
- −$67
- HOA
- −$0
- Vacancy / Maint / Mgmt
- −$498
- Net cashflow
- $767
Break-even live
Sensitivity live
| Price | -10% $878 | -5% $822 | +0% $767 | +5% $712 | +10% $656 |
|---|---|---|---|---|---|
| Rent | -10% $580 | -5% $673 | +0% $767 | +5% $861 | +10% $954 |
| Rate | -1.0pp $848 | -0.5pp $808 | base $767 | +0.5pp $726 | +1.0pp $683 |
UW: 25.0% down · 7.5% · 30yr · 1.5% tax · 5.0% vac · 8.0% maint · 8.0% mgmt
Financing live
Cash to close
- Down payment
- $40,000
- Closing costs
- $4,800
- Reserves months
- —
- Total cash needed
- —
Loan-product check · same deal, 3 products live
Conventional
25% down · 7.5% · 30yr
- Down + closing
- —
- Monthly P&I
- —
- Monthly cashflow
- —
- DSCR
- —
- Eligible?
- —
Personal DTI + credit; lowest rate.
DSCR
20% down · 8.5% · 30yr
- Down + closing
- —
- Monthly P&I
- —
- Monthly cashflow
- —
- DSCR
- —
- Eligible?
- —
No personal income docs; deal must DSCR.
Hard money
10% down · 12.0% · 12mo
- Down + closing
- —
- Monthly P&I
- —
- Monthly cashflow
- —
- DSCR
- —
- Eligible?
- —
Short-term bridge; refi at stabilization.
Rent comps 7 comps
| Address | Beds | Baths | Sqft | Rent | $/sqft | DOM | Units | Dist |
|---|---|---|---|---|---|---|---|---|
| 15300 SE 155th Pl Renton, WA | 2.0–3.0 | 2.0 | 1069 | $2,250 | $2.10 | 1d | 3 | 0.33mi |
| 15205 140th Way SE Renton, WA | 1.0–3.0 | 1.0–2.0 | 1121 | $2,968 | $2.65 | 0d | 10 | 0.73mi |
| 13811 SE Fairwood Blvd Renton, WA | 3.0 | 1.5 | 1390 | $2,395 | $1.72 | 6d | 1 | 0.92mi |
| 12920 SE 157th Pl Renton, WA | 3.0 | 2.0 | 1360 | $2,950 | $2.17 | 1d | 1 | 1.18mi |
| 14110 SE 171st Way Unit B303 Renton, WA | 3.0 | 2.0 | 1288 | $2,850 | $2.21 | 26d | 1 | 1.24mi |
| 14600 SE 176th St Unit L4 Renton, WA | 2.0 | 1.0 | 787 | $1,995 | $2.53 | 45d | 1 | 1.33mi |
| 17537 151st Ave SE Renton, WA | 1.0 | 1.0 | 740 | $1,570 | $2.12 | 16d | 1 | 1.38mi |
Listing history 18 events
-
2026-06-21days on market $160,000 Active 65 DOM
-
2026-06-18days on market $160,000 Active 62 DOM
-
2026-06-17days on market $160,000 Active 61 DOM
-
2026-06-16days on market $160,000 Active 60 DOM
-
2026-06-15price $160,000 Active 59 DOM
-
2026-06-15days on market $170,000 Active 59 DOM
-
2026-06-13days on market $170,000 Active 57 DOM
-
2026-06-13days on market $170,000 Active 56 DOM
-
2026-06-09days on market $170,000 Active 53 DOM
-
2026-06-08days on market $170,000 Active 52 DOM
-
2026-06-07days on market $170,000 Active 51 DOM
-
2026-06-04days on market $170,000 Active 48 DOM
-
2026-06-03days on market $170,000 Active 47 DOM
-
2026-06-02days on market $170,000 Active 46 DOM
-
2026-06-01days on market $170,000 Active 45 DOM
-
2026-05-31days on market $170,000 Active 44 DOM
-
2026-04-17price $170,000
-
2026-04-17$160,000 Active
ⓘ Source: listings_history table (triggers on properties + properties_extension) + one-shot
backfill from property_details.listing_events for pre-trigger history.
Nearby sold comps map
Loading sold comps map…
Walkable amenities ~0.75 mi
Loading nearby amenities…
Taxation est. · year 1
- Rental income
- $28,447
- − Mortgage interest
- −$8,962
- − Property taxes
- −$2,400
- − Insurance
- −$800
- − Repairs & maintenance
- −$2,276
- − Management
- −$2,276
- − Depreciation
- −$4,655
- Taxable income
- $7,079
- Est. tax owed @ 24.0%
- −$1,699
- After-tax cash flow
- $7,506/yr
For passive investors: Depreciation is non-cash, so a rental often shows a tax loss while cash-flowing — sheltering income. Rental losses are passive: they offset passive income freely, and up to $25,000/yr can offset ordinary (W-2) income if you actively participate and your MAGI is under $100k (phasing out to $0 by $150k); unused losses carry forward. On sale, claimed depreciation is recaptured at up to 25%, and gains may owe capital-gains tax (a 1031 exchange can defer both). Figures are a year-1 estimate at your 24.0% rate — not tax advice; consult a CPA.
Condition & rehab AI · 12 photos
This 2015 manufactured home in Wonderland Estates is in good condition with fresh paint and well-maintained interiors. It's ready for a fresh coat of paint and some minor updates to increase its value.
Value-add opportunities
- Both Paint exterior — Fresh paint enhances curb appeal and can add value.
- Both Replace carpet — New carpet can improve comfort and appearance.
- Both Replace countertops — Modern countertops can increase both resale and rental value.
- Both Replace appliances — Upgraded appliances can attract more buyers/renters.
- Both Landscaping — Enhanced landscaping can increase curb appeal and property value.
Renovation cost estimate screening
Value-add ROI direction
- Both Paint exterior — Fresh paint enhances curb appeal and can add value. ↑
- Both Replace carpet — New carpet can improve comfort and appearance. ↑
- Both Replace countertops — Modern countertops can increase both resale and rental value. ↑
- Both Replace appliances — Upgraded appliances can attract more buyers/renters. ↑
- Both Landscaping — Enhanced landscaping can increase curb appeal and property value. ↑
ⓘ Cost ranges are severity-bucket heuristics (US national rule-of-thumb). Get contractor quotes + a written scope before underwriting a rehab budget.
Schools (NCES district)
- District
- Renton School District
- NCES district ID
- 5307230
- Math proficiency
- 47% ▼ -1.00%
- Reading proficiency
- 55% ▼ -1.00%
- Median HH income
- $66,354
- Composite
- 47.13/100
- National rank
- #5108
- State rank
- #119 of 291 in WA
Livability — Renton
- Score
- 83/100
- State rank
- #52
- US rank
- #949
Category grades
Schools grade is shown separately in the Schools card above.
Census & demographics
- Census place
- Renton, WA
- County
- King County · 2,251,916 people
- City population
- 158,600
- Metro
- Seattle-Tacoma-Bellevue, WA
- Population (ZIP)
- 42,980
- Household income
- $115,201
- Rent vs Own
- Severe rent burden
- 812.0
Population outlook (King County) Hauer SSP2
- Today (2025)
- 2,576,485 people
- By 2030
- 2,803,316 · +8.8%
- By 2040
- 3,255,921 · +26.4%
- By 2050
- 3,706,444 · +43.9%
- By 2075
- 4,746,063 · +84.2%
- By 2100
- 5,407,730 · +109.9%
Race, ethnicity, and origin ACS 2023
- Neighborhood character
- Diverse neighborhood (Simpson 0.68)
- Race & ethnicity
- White 52% Asian 16% Two or more races 15% Hispanic / Latino 13% Black 8%
- Hispanic origin (detail)
- Mexican 8% Puerto Rican 1%
- Common ancestry
- Italian 4% Portuguese 4% Lithuanian 3%
- Foreign-born
- 21% · Canada, Vietnam, China
- Languages at home
- 73% English-only · Spanish 8% Russian/Polish/Slavic 3% Chinese 3%
Political lean MEDSL · King
- 2024 margin
- Solid D (+51.7) · D 74.2% · R 22.5% · Other 3.4%
- 2008→2024 swing
- +9.6pp toward D · 2008: 42.1pp · 2024: 51.7pp
- All cycles
- 2024: D+51.7 2020: D+52.7 2016: D+50.4 2012: D+39.9 2008: D+42.1
Not yet ingested
- Civics
- —
Market trends
- HPI YoY
- ▼ -798.11%
- Current HPI
- 321.3895
- Rent YoY
- ▲ 4.19%
- Metro
- Seattle-Tacoma-Bellevue, WA
- State GDP YoY
- ▲ 4.65%
- F500 in state
- 22
Industry mix (Fortune 500 HQ in WA)
| Industry | F500 HQs | Revenue |
|---|---|---|
| Retail | 2 | $269B |
|
||
| Technology / Retail | 1 | $638B |
|
||
| Technology | 1 | $245B |
|
||
| Telecommunications | 1 | $38B |
|
||
| Food / Beverage | 1 | $36B |
|
||
| Automotive / Trucks | 1 | $34B |
|
||
Price history
+6.2% since first listed2 events — show timeline
- 2026-04-17 Price Changed $170,000 NWMLS as Distributed by MLS Grid
- 2026-04-17 Listed $160,000 NWMLS as Distributed by MLS Grid
Cash-flow waterfall
monthlySold comps — $/sqft
last 12 mo · ≤1 miLoading sold comps…